

Key Insights
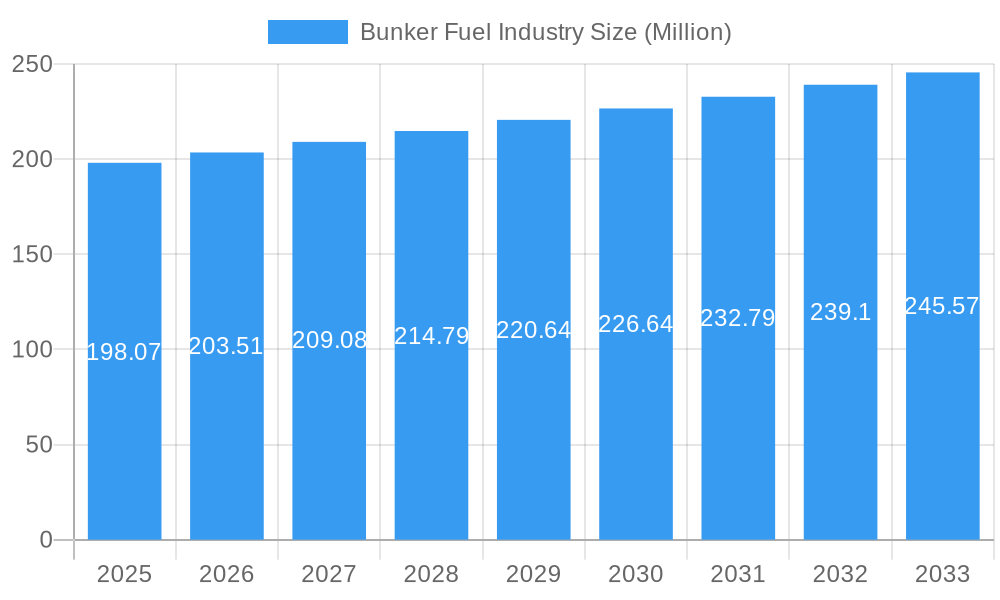
The global Bunker Fuel market is poised for steady growth, with a projected market size of USD 198.07 million in 2025 and an estimated Compound Annual Growth Rate (CAGR) of 2.72% through 2033. This expansion is primarily driven by the increasing volume of global maritime trade, which necessitates a consistent supply of fuels for vessels. Despite evolving environmental regulations, the demand for bunker fuels remains robust, reflecting the critical role of shipping in international commerce. Key drivers include the burgeoning e-commerce sector, which fuels container shipping, and the ongoing energy transition, which, while pushing towards cleaner alternatives, still relies on traditional fuels for a significant portion of the global fleet. Technological advancements in engine efficiency and the development of more environmentally friendly fuel blends are also shaping the market landscape, influencing the adoption of various fuel types.
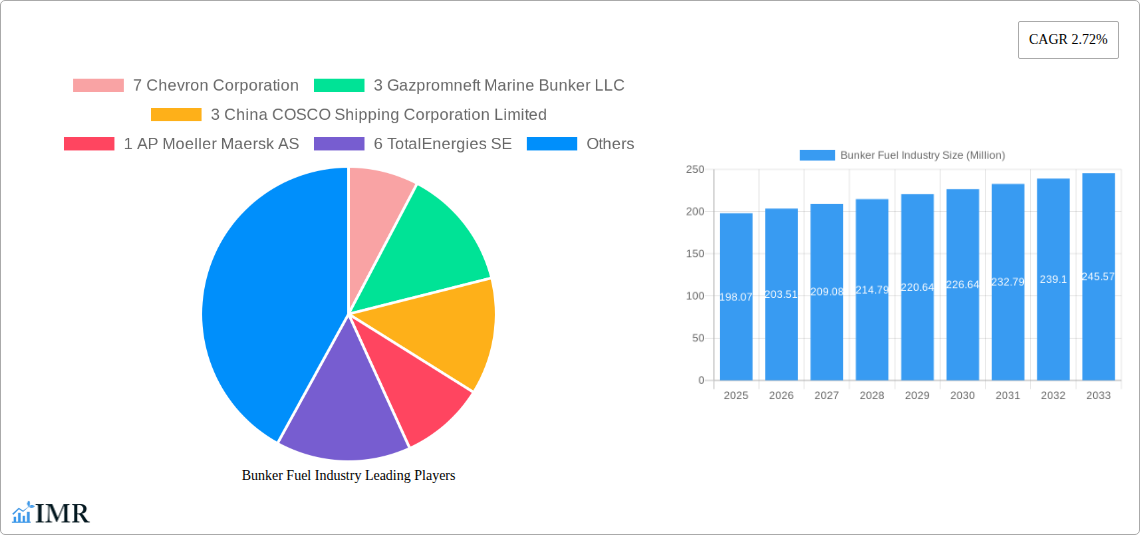
Bunker Fuel Industry Market Size (In Million)
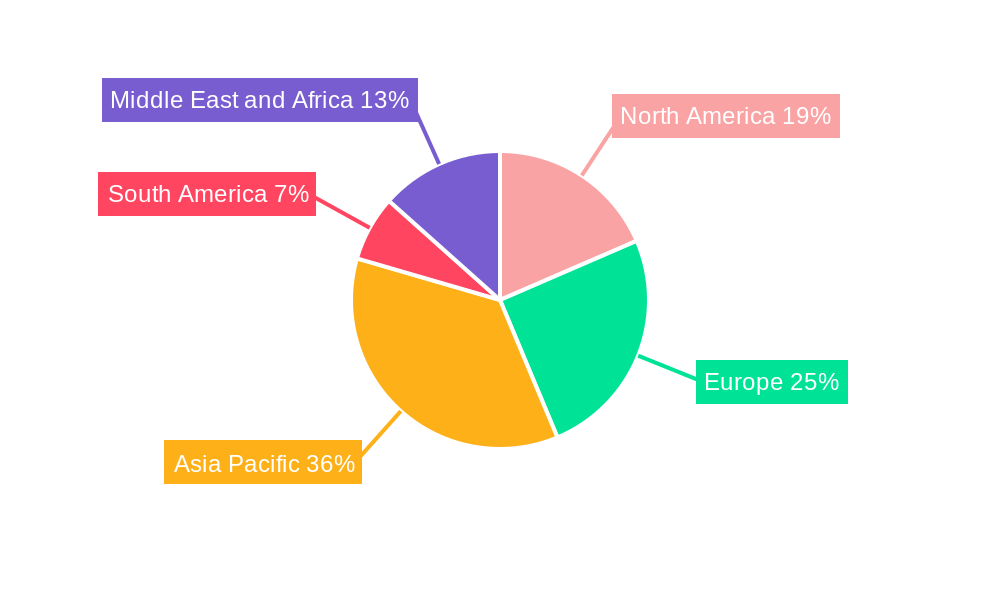
The market is characterized by a dynamic interplay of fuel types and vessel segments. Very Low Sulfur Fuel Oil (VLSFO) is expected to see increased adoption due to International Maritime Organization (IMO) regulations, while Liquefied Natural Gas (LNG) is gaining traction as a cleaner alternative. Container ships and tankers represent the dominant vessel types, accounting for a substantial share of bunker fuel consumption. Geographically, Asia Pacific is anticipated to lead market growth, driven by its status as a major manufacturing hub and a significant contributor to global shipping volumes. However, Europe's stringent environmental policies and North America's advanced infrastructure also present substantial market opportunities. Despite the growth, the market faces restraints such as the volatility of crude oil prices, which directly impact bunker fuel costs, and the significant capital investment required for retrofitting vessels to accommodate alternative fuels.
Bunker Fuel Industry Company Market Share
Comprehensive Bunker Fuel Market Analysis: Forecasts, Trends, and Strategic Insights (2019-2033)
This in-depth report provides a definitive analysis of the global bunker fuel industry, offering critical insights into market dynamics, growth trajectories, regional dominance, product innovation, and key player strategies. Covering the period from 2019 to 2033, with a base and estimated year of 2025, this report is an indispensable resource for stakeholders seeking to navigate the evolving landscape of marine fuels, including ship owners, fuel suppliers, and industry strategists. We delve into the intricacies of both parent and child markets, providing a holistic view of market opportunities and challenges. All values are presented in Million units for clear quantitative understanding.
Bunker Fuel Industry Market Dynamics & Structure
The bunker fuel industry is characterized by a moderate to high market concentration, with a few key players controlling significant market share. However, the ongoing transition towards cleaner marine fuels is fostering increased competition and driving innovation. Technological advancements, particularly in the development and adoption of alternative fuels like Liquefied Natural Gas (LNG) and biofuels, are major innovation drivers. Stringent regulatory frameworks, such as the International Maritime Organization's (IMO) sulfur cap regulations (IMO 2020) and upcoming emissions targets, are fundamentally reshaping market demand and fuel choices. Competitive product substitutes are rapidly emerging, forcing traditional fuel suppliers to adapt. End-user demographics are shifting towards larger shipping companies with greater capacity for adopting new technologies and investing in greener fleets. Mergers and acquisitions (M&A) remain a significant trend, as larger entities seek to consolidate market position, acquire new technologies, and expand their geographical reach. For instance, the past few years have witnessed several strategic alliances and acquisitions aimed at securing supply chains for new fuel types. Barriers to innovation include the high capital expenditure required for new fuel infrastructure, the need for standardized bunkering procedures, and the long lifespan of existing vessel fleets.
- Market Concentration: Dominated by a mix of integrated oil majors and specialized marine fuel suppliers.
- Technological Innovation Drivers: Focus on reducing sulfur emissions, exploring alternative fuels (LNG, methanol, ammonia), and improving fuel efficiency.
- Regulatory Frameworks: IMO 2020, IMO 2030, and future decarbonization mandates are critical influence factors.
- Competitive Product Substitutes: VLSFO, MGO, LNG, biofuels, and future alternative fuels.
- End-User Demographics: Growing demand for sustainable solutions from major shipping lines and charterers.
- M&A Trends: Consolidation to gain market share, access new technologies, and enhance supply chain resilience.
Bunker Fuel Industry Growth Trends & Insights
The bunker fuel industry is projected to experience robust growth, driven by increasing global trade volumes and the imperative to decarbonize maritime operations. Market size evolution shows a steady upward trend, amplified by the shift from High Sulfur Fuel Oil (HSFO) to cleaner alternatives like Very Low Sulfur Fuel Oil (VLSFO) and Marine Gas Oil (MGO). Adoption rates for alternative fuels, particularly LNG, are accelerating, albeit with regional variations. Technological disruptions are at the forefront, with ongoing research and development in methanol, ammonia, and hydrogen-based fuels poised to revolutionize the sector. Consumer behavior shifts are evident, with a growing preference among charterers and cargo owners for vessels and operators demonstrating commitment to environmental, social, and governance (ESG) principles. This includes a willingness to pay premiums for greener fuel options and to engage in long-term partnerships focused on sustainability. The overall market penetration of cleaner fuels is expected to rise significantly throughout the forecast period.
The industry's growth is underpinned by several key metrics. The compound annual growth rate (CAGR) for the bunker fuel market is anticipated to be around 4.5% between 2025 and 2033. This growth will be predominantly fueled by the increasing demand for VLSFO and the expanding adoption of LNG as a transitional fuel. The market for HSFO, while still significant, is expected to see a gradual decline as stricter environmental regulations come into effect globally. The integration of digitalization and advanced logistics management systems by fuel suppliers will also contribute to operational efficiencies and improved service delivery, further stimulating market growth. Investments in bunkering infrastructure for new fuel types will be a critical factor in unlocking future market potential. The evolving regulatory landscape, coupled with advancements in engine technology designed for cleaner fuels, will create a conducive environment for sustained market expansion.
Dominant Regions, Countries, or Segments in Bunker Fuel Industry
The global bunker fuel industry's dominance is multifaceted, with key regions, countries, and segments exhibiting distinct growth drivers and market shares. Asia-Pacific, particularly Singapore, has historically been and continues to be a pivotal hub for bunker fuel trade, driven by its strategic location, extensive port infrastructure, and high vessel traffic. However, the Mediterranean region, spurred by recent developments in LNG bunkering, is rapidly emerging as a significant growth area.
Within Fuel Types, Very Low Sulfur Fuel Oil (VLSFO) is currently the dominant segment, propelled by the IMO 2020 regulations and the ongoing need for compliance across the global fleet. Its dominance is expected to continue through the forecast period, though its market share will be gradually challenged by the rising adoption of Liquefied Natural Gas (LNG). LNG, while a smaller segment presently, exhibits the highest growth potential due to its lower emissions profile and increasing availability. The development of dual-fuel engines and dedicated LNG bunkering facilities are key drivers for its expansion. Marine Gas Oil (MGO) remains a significant segment, particularly for smaller vessels and specific operational requirements. High Sulfur Fuel Oil (HSFO), while still in use, is witnessing a declining trend due to environmental regulations.
Regarding Vessel Types, Containers represent a substantial portion of the bunker fuel market, given the high volume of global containerized trade. Tankers (oil, chemical, and product tankers) also constitute a significant segment due to their extensive operational range and fuel consumption. Bulk Carriers are another major consumer of bunker fuel. The demand from these segments is directly correlated with global trade flows and economic activity.
- Dominant Region: Asia-Pacific (especially Singapore) leads in terms of bunkering volume and infrastructure. The Mediterranean is showing significant growth due to LNG adoption.
- Key Countries: Singapore, Rotterdam, Fujairah, and increasingly, Mediterranean ports like Marseille are critical bunkering centers.
- Dominant Fuel Type (Current): VLSFO, driven by regulatory compliance.
- High Growth Fuel Type: LNG, supported by technological advancements and environmental pressures.
- Dominant Vessel Types: Containers and Tankers account for a significant share of global fuel consumption.
- Key Drivers for Dominance:
- Economic Policies: Trade agreements, port development initiatives, and national energy policies.
- Infrastructure: Availability of advanced bunkering facilities, storage, and distribution networks for various fuel types.
- Regulatory Compliance: Strict adherence to IMO regulations and regional environmental standards.
- Vessel Traffic: High concentration of shipping routes and port calls.
- Technological Adoption: Willingness of key players to invest in and adopt new fuel technologies.
- Market Share and Growth Potential: Asia-Pacific maintains a high market share, while the Mediterranean is demonstrating superior growth potential for alternative fuels.
Bunker Fuel Industry Product Landscape
The bunker fuel industry's product landscape is undergoing a significant transformation, moving beyond traditional fuel oils towards more sustainable and cleaner alternatives. Innovation is primarily focused on reducing sulfur content and greenhouse gas emissions. Very Low Sulfur Fuel Oil (VLSFO) has become a standard offering, meeting stringent sulfur cap regulations. Marine Gas Oil (MGO) continues to be a crucial product for many vessel types. The most dynamic area of innovation lies in the development and scaling of alternative fuels. Liquefied Natural Gas (LNG) is gaining traction as a transitional fuel, offering significant reductions in sulfur dioxide and particulate matter. Companies are investing in dual-fuel engines and bunkering infrastructure to support LNG adoption. Beyond LNG, emerging products include biofuels, methanol, and eventually, ammonia and hydrogen-derived fuels. These advanced products offer unique selling propositions such as near-zero emissions or reduced carbon footprints. Technological advancements in fuel processing, storage, and delivery are crucial for enhancing the performance and safety of these new fuel types, positioning them for wider adoption in the coming years.
Key Drivers, Barriers & Challenges in Bunker Fuel Industry
Key Drivers:
- Stricter Environmental Regulations: IMO 2020 and future decarbonization mandates are compelling the shift to cleaner fuels.
- Growing Global Trade: Increased shipping activity directly boosts demand for bunker fuels.
- Technological Advancements: Development of dual-fuel engines and efficient alternative fuel technologies.
- Corporate Sustainability Goals: Shipping companies are under pressure from stakeholders to reduce their environmental impact.
- Price Volatility of Traditional Fuels: Encourages diversification into more stable and cleaner fuel options.
Barriers & Challenges:
- High Capital Investment: Significant upfront costs for developing new bunkering infrastructure for alternative fuels.
- Infrastructure Gaps: Limited availability of bunkering facilities for LNG, methanol, and other novel fuels in many ports.
- Regulatory Uncertainty: Evolving international and regional regulations create uncertainty for long-term investment decisions.
- Supply Chain Complexity: Establishing reliable and cost-effective supply chains for alternative fuels is challenging.
- Fleet Transition Time: The long lifespan of existing vessels means a slow transition to new fuel technologies.
- Safety Concerns: Handling and storage of new fuels like LNG and ammonia require specialized knowledge and infrastructure.
- Price Competitiveness: Alternative fuels can still be more expensive than traditional fuels on a per-unit basis, impacting operational costs.
Emerging Opportunities in Bunker Fuel Industry
The bunker fuel industry presents significant emerging opportunities, particularly in the realm of sustainable and cleaner energy solutions. The increasing demand for biofuels, including sustainable methanol derived from waste or biomass, offers a near-term solution for decarbonization. The development of green ammonia and hydrogen as zero-carbon marine fuels represents a long-term, transformative opportunity, albeit with substantial technological and infrastructure hurdles to overcome. Regional expansion of LNG bunkering networks in developing maritime hubs provides a clear growth avenue. Furthermore, the integration of digitalization and smart bunkering solutions can enhance efficiency, transparency, and safety across the supply chain, creating new service-based opportunities. The growing focus on circular economy principles within the maritime sector could also unlock opportunities for recycled fuels or novel waste-to-energy solutions.
Growth Accelerators in the Bunker Fuel Industry Industry
Several catalysts are accelerating growth within the bunker fuel industry. The continuous strengthening of environmental regulations by bodies like the IMO and national governments is a primary accelerator, forcing innovation and adoption of cleaner fuels. Technological breakthroughs in engine design, fuel conversion, and storage are making alternative fuels more viable and cost-effective. Strategic partnerships between fuel suppliers, engine manufacturers, and ship owners are crucial for co-developing solutions and de-risking investments in new technologies. Government incentives and subsidies for adopting cleaner fuels and infrastructure development also play a vital role. Finally, market expansion strategies by key players, focusing on emerging shipping routes and underserved regions, are contributing to overall industry growth. The increasing awareness and demand for sustainable shipping practices from cargo owners and the public are also significant growth drivers.
Key Players Shaping the Bunker Fuel Industry Market
- Chevron Corporation
- Gazpromneft Marine Bunker LLC
- China COSCO Shipping Corporation Limited
- AP Moeller Maersk AS
- TotalEnergies SE
- Shell PLC
- Evergreen Marine Corp Taiwan Ltd
- Mediterranean Shipping Company SA
- Clipper Oil
- Yang Ming Marine Transport Corporation
- Ocean Network Express
- Gulf Agency Company Ltd
- Pacific International Lines Pte Ltd
- HMM Co Ltd
- ExxonMobil Corporation
- Bomin Bunker Holding GmbH & Co KG
- PJSC Lukoil Oil Company
- Hapag-Lloyd AG
- BP PLC
Notable Milestones in Bunker Fuel Industry Sector
- January 2022: Titan LNG secured the tender for the delivery of LNG in the Port of Marseille for Corsica Linea's new Ro-Pax LNG fueled ferry. This partnership indicates the expansion of Titan LNG's operation into the Mediterranean that will enhance the availability of LNG, bioLNG, and in the longer run, hydrogen-derived LNG in the region.
- November 2022: Nimofast Brasil S.A., the natural gas trader, has signed a partnership agreement with the Norwegian company Kanfer Shipping AS in which Nimofast will provide small and medium-scale LNG shipping, small-scale floating storage units (FSU) and LNG bunkering solutions for Kanfer's clients in Brazil.
In-Depth Bunker Fuel Industry Market Outlook
The bunker fuel industry is poised for a dynamic future, driven by a confluence of regulatory pressures, technological innovation, and a global commitment to decarbonization. Growth accelerators, including the expansion of LNG bunkering infrastructure, the pioneering development of methanol and ammonia as marine fuels, and the increasing integration of digital solutions for optimized fuel delivery and management, are setting the stage for significant market evolution. Strategic alliances between major energy companies and shipping conglomerates will be pivotal in scaling these cleaner fuel solutions and ensuring supply chain reliability. The outlook points towards a diversified fuel mix, with a sustained demand for VLSFO in the medium term, a rapid rise in LNG adoption, and ambitious long-term prospects for zero-carbon fuels like green ammonia and hydrogen. Stakeholders who strategically invest in infrastructure, technology, and sustainable practices will be best positioned to capitalize on the transformative opportunities within this critical global industry.
Bunker Fuel Industry Segmentation
-
1. Fuel Type
- 1.1. High Sulfur Fuel Oil (HSFO)
- 1.2. Very Low Sulfur Fuel Oil (VLSFO)
- 1.3. Marine Gas Oil (MGO)
- 1.4. Liquefied Natural Gas (LNG)
- 1.5. Other Fuel Types
-
2. Vessel Type
- 2.1. Containers
- 2.2. Tankers
- 2.3. General Cargo
- 2.4. Bulk Carriers
- 2.5. Other Vessel Types
Bunker Fuel Industry Segmentation By Geography
-
1. North America
- 1.1. United States
- 1.2. Canada
- 1.3. Rest of North America
-
2. Europe
- 2.1. Germany
- 2.2. France
- 2.3. United Kingdom
- 2.4. Spain
- 2.5. NORDIC
- 2.6. Turkey
- 2.7. Russia
- 2.8. Rest of Europe
-
3. Asia Pacific
- 3.1. China
- 3.2. India
- 3.3. Japan
- 3.4. South Korea
- 3.5. Malaysia
- 3.6. Thailand
- 3.7. Indonesia
- 3.8. Vietnam
- 3.9. Rest of Asia Pacific
-
4. South America
- 4.1. Brazil
- 4.2. Argentina
- 4.3. Colombia
- 4.4. Rest of South America
-
5. Middle East and Africa
- 5.1. Saudi Arabia
- 5.2. United Arab Emirates
- 5.3. South Africa
- 5.4. Nigeria
- 5.5. Qatar
- 5.6. Egypt
- 5.7. Rest of Middle East and Africa
Bunker Fuel Industry Regional Market Share
Geographic Coverage of Bunker Fuel Industry
Bunker Fuel Industry REPORT HIGHLIGHTS
| Aspects | Details |
|---|---|
| Study Period | 2020-2034 |
| Base Year | 2025 |
| Estimated Year | 2026 |
| Forecast Period | 2026-2034 |
| Historical Period | 2020-2025 |
| Growth Rate | CAGR of 2.72% from 2020-2034 |
| Segmentation |
|
Table of Contents
- 1. Introduction
- 1.1. Research Scope
- 1.2. Market Segmentation
- 1.3. Research Objective
- 1.4. Definitions and Assumptions
- 2. Executive Summary
- 2.1. Market Snapshot
- 3. Market Dynamics
- 3.1. Market Drivers
- 3.2. Market Restrains
- 3.3. Market Trends
- 3.4. Market Opportunities
- 4. Market Factor Analysis
- 4.1. Porters Five Forces
- 4.1.1. Bargaining Power of Suppliers
- 4.1.2. Bargaining Power of Buyers
- 4.1.3. Threat of New Entrants
- 4.1.4. Threat of Substitutes
- 4.1.5. Competitive Rivalry
- 4.2. PESTEL analysis
- 4.3. BCG Analysis
- 4.3.1. Stars (High Growth, High Market Share)
- 4.3.2. Cash Cows (Low Growth, High Market Share)
- 4.3.3. Question Mark (High Growth, Low Market Share)
- 4.3.4. Dogs (Low Growth, Low Market Share)
- 4.4. Ansoff Matrix Analysis
- 4.5. Supply Chain Analysis
- 4.6. Regulatory Landscape
- 4.7. Current Market Potential and Opportunity Assessment (TAM–SAM–SOM Framework)
- 4.8. IMR Analyst Note
- 4.1. Porters Five Forces
- 5. Market Analysis, Insights and Forecast 2021-2033
- 5.1. Market Analysis, Insights and Forecast - by Fuel Type
- 5.1.1. High Sulfur Fuel Oil (HSFO)
- 5.1.2. Very Low Sulfur Fuel Oil (VLSFO)
- 5.1.3. Marine Gas Oil (MGO)
- 5.1.4. Liquefied Natural Gas (LNG)
- 5.1.5. Other Fuel Types
- 5.2. Market Analysis, Insights and Forecast - by Vessel Type
- 5.2.1. Containers
- 5.2.2. Tankers
- 5.2.3. General Cargo
- 5.2.4. Bulk Carriers
- 5.2.5. Other Vessel Types
- 5.3. Market Analysis, Insights and Forecast - by Region
- 5.3.1. North America
- 5.3.2. Europe
- 5.3.3. Asia Pacific
- 5.3.4. South America
- 5.3.5. Middle East and Africa
- 5.1. Market Analysis, Insights and Forecast - by Fuel Type
- 6. Global Bunker Fuel Industry Analysis, Insights and Forecast, 2021-2033
- 6.1. Market Analysis, Insights and Forecast - by Fuel Type
- 6.1.1. High Sulfur Fuel Oil (HSFO)
- 6.1.2. Very Low Sulfur Fuel Oil (VLSFO)
- 6.1.3. Marine Gas Oil (MGO)
- 6.1.4. Liquefied Natural Gas (LNG)
- 6.1.5. Other Fuel Types
- 6.2. Market Analysis, Insights and Forecast - by Vessel Type
- 6.2.1. Containers
- 6.2.2. Tankers
- 6.2.3. General Cargo
- 6.2.4. Bulk Carriers
- 6.2.5. Other Vessel Types
- 6.1. Market Analysis, Insights and Forecast - by Fuel Type
- 7. North America Bunker Fuel Industry Analysis, Insights and Forecast, 2020-2032
- 7.1. Market Analysis, Insights and Forecast - by Fuel Type
- 7.1.1. High Sulfur Fuel Oil (HSFO)
- 7.1.2. Very Low Sulfur Fuel Oil (VLSFO)
- 7.1.3. Marine Gas Oil (MGO)
- 7.1.4. Liquefied Natural Gas (LNG)
- 7.1.5. Other Fuel Types
- 7.2. Market Analysis, Insights and Forecast - by Vessel Type
- 7.2.1. Containers
- 7.2.2. Tankers
- 7.2.3. General Cargo
- 7.2.4. Bulk Carriers
- 7.2.5. Other Vessel Types
- 7.1. Market Analysis, Insights and Forecast - by Fuel Type
- 8. Europe Bunker Fuel Industry Analysis, Insights and Forecast, 2020-2032
- 8.1. Market Analysis, Insights and Forecast - by Fuel Type
- 8.1.1. High Sulfur Fuel Oil (HSFO)
- 8.1.2. Very Low Sulfur Fuel Oil (VLSFO)
- 8.1.3. Marine Gas Oil (MGO)
- 8.1.4. Liquefied Natural Gas (LNG)
- 8.1.5. Other Fuel Types
- 8.2. Market Analysis, Insights and Forecast - by Vessel Type
- 8.2.1. Containers
- 8.2.2. Tankers
- 8.2.3. General Cargo
- 8.2.4. Bulk Carriers
- 8.2.5. Other Vessel Types
- 8.1. Market Analysis, Insights and Forecast - by Fuel Type
- 9. Asia Pacific Bunker Fuel Industry Analysis, Insights and Forecast, 2020-2032
- 9.1. Market Analysis, Insights and Forecast - by Fuel Type
- 9.1.1. High Sulfur Fuel Oil (HSFO)
- 9.1.2. Very Low Sulfur Fuel Oil (VLSFO)
- 9.1.3. Marine Gas Oil (MGO)
- 9.1.4. Liquefied Natural Gas (LNG)
- 9.1.5. Other Fuel Types
- 9.2. Market Analysis, Insights and Forecast - by Vessel Type
- 9.2.1. Containers
- 9.2.2. Tankers
- 9.2.3. General Cargo
- 9.2.4. Bulk Carriers
- 9.2.5. Other Vessel Types
- 9.1. Market Analysis, Insights and Forecast - by Fuel Type
- 10. South America Bunker Fuel Industry Analysis, Insights and Forecast, 2020-2032
- 10.1. Market Analysis, Insights and Forecast - by Fuel Type
- 10.1.1. High Sulfur Fuel Oil (HSFO)
- 10.1.2. Very Low Sulfur Fuel Oil (VLSFO)
- 10.1.3. Marine Gas Oil (MGO)
- 10.1.4. Liquefied Natural Gas (LNG)
- 10.1.5. Other Fuel Types
- 10.2. Market Analysis, Insights and Forecast - by Vessel Type
- 10.2.1. Containers
- 10.2.2. Tankers
- 10.2.3. General Cargo
- 10.2.4. Bulk Carriers
- 10.2.5. Other Vessel Types
- 10.1. Market Analysis, Insights and Forecast - by Fuel Type
- 11. Middle East and Africa Bunker Fuel Industry Analysis, Insights and Forecast, 2020-2032
- 11.1. Market Analysis, Insights and Forecast - by Fuel Type
- 11.1.1. High Sulfur Fuel Oil (HSFO)
- 11.1.2. Very Low Sulfur Fuel Oil (VLSFO)
- 11.1.3. Marine Gas Oil (MGO)
- 11.1.4. Liquefied Natural Gas (LNG)
- 11.1.5. Other Fuel Types
- 11.2. Market Analysis, Insights and Forecast - by Vessel Type
- 11.2.1. Containers
- 11.2.2. Tankers
- 11.2.3. General Cargo
- 11.2.4. Bulk Carriers
- 11.2.5. Other Vessel Types
- 11.1. Market Analysis, Insights and Forecast - by Fuel Type
- 12. Competitive Analysis
- 12.1. Company Profiles
- 12.1.1 7 Chevron Corporation
- 12.1.1.1. Company Overview
- 12.1.1.2. Products
- 12.1.1.3. Company Financials
- 12.1.1.4. SWOT Analysis
- 12.1.2 3 Gazpromneft Marine Bunker LLC
- 12.1.2.1. Company Overview
- 12.1.2.2. Products
- 12.1.2.3. Company Financials
- 12.1.2.4. SWOT Analysis
- 12.1.3 3 China COSCO Shipping Corporation Limited
- 12.1.3.1. Company Overview
- 12.1.3.2. Products
- 12.1.3.3. Company Financials
- 12.1.3.4. SWOT Analysis
- 12.1.4 1 AP Moeller Maersk AS
- 12.1.4.1. Company Overview
- 12.1.4.2. Products
- 12.1.4.3. Company Financials
- 12.1.4.4. SWOT Analysis
- 12.1.5 6 TotalEnergies SE
- 12.1.5.1. Company Overview
- 12.1.5.2. Products
- 12.1.5.3. Company Financials
- 12.1.5.4. SWOT Analysis
- 12.1.6 2 Shell PLC
- 12.1.6.1. Company Overview
- 12.1.6.2. Products
- 12.1.6.3. Company Financials
- 12.1.6.4. SWOT Analysis
- 12.1.7 7 Evergreen Marine Corp Taiwan Ltd
- 12.1.7.1. Company Overview
- 12.1.7.2. Products
- 12.1.7.3. Company Financials
- 12.1.7.4. SWOT Analysis
- 12.1.8 2 Mediterranean Shipping Company SA
- 12.1.8.1. Company Overview
- 12.1.8.2. Products
- 12.1.8.3. Company Financials
- 12.1.8.4. SWOT Analysis
- 12.1.9 Ship Owners
- 12.1.9.1. Company Overview
- 12.1.9.2. Products
- 12.1.9.3. Company Financials
- 12.1.9.4. SWOT Analysis
- 12.1.10 8 Clipper Oil
- 12.1.10.1. Company Overview
- 12.1.10.2. Products
- 12.1.10.3. Company Financials
- 12.1.10.4. SWOT Analysis
- 12.1.11 8 Yang Ming Marine Transport Corporation
- 12.1.11.1. Company Overview
- 12.1.11.2. Products
- 12.1.11.3. Company Financials
- 12.1.11.4. SWOT Analysis
- 12.1.12 Fuel Suppliers
- 12.1.12.1. Company Overview
- 12.1.12.2. Products
- 12.1.12.3. Company Financials
- 12.1.12.4. SWOT Analysis
- 12.1.13 6 Ocean Network Express
- 12.1.13.1. Company Overview
- 12.1.13.2. Products
- 12.1.13.3. Company Financials
- 12.1.13.4. SWOT Analysis
- 12.1.14 9 Gulf Agency Company Ltd
- 12.1.14.1. Company Overview
- 12.1.14.2. Products
- 12.1.14.3. Company Financials
- 12.1.14.4. SWOT Analysis
- 12.1.15 10 Pacific International Lines Pte Ltd*List Not Exhaustive
- 12.1.15.1. Company Overview
- 12.1.15.2. Products
- 12.1.15.3. Company Financials
- 12.1.15.4. SWOT Analysis
- 12.1.16 9 HMM Co Ltd
- 12.1.16.1. Company Overview
- 12.1.16.2. Products
- 12.1.16.3. Company Financials
- 12.1.16.4. SWOT Analysis
- 12.1.17 4 CMA CGM Group
- 12.1.17.1. Company Overview
- 12.1.17.2. Products
- 12.1.17.3. Company Financials
- 12.1.17.4. SWOT Analysis
- 12.1.18 1 ExxonMobil Corporation
- 12.1.18.1. Company Overview
- 12.1.18.2. Products
- 12.1.18.3. Company Financials
- 12.1.18.4. SWOT Analysis
- 12.1.19 10 Bomin Bunker Holding GmbH & Co KG
- 12.1.19.1. Company Overview
- 12.1.19.2. Products
- 12.1.19.3. Company Financials
- 12.1.19.4. SWOT Analysis
- 12.1.20 5 PJSC Lukoil Oil Company
- 12.1.20.1. Company Overview
- 12.1.20.2. Products
- 12.1.20.3. Company Financials
- 12.1.20.4. SWOT Analysis
- 12.1.21 5 Hapag-Lloyd AG
- 12.1.21.1. Company Overview
- 12.1.21.2. Products
- 12.1.21.3. Company Financials
- 12.1.21.4. SWOT Analysis
- 12.1.22 4 BP PLC
- 12.1.22.1. Company Overview
- 12.1.22.2. Products
- 12.1.22.3. Company Financials
- 12.1.22.4. SWOT Analysis
- 12.1.1 7 Chevron Corporation
- 12.2. Market Entropy
- 12.2.1 Company's Key Areas Served
- 12.2.2 Recent Developments
- 12.3. Company Market Share Analysis 2025
- 12.3.1 Top 5 Companies Market Share Analysis
- 12.3.2 Top 3 Companies Market Share Analysis
- 12.4. List of Potential Customers
- 13. Research Methodology
List of Figures
- Figure 1: Global Bunker Fuel Industry Revenue Breakdown (Million, %) by Region 2025 & 2033
- Figure 2: Global Bunker Fuel Industry Volume Breakdown (metric tonnes, %) by Region 2025 & 2033
- Figure 3: North America Bunker Fuel Industry Revenue (Million), by Fuel Type 2025 & 2033
- Figure 4: North America Bunker Fuel Industry Volume (metric tonnes), by Fuel Type 2025 & 2033
- Figure 5: North America Bunker Fuel Industry Revenue Share (%), by Fuel Type 2025 & 2033
- Figure 6: North America Bunker Fuel Industry Volume Share (%), by Fuel Type 2025 & 2033
- Figure 7: North America Bunker Fuel Industry Revenue (Million), by Vessel Type 2025 & 2033
- Figure 8: North America Bunker Fuel Industry Volume (metric tonnes), by Vessel Type 2025 & 2033
- Figure 9: North America Bunker Fuel Industry Revenue Share (%), by Vessel Type 2025 & 2033
- Figure 10: North America Bunker Fuel Industry Volume Share (%), by Vessel Type 2025 & 2033
- Figure 11: North America Bunker Fuel Industry Revenue (Million), by Country 2025 & 2033
- Figure 12: North America Bunker Fuel Industry Volume (metric tonnes), by Country 2025 & 2033
- Figure 13: North America Bunker Fuel Industry Revenue Share (%), by Country 2025 & 2033
- Figure 14: North America Bunker Fuel Industry Volume Share (%), by Country 2025 & 2033
- Figure 15: Europe Bunker Fuel Industry Revenue (Million), by Fuel Type 2025 & 2033
- Figure 16: Europe Bunker Fuel Industry Volume (metric tonnes), by Fuel Type 2025 & 2033
- Figure 17: Europe Bunker Fuel Industry Revenue Share (%), by Fuel Type 2025 & 2033
- Figure 18: Europe Bunker Fuel Industry Volume Share (%), by Fuel Type 2025 & 2033
- Figure 19: Europe Bunker Fuel Industry Revenue (Million), by Vessel Type 2025 & 2033
- Figure 20: Europe Bunker Fuel Industry Volume (metric tonnes), by Vessel Type 2025 & 2033
- Figure 21: Europe Bunker Fuel Industry Revenue Share (%), by Vessel Type 2025 & 2033
- Figure 22: Europe Bunker Fuel Industry Volume Share (%), by Vessel Type 2025 & 2033
- Figure 23: Europe Bunker Fuel Industry Revenue (Million), by Country 2025 & 2033
- Figure 24: Europe Bunker Fuel Industry Volume (metric tonnes), by Country 2025 & 2033
- Figure 25: Europe Bunker Fuel Industry Revenue Share (%), by Country 2025 & 2033
- Figure 26: Europe Bunker Fuel Industry Volume Share (%), by Country 2025 & 2033
- Figure 27: Asia Pacific Bunker Fuel Industry Revenue (Million), by Fuel Type 2025 & 2033
- Figure 28: Asia Pacific Bunker Fuel Industry Volume (metric tonnes), by Fuel Type 2025 & 2033
- Figure 29: Asia Pacific Bunker Fuel Industry Revenue Share (%), by Fuel Type 2025 & 2033
- Figure 30: Asia Pacific Bunker Fuel Industry Volume Share (%), by Fuel Type 2025 & 2033
- Figure 31: Asia Pacific Bunker Fuel Industry Revenue (Million), by Vessel Type 2025 & 2033
- Figure 32: Asia Pacific Bunker Fuel Industry Volume (metric tonnes), by Vessel Type 2025 & 2033
- Figure 33: Asia Pacific Bunker Fuel Industry Revenue Share (%), by Vessel Type 2025 & 2033
- Figure 34: Asia Pacific Bunker Fuel Industry Volume Share (%), by Vessel Type 2025 & 2033
- Figure 35: Asia Pacific Bunker Fuel Industry Revenue (Million), by Country 2025 & 2033
- Figure 36: Asia Pacific Bunker Fuel Industry Volume (metric tonnes), by Country 2025 & 2033
- Figure 37: Asia Pacific Bunker Fuel Industry Revenue Share (%), by Country 2025 & 2033
- Figure 38: Asia Pacific Bunker Fuel Industry Volume Share (%), by Country 2025 & 2033
- Figure 39: South America Bunker Fuel Industry Revenue (Million), by Fuel Type 2025 & 2033
- Figure 40: South America Bunker Fuel Industry Volume (metric tonnes), by Fuel Type 2025 & 2033
- Figure 41: South America Bunker Fuel Industry Revenue Share (%), by Fuel Type 2025 & 2033
- Figure 42: South America Bunker Fuel Industry Volume Share (%), by Fuel Type 2025 & 2033
- Figure 43: South America Bunker Fuel Industry Revenue (Million), by Vessel Type 2025 & 2033
- Figure 44: South America Bunker Fuel Industry Volume (metric tonnes), by Vessel Type 2025 & 2033
- Figure 45: South America Bunker Fuel Industry Revenue Share (%), by Vessel Type 2025 & 2033
- Figure 46: South America Bunker Fuel Industry Volume Share (%), by Vessel Type 2025 & 2033
- Figure 47: South America Bunker Fuel Industry Revenue (Million), by Country 2025 & 2033
- Figure 48: South America Bunker Fuel Industry Volume (metric tonnes), by Country 2025 & 2033
- Figure 49: South America Bunker Fuel Industry Revenue Share (%), by Country 2025 & 2033
- Figure 50: South America Bunker Fuel Industry Volume Share (%), by Country 2025 & 2033
- Figure 51: Middle East and Africa Bunker Fuel Industry Revenue (Million), by Fuel Type 2025 & 2033
- Figure 52: Middle East and Africa Bunker Fuel Industry Volume (metric tonnes), by Fuel Type 2025 & 2033
- Figure 53: Middle East and Africa Bunker Fuel Industry Revenue Share (%), by Fuel Type 2025 & 2033
- Figure 54: Middle East and Africa Bunker Fuel Industry Volume Share (%), by Fuel Type 2025 & 2033
- Figure 55: Middle East and Africa Bunker Fuel Industry Revenue (Million), by Vessel Type 2025 & 2033
- Figure 56: Middle East and Africa Bunker Fuel Industry Volume (metric tonnes), by Vessel Type 2025 & 2033
- Figure 57: Middle East and Africa Bunker Fuel Industry Revenue Share (%), by Vessel Type 2025 & 2033
- Figure 58: Middle East and Africa Bunker Fuel Industry Volume Share (%), by Vessel Type 2025 & 2033
- Figure 59: Middle East and Africa Bunker Fuel Industry Revenue (Million), by Country 2025 & 2033
- Figure 60: Middle East and Africa Bunker Fuel Industry Volume (metric tonnes), by Country 2025 & 2033
- Figure 61: Middle East and Africa Bunker Fuel Industry Revenue Share (%), by Country 2025 & 2033
- Figure 62: Middle East and Africa Bunker Fuel Industry Volume Share (%), by Country 2025 & 2033
List of Tables
- Table 1: Global Bunker Fuel Industry Revenue Million Forecast, by Fuel Type 2020 & 2033
- Table 2: Global Bunker Fuel Industry Volume metric tonnes Forecast, by Fuel Type 2020 & 2033
- Table 3: Global Bunker Fuel Industry Revenue Million Forecast, by Vessel Type 2020 & 2033
- Table 4: Global Bunker Fuel Industry Volume metric tonnes Forecast, by Vessel Type 2020 & 2033
- Table 5: Global Bunker Fuel Industry Revenue Million Forecast, by Region 2020 & 2033
- Table 6: Global Bunker Fuel Industry Volume metric tonnes Forecast, by Region 2020 & 2033
- Table 7: Global Bunker Fuel Industry Revenue Million Forecast, by Fuel Type 2020 & 2033
- Table 8: Global Bunker Fuel Industry Volume metric tonnes Forecast, by Fuel Type 2020 & 2033
- Table 9: Global Bunker Fuel Industry Revenue Million Forecast, by Vessel Type 2020 & 2033
- Table 10: Global Bunker Fuel Industry Volume metric tonnes Forecast, by Vessel Type 2020 & 2033
- Table 11: Global Bunker Fuel Industry Revenue Million Forecast, by Country 2020 & 2033
- Table 12: Global Bunker Fuel Industry Volume metric tonnes Forecast, by Country 2020 & 2033
- Table 13: United States Bunker Fuel Industry Revenue (Million) Forecast, by Application 2020 & 2033
- Table 14: United States Bunker Fuel Industry Volume (metric tonnes) Forecast, by Application 2020 & 2033
- Table 15: Canada Bunker Fuel Industry Revenue (Million) Forecast, by Application 2020 & 2033
- Table 16: Canada Bunker Fuel Industry Volume (metric tonnes) Forecast, by Application 2020 & 2033
- Table 17: Rest of North America Bunker Fuel Industry Revenue (Million) Forecast, by Application 2020 & 2033
- Table 18: Rest of North America Bunker Fuel Industry Volume (metric tonnes) Forecast, by Application 2020 & 2033
- Table 19: Global Bunker Fuel Industry Revenue Million Forecast, by Fuel Type 2020 & 2033
- Table 20: Global Bunker Fuel Industry Volume metric tonnes Forecast, by Fuel Type 2020 & 2033
- Table 21: Global Bunker Fuel Industry Revenue Million Forecast, by Vessel Type 2020 & 2033
- Table 22: Global Bunker Fuel Industry Volume metric tonnes Forecast, by Vessel Type 2020 & 2033
- Table 23: Global Bunker Fuel Industry Revenue Million Forecast, by Country 2020 & 2033
- Table 24: Global Bunker Fuel Industry Volume metric tonnes Forecast, by Country 2020 & 2033
- Table 25: Germany Bunker Fuel Industry Revenue (Million) Forecast, by Application 2020 & 2033
- Table 26: Germany Bunker Fuel Industry Volume (metric tonnes) Forecast, by Application 2020 & 2033
- Table 27: France Bunker Fuel Industry Revenue (Million) Forecast, by Application 2020 & 2033
- Table 28: France Bunker Fuel Industry Volume (metric tonnes) Forecast, by Application 2020 & 2033
- Table 29: United Kingdom Bunker Fuel Industry Revenue (Million) Forecast, by Application 2020 & 2033
- Table 30: United Kingdom Bunker Fuel Industry Volume (metric tonnes) Forecast, by Application 2020 & 2033
- Table 31: Spain Bunker Fuel Industry Revenue (Million) Forecast, by Application 2020 & 2033
- Table 32: Spain Bunker Fuel Industry Volume (metric tonnes) Forecast, by Application 2020 & 2033
- Table 33: NORDIC Bunker Fuel Industry Revenue (Million) Forecast, by Application 2020 & 2033
- Table 34: NORDIC Bunker Fuel Industry Volume (metric tonnes) Forecast, by Application 2020 & 2033
- Table 35: Turkey Bunker Fuel Industry Revenue (Million) Forecast, by Application 2020 & 2033
- Table 36: Turkey Bunker Fuel Industry Volume (metric tonnes) Forecast, by Application 2020 & 2033
- Table 37: Russia Bunker Fuel Industry Revenue (Million) Forecast, by Application 2020 & 2033
- Table 38: Russia Bunker Fuel Industry Volume (metric tonnes) Forecast, by Application 2020 & 2033
- Table 39: Rest of Europe Bunker Fuel Industry Revenue (Million) Forecast, by Application 2020 & 2033
- Table 40: Rest of Europe Bunker Fuel Industry Volume (metric tonnes) Forecast, by Application 2020 & 2033
- Table 41: Global Bunker Fuel Industry Revenue Million Forecast, by Fuel Type 2020 & 2033
- Table 42: Global Bunker Fuel Industry Volume metric tonnes Forecast, by Fuel Type 2020 & 2033
- Table 43: Global Bunker Fuel Industry Revenue Million Forecast, by Vessel Type 2020 & 2033
- Table 44: Global Bunker Fuel Industry Volume metric tonnes Forecast, by Vessel Type 2020 & 2033
- Table 45: Global Bunker Fuel Industry Revenue Million Forecast, by Country 2020 & 2033
- Table 46: Global Bunker Fuel Industry Volume metric tonnes Forecast, by Country 2020 & 2033
- Table 47: China Bunker Fuel Industry Revenue (Million) Forecast, by Application 2020 & 2033
- Table 48: China Bunker Fuel Industry Volume (metric tonnes) Forecast, by Application 2020 & 2033
- Table 49: India Bunker Fuel Industry Revenue (Million) Forecast, by Application 2020 & 2033
- Table 50: India Bunker Fuel Industry Volume (metric tonnes) Forecast, by Application 2020 & 2033
- Table 51: Japan Bunker Fuel Industry Revenue (Million) Forecast, by Application 2020 & 2033
- Table 52: Japan Bunker Fuel Industry Volume (metric tonnes) Forecast, by Application 2020 & 2033
- Table 53: South Korea Bunker Fuel Industry Revenue (Million) Forecast, by Application 2020 & 2033
- Table 54: South Korea Bunker Fuel Industry Volume (metric tonnes) Forecast, by Application 2020 & 2033
- Table 55: Malaysia Bunker Fuel Industry Revenue (Million) Forecast, by Application 2020 & 2033
- Table 56: Malaysia Bunker Fuel Industry Volume (metric tonnes) Forecast, by Application 2020 & 2033
- Table 57: Thailand Bunker Fuel Industry Revenue (Million) Forecast, by Application 2020 & 2033
- Table 58: Thailand Bunker Fuel Industry Volume (metric tonnes) Forecast, by Application 2020 & 2033
- Table 59: Indonesia Bunker Fuel Industry Revenue (Million) Forecast, by Application 2020 & 2033
- Table 60: Indonesia Bunker Fuel Industry Volume (metric tonnes) Forecast, by Application 2020 & 2033
- Table 61: Vietnam Bunker Fuel Industry Revenue (Million) Forecast, by Application 2020 & 2033
- Table 62: Vietnam Bunker Fuel Industry Volume (metric tonnes) Forecast, by Application 2020 & 2033
- Table 63: Rest of Asia Pacific Bunker Fuel Industry Revenue (Million) Forecast, by Application 2020 & 2033
- Table 64: Rest of Asia Pacific Bunker Fuel Industry Volume (metric tonnes) Forecast, by Application 2020 & 2033
- Table 65: Global Bunker Fuel Industry Revenue Million Forecast, by Fuel Type 2020 & 2033
- Table 66: Global Bunker Fuel Industry Volume metric tonnes Forecast, by Fuel Type 2020 & 2033
- Table 67: Global Bunker Fuel Industry Revenue Million Forecast, by Vessel Type 2020 & 2033
- Table 68: Global Bunker Fuel Industry Volume metric tonnes Forecast, by Vessel Type 2020 & 2033
- Table 69: Global Bunker Fuel Industry Revenue Million Forecast, by Country 2020 & 2033
- Table 70: Global Bunker Fuel Industry Volume metric tonnes Forecast, by Country 2020 & 2033
- Table 71: Brazil Bunker Fuel Industry Revenue (Million) Forecast, by Application 2020 & 2033
- Table 72: Brazil Bunker Fuel Industry Volume (metric tonnes) Forecast, by Application 2020 & 2033
- Table 73: Argentina Bunker Fuel Industry Revenue (Million) Forecast, by Application 2020 & 2033
- Table 74: Argentina Bunker Fuel Industry Volume (metric tonnes) Forecast, by Application 2020 & 2033
- Table 75: Colombia Bunker Fuel Industry Revenue (Million) Forecast, by Application 2020 & 2033
- Table 76: Colombia Bunker Fuel Industry Volume (metric tonnes) Forecast, by Application 2020 & 2033
- Table 77: Rest of South America Bunker Fuel Industry Revenue (Million) Forecast, by Application 2020 & 2033
- Table 78: Rest of South America Bunker Fuel Industry Volume (metric tonnes) Forecast, by Application 2020 & 2033
- Table 79: Global Bunker Fuel Industry Revenue Million Forecast, by Fuel Type 2020 & 2033
- Table 80: Global Bunker Fuel Industry Volume metric tonnes Forecast, by Fuel Type 2020 & 2033
- Table 81: Global Bunker Fuel Industry Revenue Million Forecast, by Vessel Type 2020 & 2033
- Table 82: Global Bunker Fuel Industry Volume metric tonnes Forecast, by Vessel Type 2020 & 2033
- Table 83: Global Bunker Fuel Industry Revenue Million Forecast, by Country 2020 & 2033
- Table 84: Global Bunker Fuel Industry Volume metric tonnes Forecast, by Country 2020 & 2033
- Table 85: Saudi Arabia Bunker Fuel Industry Revenue (Million) Forecast, by Application 2020 & 2033
- Table 86: Saudi Arabia Bunker Fuel Industry Volume (metric tonnes) Forecast, by Application 2020 & 2033
- Table 87: United Arab Emirates Bunker Fuel Industry Revenue (Million) Forecast, by Application 2020 & 2033
- Table 88: United Arab Emirates Bunker Fuel Industry Volume (metric tonnes) Forecast, by Application 2020 & 2033
- Table 89: South Africa Bunker Fuel Industry Revenue (Million) Forecast, by Application 2020 & 2033
- Table 90: South Africa Bunker Fuel Industry Volume (metric tonnes) Forecast, by Application 2020 & 2033
- Table 91: Nigeria Bunker Fuel Industry Revenue (Million) Forecast, by Application 2020 & 2033
- Table 92: Nigeria Bunker Fuel Industry Volume (metric tonnes) Forecast, by Application 2020 & 2033
- Table 93: Qatar Bunker Fuel Industry Revenue (Million) Forecast, by Application 2020 & 2033
- Table 94: Qatar Bunker Fuel Industry Volume (metric tonnes) Forecast, by Application 2020 & 2033
- Table 95: Egypt Bunker Fuel Industry Revenue (Million) Forecast, by Application 2020 & 2033
- Table 96: Egypt Bunker Fuel Industry Volume (metric tonnes) Forecast, by Application 2020 & 2033
- Table 97: Rest of Middle East and Africa Bunker Fuel Industry Revenue (Million) Forecast, by Application 2020 & 2033
- Table 98: Rest of Middle East and Africa Bunker Fuel Industry Volume (metric tonnes) Forecast, by Application 2020 & 2033
Frequently Asked Questions
1. What is the projected Compound Annual Growth Rate (CAGR) of the Bunker Fuel Industry?
The projected CAGR is approximately 2.72%.
2. Which companies are prominent players in the Bunker Fuel Industry?
Key companies in the market include 7 Chevron Corporation, 3 Gazpromneft Marine Bunker LLC, 3 China COSCO Shipping Corporation Limited, 1 AP Moeller Maersk AS, 6 TotalEnergies SE, 2 Shell PLC, 7 Evergreen Marine Corp Taiwan Ltd, 2 Mediterranean Shipping Company SA, Ship Owners, 8 Clipper Oil, 8 Yang Ming Marine Transport Corporation, Fuel Suppliers, 6 Ocean Network Express, 9 Gulf Agency Company Ltd, 10 Pacific International Lines Pte Ltd*List Not Exhaustive, 9 HMM Co Ltd, 4 CMA CGM Group, 1 ExxonMobil Corporation, 10 Bomin Bunker Holding GmbH & Co KG, 5 PJSC Lukoil Oil Company, 5 Hapag-Lloyd AG, 4 BP PLC.
3. What are the main segments of the Bunker Fuel Industry?
The market segments include Fuel Type, Vessel Type.
4. Can you provide details about the market size?
The market size is estimated to be USD 198.07 Million as of 2022.
5. What are some drivers contributing to market growth?
4.; Increased LNG Trade Worldwide4.; Increasing Dependecies over Natural Gas for Power Generation.
6. What are the notable trends driving market growth?
LNG as a Bunker Fuel is Likely to Witness Significant Growth.
7. Are there any restraints impacting market growth?
4.; Environmental Concerns and the Strict Regulations Related to Emissions from Maritime Industry.
8. Can you provide examples of recent developments in the market?
In January 2022, Titan LNG secured the tender for the delivery of LNG in the Port of Marseille for Corsica Linea's new Ro-Pax LNG fueled ferry. This partnership indicates the expansion of Titan LNG's operation into the Mediterranean that will enhance the availability of LNG, bioLNG, and in the longer run, hydrogen-derived LNG in the region.
9. What pricing options are available for accessing the report?
Pricing options include single-user, multi-user, and enterprise licenses priced at USD 4750, USD 5250, and USD 8750 respectively.
10. Is the market size provided in terms of value or volume?
The market size is provided in terms of value, measured in Million and volume, measured in metric tonnes.
11. Are there any specific market keywords associated with the report?
Yes, the market keyword associated with the report is "Bunker Fuel Industry," which aids in identifying and referencing the specific market segment covered.
12. How do I determine which pricing option suits my needs best?
The pricing options vary based on user requirements and access needs. Individual users may opt for single-user licenses, while businesses requiring broader access may choose multi-user or enterprise licenses for cost-effective access to the report.
13. Are there any additional resources or data provided in the Bunker Fuel Industry report?
While the report offers comprehensive insights, it's advisable to review the specific contents or supplementary materials provided to ascertain if additional resources or data are available.
14. How can I stay updated on further developments or reports in the Bunker Fuel Industry?
To stay informed about further developments, trends, and reports in the Bunker Fuel Industry, consider subscribing to industry newsletters, following relevant companies and organizations, or regularly checking reputable industry news sources and publications.
Methodology
Step 1 - Identification of Relevant Samples Size from Population Database


Step 2 - Approaches for Defining Global Market Size (Value, Volume* & Price*)

Note*: In applicable scenarios
Step 3 - Data Sources
Primary Research
- Web Analytics
- Survey Reports
- Research Institute
- Latest Research Reports
- Opinion Leaders
Secondary Research
- Annual Reports
- White Paper
- Latest Press Release
- Industry Association
- Paid Database
- Investor Presentations

Step 4 - Data Triangulation
Involves using different sources of information in order to increase the validity of a study
These sources are likely to be stakeholders in a program - participants, other researchers, program staff, other community members, and so on.
Then we put all data in single framework & apply various statistical tools to find out the dynamic on the market.
During the analysis stage, feedback from the stakeholder groups would be compared to determine areas of agreement as well as areas of divergence