

Key Insights
The Activated Carbon Recycling and Reactivation Service market is poised for substantial growth, with an estimated market size of $4.89 billion in 2025. This expansion is driven by a confluence of factors, including increasingly stringent environmental regulations mandating the effective treatment of industrial wastewater and air emissions, as well as a growing awareness of sustainability and the economic benefits of recycling spent activated carbon. Industries such as municipalities, refineries, chemical processing, and environmental remediation are increasingly relying on these services to manage their activated carbon needs efficiently and cost-effectively. The circular economy principles are gaining traction, pushing businesses towards closed-loop systems, further bolstering the demand for reactivation and recycling services. Moreover, the continuous innovation in reactivation technologies, making them more efficient and capable of handling diverse types of spent carbon, also plays a crucial role in market expansion.
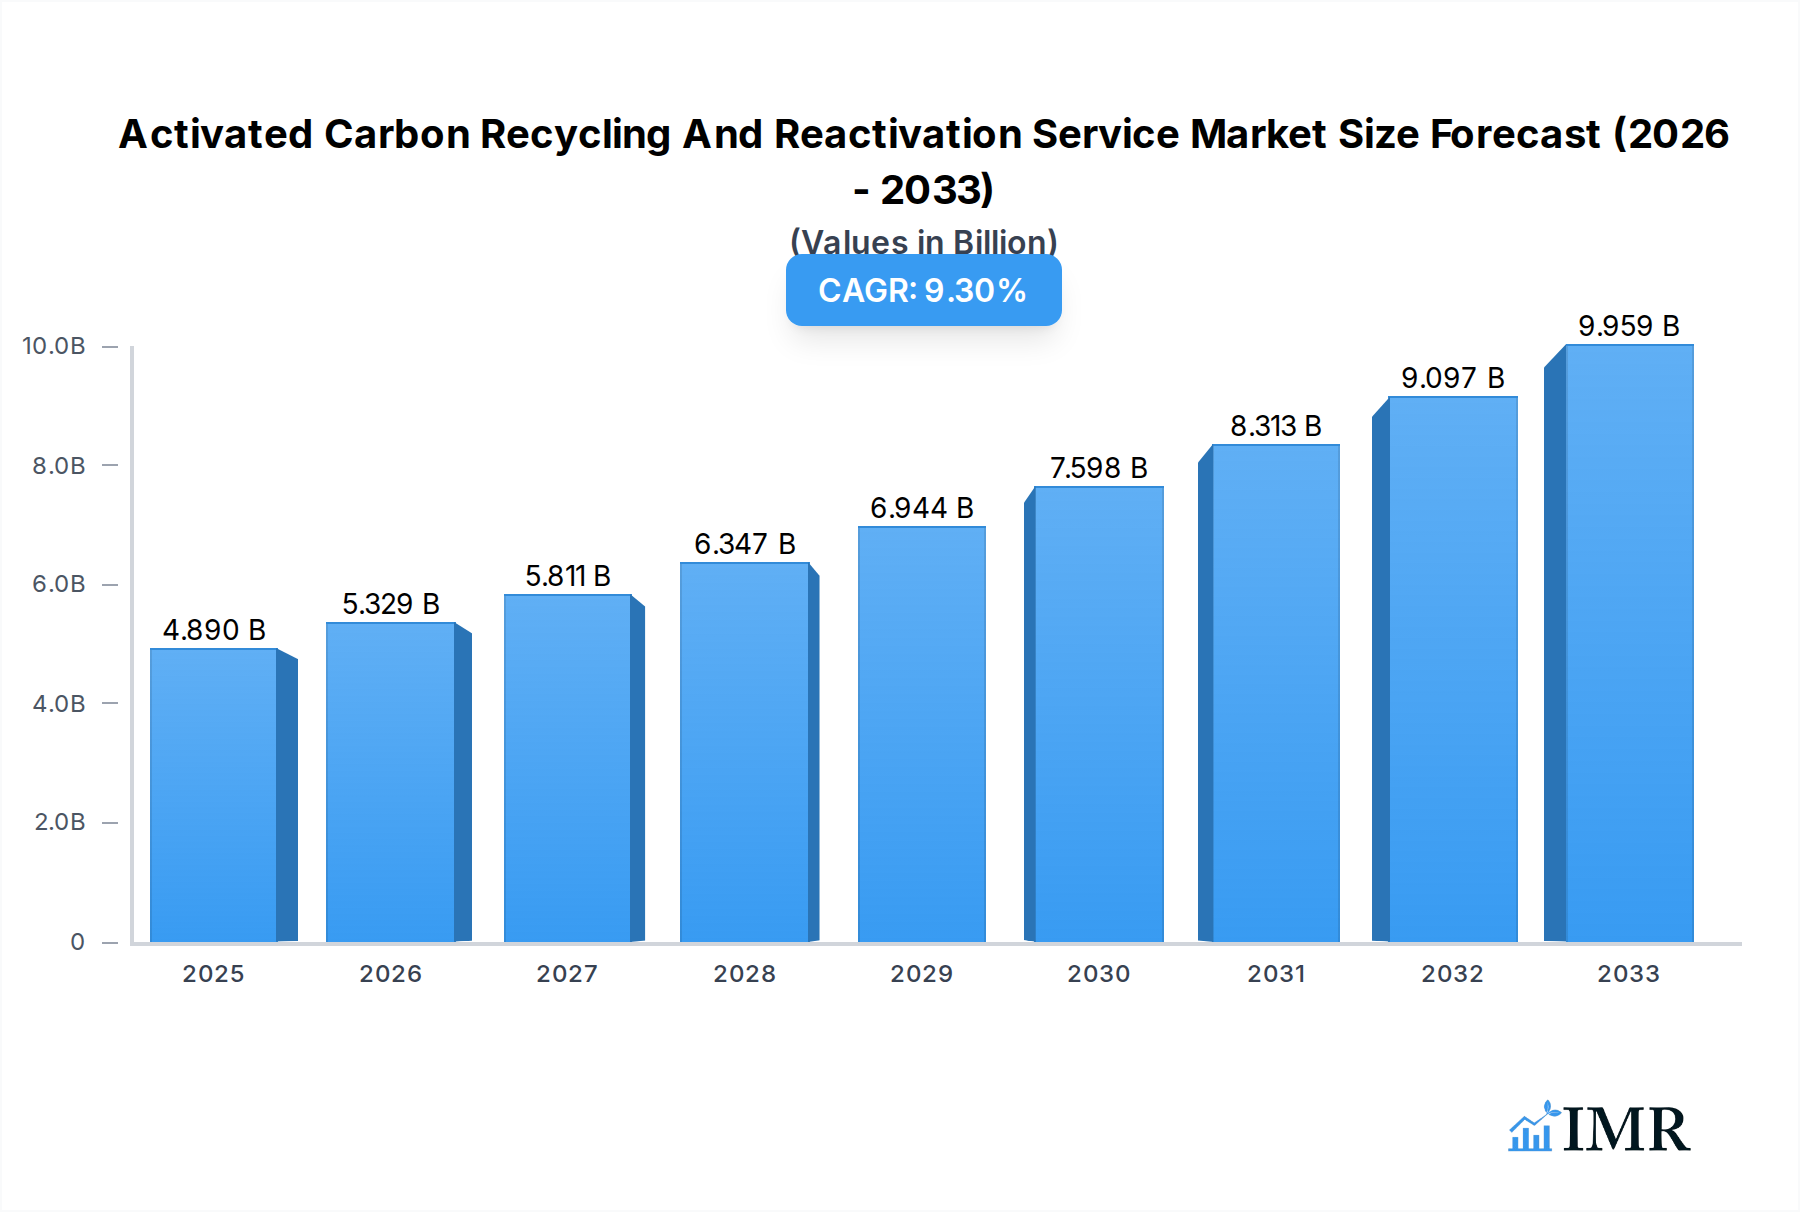
Activated Carbon Recycling And Reactivation Service Market Size (In Billion)
The market is projected to witness a Compound Annual Growth Rate (CAGR) of 9.2% from 2025 to 2033, signifying robust and sustained expansion. This growth trajectory is underpinned by the escalating need to manage complex contaminants and the development of specialized reactivation processes like custom reactivation, which caters to specific industrial requirements. While the market offers significant opportunities, certain restraints such as the initial capital investment for in-house reactivation facilities and the logistics involved in transporting spent carbon can pose challenges for some smaller enterprises. However, the overarching trend towards environmental stewardship and resource optimization is expected to outweigh these restraints. Key players like Cabot Corporation, Evoqua Water Technologies, and Calgon Carbon Corporation (Chemviron) are actively investing in expanding their service offerings and geographical reach to capitalize on this burgeoning market. The Asia Pacific region, driven by rapid industrialization and growing environmental concerns, is anticipated to emerge as a significant growth engine for the activated carbon recycling and reactivation service market.

Activated Carbon Recycling And Reactivation Service Company Market Share
Activated Carbon Recycling and Reactivation Service Market Report: A Comprehensive Analysis (2019–2033)
This in-depth report provides a robust analysis of the global Activated Carbon Recycling and Reactivation Service market, covering the historical period of 2019–2024, the base year of 2025, and a forecast period extending to 2033. The market is segmented by Application (Municipalities, Refineries, Environment, Chemical Processing, Others) and Type (Custom Reactivation, Pool Reactivation, Recycle and Resell). We delve into market dynamics, growth trends, regional dominance, product landscape, key drivers, barriers, challenges, emerging opportunities, growth accelerators, key players, notable milestones, and a comprehensive market outlook, offering actionable insights for industry stakeholders. The report leverages data and analysis to provide a clear understanding of this burgeoning sector, with a projected market size expected to reach xx billion units by 2025 and grow at a significant CAGR through 2033.
Activated Carbon Recycling And Reactivation Service Market Dynamics & Structure
The Activated Carbon Recycling and Reactivation Service market is characterized by a moderate to highly concentrated structure, with established players like Cabot Corporation, Evoqua Water Technologies, and Calgon Carbon Corporation (Chemviron) holding significant market share. Technological innovation is a key driver, focusing on improving reactivation efficiency, reducing energy consumption, and developing methods for handling diverse spent carbon types. Regulatory frameworks, particularly those concerning waste management and environmental protection, are increasingly shaping market demand and operational standards.
- Market Concentration: Dominated by a few key global players, with increasing fragmentation in regional markets.
- Technological Innovation Drivers: Enhanced thermal reactivation processes, superior adsorption capacities for recycled carbon, and sustainable disposal alternatives.
- Regulatory Frameworks: Stringent environmental regulations mandating proper disposal and encouraging circular economy principles for activated carbon.
- Competitive Product Substitutes: While direct substitutes for highly specialized activated carbon applications are limited, alternative filtration and adsorption media exist in broader water and air purification segments.
- End-User Demographics: Strong demand from industrial sectors including refineries, chemical processing plants, and municipalities for effective contaminant removal and compliance.
- M&A Trends: A steady stream of mergers and acquisitions as larger companies seek to consolidate their market presence and expand service offerings, with an estimated xx billion units in M&A deal volumes observed during the historical period.
Activated Carbon Recycling And Reactivation Service Growth Trends & Insights
The global Activated Carbon Recycling and Reactivation Service market is poised for substantial growth, driven by increasing environmental consciousness, stringent regulations on industrial waste, and the economic benefits of reusing activated carbon. The market size is projected to evolve significantly, from xx billion units in the historical period to an estimated xx billion units in 2025, and further to xx billion units by the end of the forecast period in 2033. This growth is fueled by rising adoption rates across various industries seeking sustainable and cost-effective solutions for wastewater treatment, air purification, and process stream purification.
Technological disruptions are playing a crucial role, with advancements in reactivation technologies leading to higher recovery rates and improved performance of reactivated carbon, often rivaling virgin materials. For instance, sophisticated thermal reactivation processes are being refined to minimize energy consumption and environmental impact. The "Recycle and Resell" segment is gaining traction as businesses recognize the economic viability of selling their spent carbon for reactivation and subsequent reuse, contributing to a circular economy model. Consumer behavior shifts are evident, with end-users increasingly prioritizing environmentally responsible service providers and demanding demonstrable sustainability in their supply chains. This proactive approach to resource management, driven by both regulatory pressures and corporate social responsibility, underscores the robust adoption of activated carbon recycling and reactivation services. The market penetration is expected to see a compound annual growth rate (CAGR) of xx% during the forecast period, indicating a strong upward trajectory.
Dominant Regions, Countries, or Segments in Activated Carbon Recycling And Reactivation Service
The Activated Carbon Recycling and Reactivation Service market is experiencing significant growth, with the Environment application segment and the Recycle and Resell type segment emerging as dominant forces. The Environment application is propelled by escalating global concerns regarding pollution, stringent governmental regulations on industrial emissions and wastewater discharge, and the growing adoption of activated carbon for air and water purification across municipalities and industries. Countries within North America and Europe are currently leading this charge due to well-established environmental protection agencies and a strong emphasis on sustainable industrial practices.
- Key Drivers in the Environment Segment:
- Stringent Environmental Regulations: Mandates for contaminant removal in water and air, particularly for PFAS, heavy metals, and volatile organic compounds (VOCs).
- Growing Awareness of Circular Economy: Emphasis on reducing waste and promoting the reuse of materials.
- Industrial Growth: Expansion of manufacturing, chemical processing, and refining sectors, all of which generate significant wastewater and air emissions requiring treatment.
- Municipal Water and Wastewater Treatment: Increasing demand for advanced purification solutions to meet growing population needs and stricter water quality standards.
In terms of market type, Recycle and Resell is demonstrating remarkable growth. This is driven by the economic incentive for businesses to recover value from spent activated carbon and reduce their operational costs. The Recycle and Resell model not only offers a cost-effective alternative to purchasing virgin activated carbon but also aligns with sustainability goals. This segment's dominance is further amplified by the increasing availability of efficient reactivation technologies that can restore the adsorptive capacity of spent carbon to near-virgin levels.
- Dominance Factors for Recycle and Resell:
- Cost Savings: Significant reduction in expenditure compared to purchasing new activated carbon.
- Sustainability Benefits: Promotes a circular economy, reducing landfill waste and the carbon footprint associated with virgin material production.
- Availability of Specialized Reactivation Facilities: Growing network of facilities capable of handling diverse spent carbon types.
- Growing Supplier Network: An increasing number of companies are offering comprehensive buy-back and reactivation programs.
The market share of the Environment segment within the broader application categories is estimated to be around xx%, and the Recycle and Resell type is capturing approximately xx% of the reactivation service market. The growth potential in these segments remains exceptionally high, driven by continuous innovation, evolving regulatory landscapes, and a global push towards sustainable resource management.
Activated Carbon Recycling And Reactivation Service Product Landscape
The product landscape within Activated Carbon Recycling and Reactivation Services is evolving rapidly, focusing on enhanced performance and sustainability. Innovations are centered on optimizing reactivation processes to achieve higher adsorption capacities in reactivated carbons, often comparable to virgin materials. This includes advanced thermal regeneration techniques that minimize energy consumption and environmental impact. Furthermore, specialized reactivation services are emerging for complex spent carbons from niche industrial applications, ensuring tailored solutions for diverse contaminant profiles. The unique selling propositions revolve around cost-effectiveness, environmental compliance, and the ability to provide a circular economy solution for activated carbon, thereby reducing waste and resource depletion.
Key Drivers, Barriers & Challenges in Activated Carbon Recycling And Reactivation Service
Key Drivers:
- Environmental Regulations: Increasingly stringent global mandates on wastewater discharge and air emissions are a primary catalyst, compelling industries to adopt effective and compliant treatment solutions.
- Economic Incentives: The cost-effectiveness of reactivated carbon, offering significant savings compared to virgin materials, drives adoption across budget-conscious industries.
- Circular Economy Initiatives: Growing global emphasis on sustainability and waste reduction promotes the reuse of activated carbon, aligning with corporate social responsibility goals.
- Technological Advancements: Innovations in reactivation processes improve efficiency, reduce energy consumption, and enhance the performance of reactivated carbon.
Barriers & Challenges:
- Logistics and Transportation Costs: The cost and complexity of transporting spent activated carbon to reactivation facilities can be a significant barrier, especially for geographically dispersed operations.
- Contaminant Variability: The diverse nature of contaminants in spent carbon can complicate reactivation processes, requiring specialized treatments and potentially reducing reactivation efficiency for certain waste streams.
- Perception of Quality: Some end-users may harbor a perception that reactivated carbon is inferior to virgin material, despite advancements that have closed the performance gap.
- Regulatory Hurdles for Transport and Disposal: Navigating varying regulations for the transport and disposal of spent activated carbon across different regions can be challenging.
- Supply Chain Disruptions: Global supply chain issues can impact the availability of specialized reactivation equipment and consumables.
Emerging Opportunities in Activated Carbon Recycling And Reactivation Service
Emerging opportunities in the Activated Carbon Recycling and Reactivation Service sector are primarily driven by the growing demand for solutions tackling emerging contaminants and the expansion of its application into novel areas. The increasing focus on treating persistent organic pollutants (POPs) like PFAS (per- and polyfluoroalkyl substances) presents a significant growth avenue, as activated carbon is a key technology for their removal. Furthermore, the burgeoning biotechnology and pharmaceutical industries are recognizing the value of activated carbon for purification processes, creating new markets for specialized reactivation services. The development of mobile or localized reactivation units could also address logistical challenges and cater to industries with smaller, distributed operations.
Growth Accelerators in the Activated Carbon Recycling And Reactivation Service Industry
Several key factors are accelerating growth in the Activated Carbon Recycling and Reactivation Service industry. Technological breakthroughs in reactivation, such as advanced microwave and supercritical fluid technologies, are enhancing efficiency and reducing energy requirements, making the process more economically attractive and environmentally sound. Strategic partnerships between activated carbon manufacturers, service providers, and end-user industries are fostering greater collaboration and creating integrated solutions, streamlining the entire lifecycle of activated carbon. Market expansion into developing economies, where environmental regulations are tightening and industrialization is accelerating, offers substantial untapped potential. The increasing awareness and demand for sustainable supply chains further bolster this growth, pushing companies to adopt circular economy principles.
Key Players Shaping the Activated Carbon Recycling And Reactivation Service Market
- Cabot Corporation
- Evoqua Water Technologies
- Calgon Carbon Corporation (Chemviron)
- Desotec
- BATREC Industrie AG
- Donau Carbon GmbH
- CPL Industries
- JACOBI CARBONS GROUP
- Carbon Activated Corporation
- Xingyuan Industry Group
Notable Milestones in Activated Carbon Recycling And Reactivation Service Sector
- 2019: Increased investment in advanced thermal reactivation technologies by leading players to improve energy efficiency.
- 2020: Growing adoption of "Recycle and Resell" models by industrial clients seeking cost-effective sustainability solutions.
- 2021: Introduction of specialized reactivation services for emerging contaminants like PFAS.
- 2022: Expansion of reactivation capacity by key players to meet rising global demand.
- 2023: Increased M&A activity, with consolidation of smaller reactivation service providers by larger corporations.
- 2024: Enhanced regulatory frameworks in various regions mandating or incentivizing activated carbon recycling and reactivation.
In-Depth Activated Carbon Recycling And Reactivation Service Market Outlook
The future outlook for the Activated Carbon Recycling and Reactivation Service market is exceptionally promising, driven by an unwavering commitment to environmental sustainability and economic efficiency. Growth accelerators such as advancements in reactivation technology, strategic industry collaborations, and expansion into emerging economies will continue to propel market expansion. The increasing regulatory pressure to manage waste responsibly and the growing adoption of circular economy principles are fundamental drivers that will ensure sustained demand. Stakeholders can expect to see further innovation in tailored reactivation solutions for complex waste streams and a broader integration of these services into industrial operational frameworks, signifying a robust and expanding market.
Activated Carbon Recycling And Reactivation Service Segmentation
-
1. Application
- 1.1. Municipalities
- 1.2. Refineries
- 1.3. Environment
- 1.4. Chemical Processing
- 1.5. Others
-
2. Type
- 2.1. Custom Reactivation
- 2.2. Pool Reactivation
- 2.3. Recyle and Resell
Activated Carbon Recycling And Reactivation Service Segmentation By Geography
-
1. North America
- 1.1. United States
- 1.2. Canada
- 1.3. Mexico
-
2. South America
- 2.1. Brazil
- 2.2. Argentina
- 2.3. Rest of South America
-
3. Europe
- 3.1. United Kingdom
- 3.2. Germany
- 3.3. France
- 3.4. Italy
- 3.5. Spain
- 3.6. Russia
- 3.7. Benelux
- 3.8. Nordics
- 3.9. Rest of Europe
-
4. Middle East & Africa
- 4.1. Turkey
- 4.2. Israel
- 4.3. GCC
- 4.4. North Africa
- 4.5. South Africa
- 4.6. Rest of Middle East & Africa
-
5. Asia Pacific
- 5.1. China
- 5.2. India
- 5.3. Japan
- 5.4. South Korea
- 5.5. ASEAN
- 5.6. Oceania
- 5.7. Rest of Asia Pacific
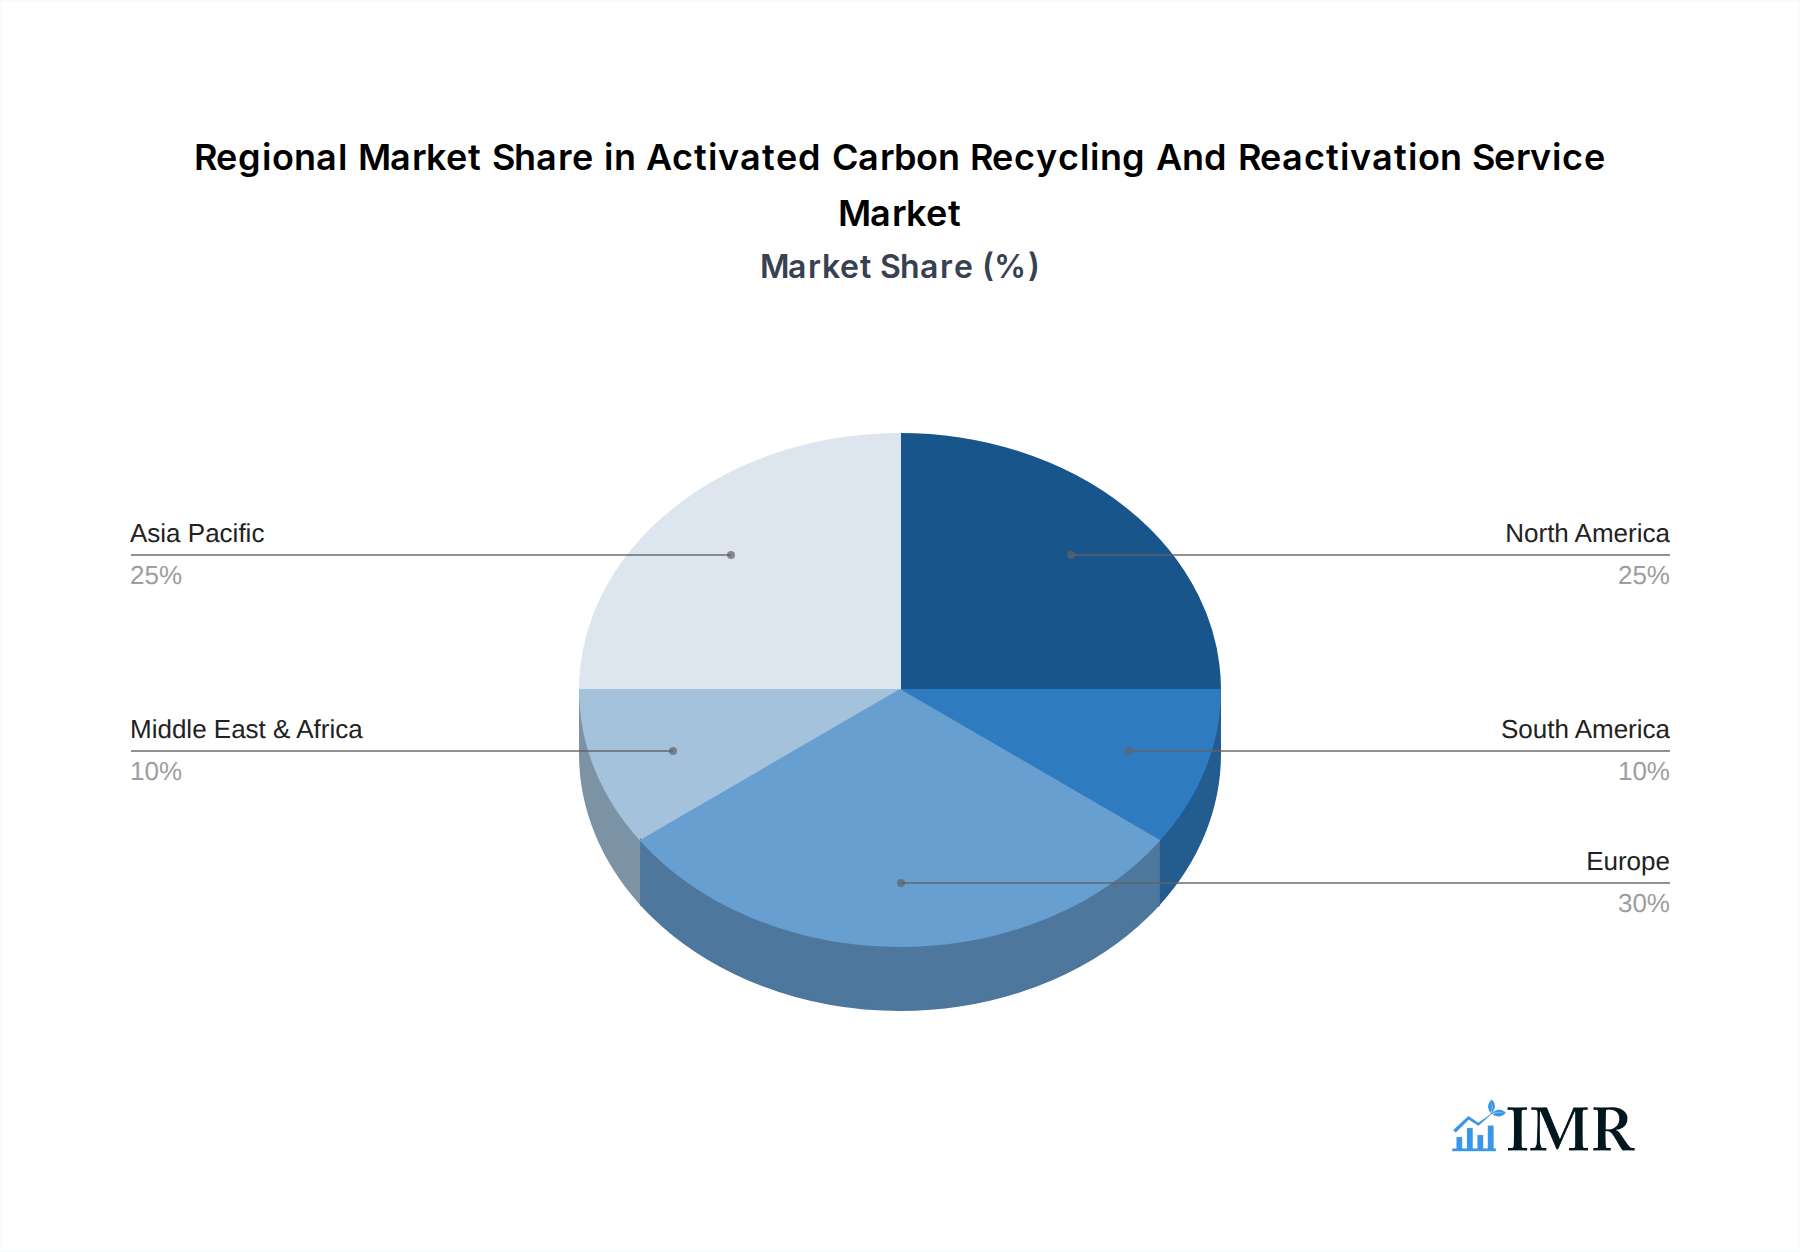
Activated Carbon Recycling And Reactivation Service Regional Market Share
Geographic Coverage of Activated Carbon Recycling And Reactivation Service
Activated Carbon Recycling And Reactivation Service REPORT HIGHLIGHTS
| Aspects | Details |
|---|---|
| Study Period | 2020-2034 |
| Base Year | 2025 |
| Estimated Year | 2026 |
| Forecast Period | 2026-2034 |
| Historical Period | 2020-2025 |
| Growth Rate | CAGR of 9.2% from 2020-2034 |
| Segmentation |
|
Table of Contents
- 1. Introduction
- 1.1. Research Scope
- 1.2. Market Segmentation
- 1.3. Research Methodology
- 1.4. Definitions and Assumptions
- 2. Executive Summary
- 2.1. Introduction
- 3. Market Dynamics
- 3.1. Introduction
- 3.2. Market Drivers
- 3.3. Market Restrains
- 3.4. Market Trends
- 4. Market Factor Analysis
- 4.1. Porters Five Forces
- 4.2. Supply/Value Chain
- 4.3. PESTEL analysis
- 4.4. Market Entropy
- 4.5. Patent/Trademark Analysis
- 5. Global Activated Carbon Recycling And Reactivation Service Analysis, Insights and Forecast, 2020-2032
- 5.1. Market Analysis, Insights and Forecast - by Application
- 5.1.1. Municipalities
- 5.1.2. Refineries
- 5.1.3. Environment
- 5.1.4. Chemical Processing
- 5.1.5. Others
- 5.2. Market Analysis, Insights and Forecast - by Type
- 5.2.1. Custom Reactivation
- 5.2.2. Pool Reactivation
- 5.2.3. Recyle and Resell
- 5.3. Market Analysis, Insights and Forecast - by Region
- 5.3.1. North America
- 5.3.2. South America
- 5.3.3. Europe
- 5.3.4. Middle East & Africa
- 5.3.5. Asia Pacific
- 5.1. Market Analysis, Insights and Forecast - by Application
- 6. North America Activated Carbon Recycling And Reactivation Service Analysis, Insights and Forecast, 2020-2032
- 6.1. Market Analysis, Insights and Forecast - by Application
- 6.1.1. Municipalities
- 6.1.2. Refineries
- 6.1.3. Environment
- 6.1.4. Chemical Processing
- 6.1.5. Others
- 6.2. Market Analysis, Insights and Forecast - by Type
- 6.2.1. Custom Reactivation
- 6.2.2. Pool Reactivation
- 6.2.3. Recyle and Resell
- 6.1. Market Analysis, Insights and Forecast - by Application
- 7. South America Activated Carbon Recycling And Reactivation Service Analysis, Insights and Forecast, 2020-2032
- 7.1. Market Analysis, Insights and Forecast - by Application
- 7.1.1. Municipalities
- 7.1.2. Refineries
- 7.1.3. Environment
- 7.1.4. Chemical Processing
- 7.1.5. Others
- 7.2. Market Analysis, Insights and Forecast - by Type
- 7.2.1. Custom Reactivation
- 7.2.2. Pool Reactivation
- 7.2.3. Recyle and Resell
- 7.1. Market Analysis, Insights and Forecast - by Application
- 8. Europe Activated Carbon Recycling And Reactivation Service Analysis, Insights and Forecast, 2020-2032
- 8.1. Market Analysis, Insights and Forecast - by Application
- 8.1.1. Municipalities
- 8.1.2. Refineries
- 8.1.3. Environment
- 8.1.4. Chemical Processing
- 8.1.5. Others
- 8.2. Market Analysis, Insights and Forecast - by Type
- 8.2.1. Custom Reactivation
- 8.2.2. Pool Reactivation
- 8.2.3. Recyle and Resell
- 8.1. Market Analysis, Insights and Forecast - by Application
- 9. Middle East & Africa Activated Carbon Recycling And Reactivation Service Analysis, Insights and Forecast, 2020-2032
- 9.1. Market Analysis, Insights and Forecast - by Application
- 9.1.1. Municipalities
- 9.1.2. Refineries
- 9.1.3. Environment
- 9.1.4. Chemical Processing
- 9.1.5. Others
- 9.2. Market Analysis, Insights and Forecast - by Type
- 9.2.1. Custom Reactivation
- 9.2.2. Pool Reactivation
- 9.2.3. Recyle and Resell
- 9.1. Market Analysis, Insights and Forecast - by Application
- 10. Asia Pacific Activated Carbon Recycling And Reactivation Service Analysis, Insights and Forecast, 2020-2032
- 10.1. Market Analysis, Insights and Forecast - by Application
- 10.1.1. Municipalities
- 10.1.2. Refineries
- 10.1.3. Environment
- 10.1.4. Chemical Processing
- 10.1.5. Others
- 10.2. Market Analysis, Insights and Forecast - by Type
- 10.2.1. Custom Reactivation
- 10.2.2. Pool Reactivation
- 10.2.3. Recyle and Resell
- 10.1. Market Analysis, Insights and Forecast - by Application
- 11. Competitive Analysis
- 11.1. Global Market Share Analysis 2025
- 11.2. Company Profiles
- 11.2.1 Cabot Corporation
- 11.2.1.1. Overview
- 11.2.1.2. Products
- 11.2.1.3. SWOT Analysis
- 11.2.1.4. Recent Developments
- 11.2.1.5. Financials (Based on Availability)
- 11.2.2 Evoqua Water Technologies
- 11.2.2.1. Overview
- 11.2.2.2. Products
- 11.2.2.3. SWOT Analysis
- 11.2.2.4. Recent Developments
- 11.2.2.5. Financials (Based on Availability)
- 11.2.3 Calgon Carbon Corporation(Chemviron)
- 11.2.3.1. Overview
- 11.2.3.2. Products
- 11.2.3.3. SWOT Analysis
- 11.2.3.4. Recent Developments
- 11.2.3.5. Financials (Based on Availability)
- 11.2.4 Desotec
- 11.2.4.1. Overview
- 11.2.4.2. Products
- 11.2.4.3. SWOT Analysis
- 11.2.4.4. Recent Developments
- 11.2.4.5. Financials (Based on Availability)
- 11.2.5 BATREC Industrie AG
- 11.2.5.1. Overview
- 11.2.5.2. Products
- 11.2.5.3. SWOT Analysis
- 11.2.5.4. Recent Developments
- 11.2.5.5. Financials (Based on Availability)
- 11.2.6 Donau Carbon GmbH
- 11.2.6.1. Overview
- 11.2.6.2. Products
- 11.2.6.3. SWOT Analysis
- 11.2.6.4. Recent Developments
- 11.2.6.5. Financials (Based on Availability)
- 11.2.7 CPL Industries
- 11.2.7.1. Overview
- 11.2.7.2. Products
- 11.2.7.3. SWOT Analysis
- 11.2.7.4. Recent Developments
- 11.2.7.5. Financials (Based on Availability)
- 11.2.8 JACOBI CARBONS GROUP
- 11.2.8.1. Overview
- 11.2.8.2. Products
- 11.2.8.3. SWOT Analysis
- 11.2.8.4. Recent Developments
- 11.2.8.5. Financials (Based on Availability)
- 11.2.9 Carbon Activated Corporation
- 11.2.9.1. Overview
- 11.2.9.2. Products
- 11.2.9.3. SWOT Analysis
- 11.2.9.4. Recent Developments
- 11.2.9.5. Financials (Based on Availability)
- 11.2.10 Xingyuan Industry Group
- 11.2.10.1. Overview
- 11.2.10.2. Products
- 11.2.10.3. SWOT Analysis
- 11.2.10.4. Recent Developments
- 11.2.10.5. Financials (Based on Availability)
- 11.2.1 Cabot Corporation
List of Figures
- Figure 1: Global Activated Carbon Recycling And Reactivation Service Revenue Breakdown (undefined, %) by Region 2025 & 2033
- Figure 2: North America Activated Carbon Recycling And Reactivation Service Revenue (undefined), by Application 2025 & 2033
- Figure 3: North America Activated Carbon Recycling And Reactivation Service Revenue Share (%), by Application 2025 & 2033
- Figure 4: North America Activated Carbon Recycling And Reactivation Service Revenue (undefined), by Type 2025 & 2033
- Figure 5: North America Activated Carbon Recycling And Reactivation Service Revenue Share (%), by Type 2025 & 2033
- Figure 6: North America Activated Carbon Recycling And Reactivation Service Revenue (undefined), by Country 2025 & 2033
- Figure 7: North America Activated Carbon Recycling And Reactivation Service Revenue Share (%), by Country 2025 & 2033
- Figure 8: South America Activated Carbon Recycling And Reactivation Service Revenue (undefined), by Application 2025 & 2033
- Figure 9: South America Activated Carbon Recycling And Reactivation Service Revenue Share (%), by Application 2025 & 2033
- Figure 10: South America Activated Carbon Recycling And Reactivation Service Revenue (undefined), by Type 2025 & 2033
- Figure 11: South America Activated Carbon Recycling And Reactivation Service Revenue Share (%), by Type 2025 & 2033
- Figure 12: South America Activated Carbon Recycling And Reactivation Service Revenue (undefined), by Country 2025 & 2033
- Figure 13: South America Activated Carbon Recycling And Reactivation Service Revenue Share (%), by Country 2025 & 2033
- Figure 14: Europe Activated Carbon Recycling And Reactivation Service Revenue (undefined), by Application 2025 & 2033
- Figure 15: Europe Activated Carbon Recycling And Reactivation Service Revenue Share (%), by Application 2025 & 2033
- Figure 16: Europe Activated Carbon Recycling And Reactivation Service Revenue (undefined), by Type 2025 & 2033
- Figure 17: Europe Activated Carbon Recycling And Reactivation Service Revenue Share (%), by Type 2025 & 2033
- Figure 18: Europe Activated Carbon Recycling And Reactivation Service Revenue (undefined), by Country 2025 & 2033
- Figure 19: Europe Activated Carbon Recycling And Reactivation Service Revenue Share (%), by Country 2025 & 2033
- Figure 20: Middle East & Africa Activated Carbon Recycling And Reactivation Service Revenue (undefined), by Application 2025 & 2033
- Figure 21: Middle East & Africa Activated Carbon Recycling And Reactivation Service Revenue Share (%), by Application 2025 & 2033
- Figure 22: Middle East & Africa Activated Carbon Recycling And Reactivation Service Revenue (undefined), by Type 2025 & 2033
- Figure 23: Middle East & Africa Activated Carbon Recycling And Reactivation Service Revenue Share (%), by Type 2025 & 2033
- Figure 24: Middle East & Africa Activated Carbon Recycling And Reactivation Service Revenue (undefined), by Country 2025 & 2033
- Figure 25: Middle East & Africa Activated Carbon Recycling And Reactivation Service Revenue Share (%), by Country 2025 & 2033
- Figure 26: Asia Pacific Activated Carbon Recycling And Reactivation Service Revenue (undefined), by Application 2025 & 2033
- Figure 27: Asia Pacific Activated Carbon Recycling And Reactivation Service Revenue Share (%), by Application 2025 & 2033
- Figure 28: Asia Pacific Activated Carbon Recycling And Reactivation Service Revenue (undefined), by Type 2025 & 2033
- Figure 29: Asia Pacific Activated Carbon Recycling And Reactivation Service Revenue Share (%), by Type 2025 & 2033
- Figure 30: Asia Pacific Activated Carbon Recycling And Reactivation Service Revenue (undefined), by Country 2025 & 2033
- Figure 31: Asia Pacific Activated Carbon Recycling And Reactivation Service Revenue Share (%), by Country 2025 & 2033
List of Tables
- Table 1: Global Activated Carbon Recycling And Reactivation Service Revenue undefined Forecast, by Application 2020 & 2033
- Table 2: Global Activated Carbon Recycling And Reactivation Service Revenue undefined Forecast, by Type 2020 & 2033
- Table 3: Global Activated Carbon Recycling And Reactivation Service Revenue undefined Forecast, by Region 2020 & 2033
- Table 4: Global Activated Carbon Recycling And Reactivation Service Revenue undefined Forecast, by Application 2020 & 2033
- Table 5: Global Activated Carbon Recycling And Reactivation Service Revenue undefined Forecast, by Type 2020 & 2033
- Table 6: Global Activated Carbon Recycling And Reactivation Service Revenue undefined Forecast, by Country 2020 & 2033
- Table 7: United States Activated Carbon Recycling And Reactivation Service Revenue (undefined) Forecast, by Application 2020 & 2033
- Table 8: Canada Activated Carbon Recycling And Reactivation Service Revenue (undefined) Forecast, by Application 2020 & 2033
- Table 9: Mexico Activated Carbon Recycling And Reactivation Service Revenue (undefined) Forecast, by Application 2020 & 2033
- Table 10: Global Activated Carbon Recycling And Reactivation Service Revenue undefined Forecast, by Application 2020 & 2033
- Table 11: Global Activated Carbon Recycling And Reactivation Service Revenue undefined Forecast, by Type 2020 & 2033
- Table 12: Global Activated Carbon Recycling And Reactivation Service Revenue undefined Forecast, by Country 2020 & 2033
- Table 13: Brazil Activated Carbon Recycling And Reactivation Service Revenue (undefined) Forecast, by Application 2020 & 2033
- Table 14: Argentina Activated Carbon Recycling And Reactivation Service Revenue (undefined) Forecast, by Application 2020 & 2033
- Table 15: Rest of South America Activated Carbon Recycling And Reactivation Service Revenue (undefined) Forecast, by Application 2020 & 2033
- Table 16: Global Activated Carbon Recycling And Reactivation Service Revenue undefined Forecast, by Application 2020 & 2033
- Table 17: Global Activated Carbon Recycling And Reactivation Service Revenue undefined Forecast, by Type 2020 & 2033
- Table 18: Global Activated Carbon Recycling And Reactivation Service Revenue undefined Forecast, by Country 2020 & 2033
- Table 19: United Kingdom Activated Carbon Recycling And Reactivation Service Revenue (undefined) Forecast, by Application 2020 & 2033
- Table 20: Germany Activated Carbon Recycling And Reactivation Service Revenue (undefined) Forecast, by Application 2020 & 2033
- Table 21: France Activated Carbon Recycling And Reactivation Service Revenue (undefined) Forecast, by Application 2020 & 2033
- Table 22: Italy Activated Carbon Recycling And Reactivation Service Revenue (undefined) Forecast, by Application 2020 & 2033
- Table 23: Spain Activated Carbon Recycling And Reactivation Service Revenue (undefined) Forecast, by Application 2020 & 2033
- Table 24: Russia Activated Carbon Recycling And Reactivation Service Revenue (undefined) Forecast, by Application 2020 & 2033
- Table 25: Benelux Activated Carbon Recycling And Reactivation Service Revenue (undefined) Forecast, by Application 2020 & 2033
- Table 26: Nordics Activated Carbon Recycling And Reactivation Service Revenue (undefined) Forecast, by Application 2020 & 2033
- Table 27: Rest of Europe Activated Carbon Recycling And Reactivation Service Revenue (undefined) Forecast, by Application 2020 & 2033
- Table 28: Global Activated Carbon Recycling And Reactivation Service Revenue undefined Forecast, by Application 2020 & 2033
- Table 29: Global Activated Carbon Recycling And Reactivation Service Revenue undefined Forecast, by Type 2020 & 2033
- Table 30: Global Activated Carbon Recycling And Reactivation Service Revenue undefined Forecast, by Country 2020 & 2033
- Table 31: Turkey Activated Carbon Recycling And Reactivation Service Revenue (undefined) Forecast, by Application 2020 & 2033
- Table 32: Israel Activated Carbon Recycling And Reactivation Service Revenue (undefined) Forecast, by Application 2020 & 2033
- Table 33: GCC Activated Carbon Recycling And Reactivation Service Revenue (undefined) Forecast, by Application 2020 & 2033
- Table 34: North Africa Activated Carbon Recycling And Reactivation Service Revenue (undefined) Forecast, by Application 2020 & 2033
- Table 35: South Africa Activated Carbon Recycling And Reactivation Service Revenue (undefined) Forecast, by Application 2020 & 2033
- Table 36: Rest of Middle East & Africa Activated Carbon Recycling And Reactivation Service Revenue (undefined) Forecast, by Application 2020 & 2033
- Table 37: Global Activated Carbon Recycling And Reactivation Service Revenue undefined Forecast, by Application 2020 & 2033
- Table 38: Global Activated Carbon Recycling And Reactivation Service Revenue undefined Forecast, by Type 2020 & 2033
- Table 39: Global Activated Carbon Recycling And Reactivation Service Revenue undefined Forecast, by Country 2020 & 2033
- Table 40: China Activated Carbon Recycling And Reactivation Service Revenue (undefined) Forecast, by Application 2020 & 2033
- Table 41: India Activated Carbon Recycling And Reactivation Service Revenue (undefined) Forecast, by Application 2020 & 2033
- Table 42: Japan Activated Carbon Recycling And Reactivation Service Revenue (undefined) Forecast, by Application 2020 & 2033
- Table 43: South Korea Activated Carbon Recycling And Reactivation Service Revenue (undefined) Forecast, by Application 2020 & 2033
- Table 44: ASEAN Activated Carbon Recycling And Reactivation Service Revenue (undefined) Forecast, by Application 2020 & 2033
- Table 45: Oceania Activated Carbon Recycling And Reactivation Service Revenue (undefined) Forecast, by Application 2020 & 2033
- Table 46: Rest of Asia Pacific Activated Carbon Recycling And Reactivation Service Revenue (undefined) Forecast, by Application 2020 & 2033
Frequently Asked Questions
1. What is the projected Compound Annual Growth Rate (CAGR) of the Activated Carbon Recycling And Reactivation Service?
The projected CAGR is approximately 9.2%.
2. Which companies are prominent players in the Activated Carbon Recycling And Reactivation Service?
Key companies in the market include Cabot Corporation, Evoqua Water Technologies, Calgon Carbon Corporation(Chemviron), Desotec, BATREC Industrie AG, Donau Carbon GmbH, CPL Industries, JACOBI CARBONS GROUP, Carbon Activated Corporation, Xingyuan Industry Group.
3. What are the main segments of the Activated Carbon Recycling And Reactivation Service?
The market segments include Application, Type.
4. Can you provide details about the market size?
The market size is estimated to be USD XXX N/A as of 2022.
5. What are some drivers contributing to market growth?
N/A
6. What are the notable trends driving market growth?
N/A
7. Are there any restraints impacting market growth?
N/A
8. Can you provide examples of recent developments in the market?
N/A
9. What pricing options are available for accessing the report?
Pricing options include single-user, multi-user, and enterprise licenses priced at USD 2900.00, USD 4350.00, and USD 5800.00 respectively.
10. Is the market size provided in terms of value or volume?
The market size is provided in terms of value, measured in N/A.
11. Are there any specific market keywords associated with the report?
Yes, the market keyword associated with the report is "Activated Carbon Recycling And Reactivation Service," which aids in identifying and referencing the specific market segment covered.
12. How do I determine which pricing option suits my needs best?
The pricing options vary based on user requirements and access needs. Individual users may opt for single-user licenses, while businesses requiring broader access may choose multi-user or enterprise licenses for cost-effective access to the report.
13. Are there any additional resources or data provided in the Activated Carbon Recycling And Reactivation Service report?
While the report offers comprehensive insights, it's advisable to review the specific contents or supplementary materials provided to ascertain if additional resources or data are available.
14. How can I stay updated on further developments or reports in the Activated Carbon Recycling And Reactivation Service?
To stay informed about further developments, trends, and reports in the Activated Carbon Recycling And Reactivation Service, consider subscribing to industry newsletters, following relevant companies and organizations, or regularly checking reputable industry news sources and publications.
Methodology
Step 1 - Identification of Relevant Samples Size from Population Database


Step 2 - Approaches for Defining Global Market Size (Value, Volume* & Price*)

Note*: In applicable scenarios
Step 3 - Data Sources
Primary Research
- Web Analytics
- Survey Reports
- Research Institute
- Latest Research Reports
- Opinion Leaders
Secondary Research
- Annual Reports
- White Paper
- Latest Press Release
- Industry Association
- Paid Database
- Investor Presentations

Step 4 - Data Triangulation
Involves using different sources of information in order to increase the validity of a study
These sources are likely to be stakeholders in a program - participants, other researchers, program staff, other community members, and so on.
Then we put all data in single framework & apply various statistical tools to find out the dynamic on the market.
During the analysis stage, feedback from the stakeholder groups would be compared to determine areas of agreement as well as areas of divergence