

Key Insights
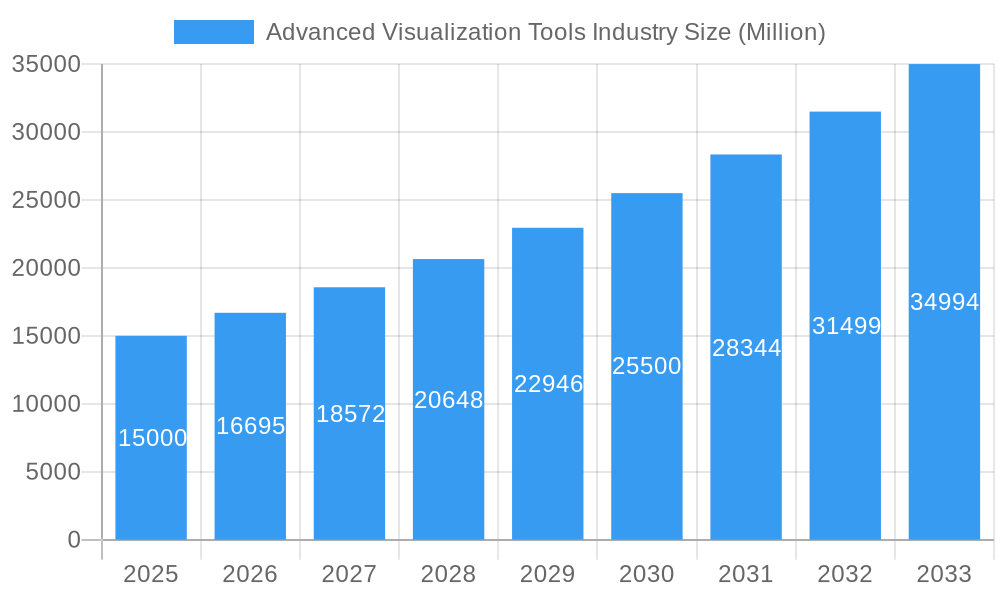
The Advanced Visualization Tools market is projected for substantial growth, expected to reach approximately 4.14 billion by 2033, driven by a CAGR of 13.8% from the 2025 base year. This expansion is primarily attributed to the increasing incidence of chronic diseases requiring advanced diagnostic imaging and significant technological advancements in MRI, CT, ultrasound, and nuclear medicine. The integration of AI and machine learning in medical image analysis further enhances diagnostic accuracy and efficiency, stimulating market demand. Growth is particularly robust within the enterprise segment, reflecting a growing preference for integrated solutions in large healthcare systems. Key clinical applications such as oncology, orthopedics, and cardiology demonstrate above-average growth due to the demand for precise visualization in complex procedures and treatment planning. While data privacy concerns and high initial investment costs pose challenges, the market outlook remains highly positive, with significant expansion potential in both developed and emerging economies. The competitive landscape features established players like Siemens, GE Healthcare, and Philips, alongside agile companies focusing on niche applications.
Advanced Visualization Tools Industry Market Size (In Billion)
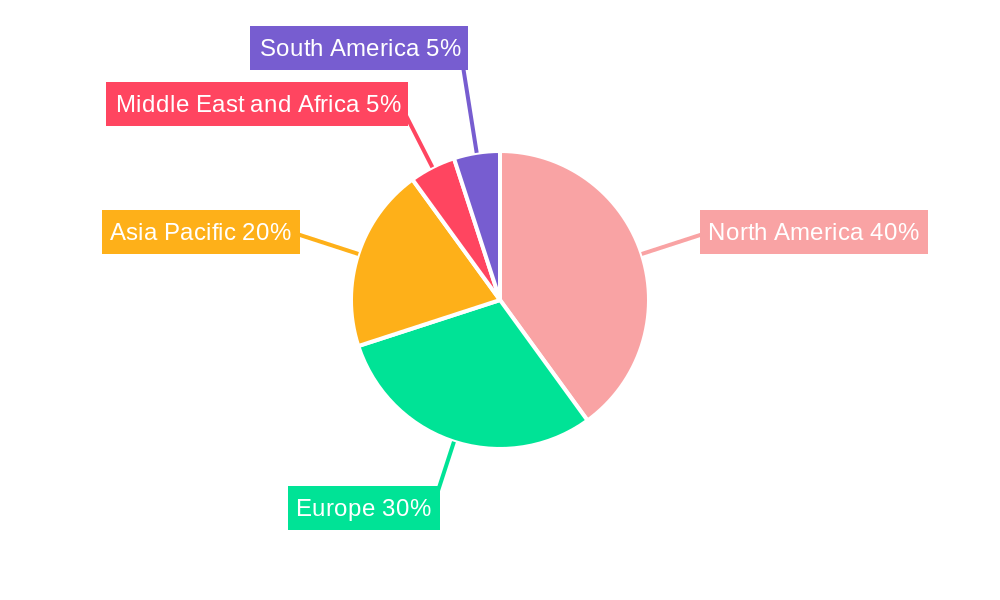
Geographical market share distribution is anticipated to be significantly influenced by healthcare infrastructure development and investment. North America and Europe are expected to retain substantial market share owing to their advanced healthcare systems and high technology adoption rates. However, the Asia-Pacific region is poised for considerable growth, propelled by rising disposable incomes, improving healthcare infrastructure, and increasing awareness of advanced diagnostic techniques. Market segmentation by imaging modality, clinical application, product/service type, and solution type offers valuable strategic insights, enabling companies to target high-growth segments. Continuous innovation in 3D/4D visualization, cloud-based solutions, and integration with medical informatics systems will be critical for success in this dynamic market.
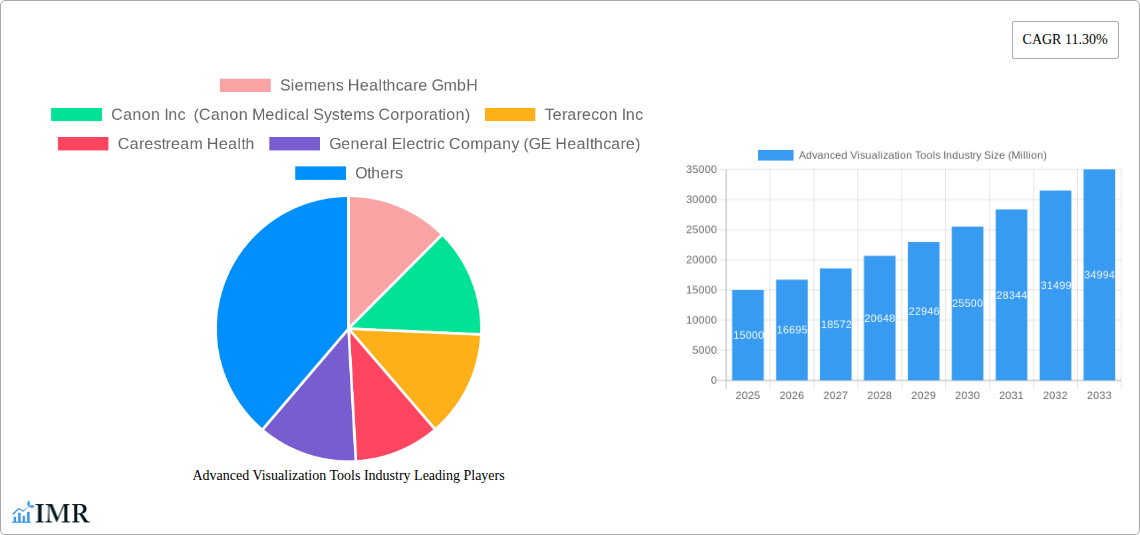
Advanced Visualization Tools Industry Company Market Share
This comprehensive report offers an in-depth analysis of the Advanced Visualization Tools industry, covering market dynamics, growth trends, regional influence, product landscape, challenges, opportunities, and key market participants. The analysis spans from 2019 to 2033, with a specific focus on the forecast period of 2025-2033 and a base year of 2025. The estimated total market size for 2025 is 4.14 billion. This detailed study is designed for industry professionals, investors, and strategists seeking a thorough understanding of this rapidly evolving sector. Parent markets include Medical Imaging Equipment and Healthcare IT, with child markets encompassing specific imaging modalities (e.g., MRI, CT, Ultrasound) and clinical applications.
Advanced Visualization Tools Industry Market Dynamics & Structure
The Advanced Visualization Tools market is characterized by a moderately concentrated structure with a few major players holding significant market share. The market is driven by technological innovation, particularly in AI-powered image analysis and cloud-based solutions. Stringent regulatory frameworks, particularly concerning data privacy and medical device approvals, influence market growth. Competitive pressures arise from the emergence of advanced imaging techniques and alternative diagnostic methods. End-user demographics, with an aging global population and rising prevalence of chronic diseases, significantly impact demand. M&A activity has been moderate, with key players focusing on strategic acquisitions to expand their product portfolios and geographical reach. The historical period (2019-2024) saw a steady growth, with an estimated CAGR of xx%.
- Market Concentration: Top 5 players hold approximately xx% of the market share in 2025.
- Technological Innovation: AI-driven image analysis, 3D visualization, and cloud computing are major drivers.
- Regulatory Framework: FDA, CE marking, and other regional regulations significantly impact market entry and product development.
- Competitive Substitutes: Advanced diagnostic techniques, such as molecular imaging, pose competitive challenges.
- End-User Demographics: Aging population and increasing prevalence of chronic diseases fuel market demand.
- M&A Trends: xx M&A deals were recorded between 2019 and 2024, focusing on technology acquisition and geographic expansion.
Advanced Visualization Tools Industry Growth Trends & Insights
The Advanced Visualization Tools market exhibits robust growth, driven by several factors. Market size has expanded considerably from xx Million in 2019 to an estimated xx Million in 2025. The adoption rate of advanced visualization tools is increasing across various clinical settings, propelled by improved diagnostic accuracy, streamlined workflows, and better patient outcomes. Technological disruptions, such as the integration of AI and machine learning, are revolutionizing image analysis and interpretation. Consumer behavior is shifting towards more personalized and precise diagnostic solutions, creating further opportunities for advanced visualization technologies. The market is projected to maintain a healthy CAGR of xx% during the forecast period (2025-2033), reaching xx Million by 2033. Market penetration is expected to increase from xx% in 2025 to xx% by 2033.
Dominant Regions, Countries, or Segments in Advanced Visualization Tools Industry
North America currently dominates the Advanced Visualization Tools market, followed by Europe and Asia-Pacific. Within imaging modalities, MRI and CT hold significant market shares, driven by their widespread adoption in hospitals and diagnostic centers. Oncology and cardiovascular applications represent major clinical segments, fuelled by the increasing prevalence of related diseases. In terms of product and service, hardware remains the largest segment, although software and services are experiencing rapid growth. Enterprise solutions are more prevalent than standalone solutions, reflecting the trend towards integrated healthcare IT systems.
- Key Drivers:
- Strong healthcare infrastructure in North America and Europe.
- High healthcare expenditure and technological adoption rates.
- Favorable regulatory environment.
- Increasing prevalence of chronic diseases.
- Dominant Segments:
- MRI and CT within imaging modalities.
- Oncology and cardiovascular applications within clinical applications.
- Hardware within product and service categories.
- Enterprise solutions within type of solution categories.
Advanced Visualization Tools Industry Product Landscape
The product landscape is dynamic, characterized by ongoing innovation in image processing algorithms, 3D visualization techniques, and AI-powered diagnostic tools. Products offer unique selling propositions based on enhanced image quality, improved diagnostic accuracy, streamlined workflows, and integrated data management capabilities. Recent technological advancements include the integration of deep learning for automated image analysis and the development of cloud-based platforms for remote collaboration and data sharing. Many vendors now offer bundled solutions that integrate hardware, software, and services for enhanced user experience.
Key Drivers, Barriers & Challenges in Advanced Visualization Tools Industry
Key Drivers:
- Technological advancements: AI-powered image analysis, 3D visualization, and cloud computing are driving market growth.
- Rising prevalence of chronic diseases: Increasing demand for accurate and efficient diagnostic tools.
- Government initiatives: Funding for healthcare infrastructure and technological upgrades.
Key Barriers and Challenges:
- High initial investment costs: Advanced visualization tools can be expensive, limiting adoption in resource-constrained settings.
- Regulatory hurdles: Stringent regulatory approvals and data privacy concerns.
- Data security and privacy: Concerns regarding patient data security and compliance with HIPAA and GDPR.
- Competition: Intense competition from established players and new entrants.
Emerging Opportunities in Advanced Visualization Tools Industry
- Expansion into untapped markets: Growth potential in developing economies with increasing healthcare infrastructure development.
- Development of innovative applications: AI-powered diagnostic tools and personalized medicine applications.
- Integration with telehealth platforms: Remote diagnosis and monitoring capabilities through cloud-based visualization tools.
Growth Accelerators in the Advanced Visualization Tools Industry
Technological breakthroughs in AI and machine learning are expected to further propel market growth. Strategic partnerships between technology providers and healthcare institutions will facilitate wider adoption. Expansion into emerging markets and development of innovative applications, such as personalized medicine, present significant growth opportunities.
Key Players Shaping the Advanced Visualization Tools Industry Market
- Siemens Healthcare GmbH
- Canon Inc (Canon Medical Systems Corporation)
- Terarecon Inc
- Carestream Health
- General Electric Company (GE Healthcare)
- Koninklijke Philips NV
- Pro Medicus Ltd
- Agfa-Gevaert Group
- Fujifilm Holdings Corporation
Notable Milestones in Advanced Visualization Tools Industry Sector
- August 2022: Kitware launched MIQA, a cloud-based application for medical image quality assurance, enhancing collaboration and longitudinal studies.
- February 2022: Siemens Healthineers and Universal Medical Imaging partnered to improve image screening and diagnosis efficiency in Chinese primary healthcare institutions.
In-Depth Advanced Visualization Tools Industry Market Outlook
The Advanced Visualization Tools market is poised for substantial growth in the coming years. Continued technological innovation, strategic partnerships, and expansion into new markets will drive future market potential. Companies focusing on AI-powered solutions, cloud-based platforms, and integrated healthcare IT systems are well-positioned to capitalize on the emerging opportunities. The market's long-term prospects are positive, indicating significant returns for investors and continued progress in medical diagnostics.
Advanced Visualization Tools Industry Segmentation
-
1. Product and Service
- 1.1. Hardware
- 1.2. Software
- 1.3. Services
-
2. Type of Solution
- 2.1. Enterprise
- 2.2. Standalone
-
3. Imaging Modality
- 3.1. Magnetic Resonance Imaging (MRI)
- 3.2. Computed Tomography (CT)
- 3.3. Ultrasound
- 3.4. Nuclear Medicine
- 3.5. Other Imaging Modalities
-
4. Clinical Application
- 4.1. Oncology
- 4.2. Orthopedics
- 4.3. Cardiovascular
- 4.4. Neurology
- 4.5. Other Clinical Applications
Advanced Visualization Tools Industry Segmentation By Geography
-
1. North America
- 1.1. United States
- 1.2. Canada
- 1.3. Mexico
-
2. Europe
- 2.1. Germany
- 2.2. United Kingdom
- 2.3. France
- 2.4. Italy
- 2.5. Spain
- 2.6. Rest of Europe
-
3. Asia Pacific
- 3.1. China
- 3.2. Japan
- 3.3. India
- 3.4. Australia
- 3.5. South Korea
- 3.6. Rest of Asia Pacific
-
4. Middle East and Africa
- 4.1. GCC
- 4.2. South Africa
- 4.3. Rest of Middle East and Africa
-
5. South America
- 5.1. Brazil
- 5.2. Argentina
- 5.3. Rest of South America
Advanced Visualization Tools Industry Regional Market Share
Geographic Coverage of Advanced Visualization Tools Industry
Advanced Visualization Tools Industry REPORT HIGHLIGHTS
| Aspects | Details |
|---|---|
| Study Period | 2020-2034 |
| Base Year | 2025 |
| Estimated Year | 2026 |
| Forecast Period | 2026-2034 |
| Historical Period | 2020-2025 |
| Growth Rate | CAGR of 13.8% from 2020-2034 |
| Segmentation |
|
Table of Contents
- 1. Introduction
- 1.1. Research Scope
- 1.2. Market Segmentation
- 1.3. Research Objective
- 1.4. Definitions and Assumptions
- 2. Executive Summary
- 2.1. Market Snapshot
- 3. Market Dynamics
- 3.1. Market Drivers
- 3.2. Market Restrains
- 3.3. Market Trends
- 3.4. Market Opportunities
- 4. Market Factor Analysis
- 4.1. Porters Five Forces
- 4.1.1. Bargaining Power of Suppliers
- 4.1.2. Bargaining Power of Buyers
- 4.1.3. Threat of New Entrants
- 4.1.4. Threat of Substitutes
- 4.1.5. Competitive Rivalry
- 4.2. PESTEL analysis
- 4.3. BCG Analysis
- 4.3.1. Stars (High Growth, High Market Share)
- 4.3.2. Cash Cows (Low Growth, High Market Share)
- 4.3.3. Question Mark (High Growth, Low Market Share)
- 4.3.4. Dogs (Low Growth, Low Market Share)
- 4.4. Ansoff Matrix Analysis
- 4.5. Supply Chain Analysis
- 4.6. Regulatory Landscape
- 4.7. Current Market Potential and Opportunity Assessment (TAM–SAM–SOM Framework)
- 4.8. IMR Analyst Note
- 4.1. Porters Five Forces
- 5. Market Analysis, Insights and Forecast 2021-2033
- 5.1. Market Analysis, Insights and Forecast - by Product and Service
- 5.1.1. Hardware
- 5.1.2. Software
- 5.1.3. Services
- 5.2. Market Analysis, Insights and Forecast - by Type of Solution
- 5.2.1. Enterprise
- 5.2.2. Standalone
- 5.3. Market Analysis, Insights and Forecast - by Imaging Modality
- 5.3.1. Magnetic Resonance Imaging (MRI)
- 5.3.2. Computed Tomography (CT)
- 5.3.3. Ultrasound
- 5.3.4. Nuclear Medicine
- 5.3.5. Other Imaging Modalities
- 5.4. Market Analysis, Insights and Forecast - by Clinical Application
- 5.4.1. Oncology
- 5.4.2. Orthopedics
- 5.4.3. Cardiovascular
- 5.4.4. Neurology
- 5.4.5. Other Clinical Applications
- 5.5. Market Analysis, Insights and Forecast - by Region
- 5.5.1. North America
- 5.5.2. Europe
- 5.5.3. Asia Pacific
- 5.5.4. Middle East and Africa
- 5.5.5. South America
- 5.1. Market Analysis, Insights and Forecast - by Product and Service
- 6. Global Advanced Visualization Tools Industry Analysis, Insights and Forecast, 2021-2033
- 6.1. Market Analysis, Insights and Forecast - by Product and Service
- 6.1.1. Hardware
- 6.1.2. Software
- 6.1.3. Services
- 6.2. Market Analysis, Insights and Forecast - by Type of Solution
- 6.2.1. Enterprise
- 6.2.2. Standalone
- 6.3. Market Analysis, Insights and Forecast - by Imaging Modality
- 6.3.1. Magnetic Resonance Imaging (MRI)
- 6.3.2. Computed Tomography (CT)
- 6.3.3. Ultrasound
- 6.3.4. Nuclear Medicine
- 6.3.5. Other Imaging Modalities
- 6.4. Market Analysis, Insights and Forecast - by Clinical Application
- 6.4.1. Oncology
- 6.4.2. Orthopedics
- 6.4.3. Cardiovascular
- 6.4.4. Neurology
- 6.4.5. Other Clinical Applications
- 6.1. Market Analysis, Insights and Forecast - by Product and Service
- 7. North America Advanced Visualization Tools Industry Analysis, Insights and Forecast, 2020-2032
- 7.1. Market Analysis, Insights and Forecast - by Product and Service
- 7.1.1. Hardware
- 7.1.2. Software
- 7.1.3. Services
- 7.2. Market Analysis, Insights and Forecast - by Type of Solution
- 7.2.1. Enterprise
- 7.2.2. Standalone
- 7.3. Market Analysis, Insights and Forecast - by Imaging Modality
- 7.3.1. Magnetic Resonance Imaging (MRI)
- 7.3.2. Computed Tomography (CT)
- 7.3.3. Ultrasound
- 7.3.4. Nuclear Medicine
- 7.3.5. Other Imaging Modalities
- 7.4. Market Analysis, Insights and Forecast - by Clinical Application
- 7.4.1. Oncology
- 7.4.2. Orthopedics
- 7.4.3. Cardiovascular
- 7.4.4. Neurology
- 7.4.5. Other Clinical Applications
- 7.1. Market Analysis, Insights and Forecast - by Product and Service
- 8. Europe Advanced Visualization Tools Industry Analysis, Insights and Forecast, 2020-2032
- 8.1. Market Analysis, Insights and Forecast - by Product and Service
- 8.1.1. Hardware
- 8.1.2. Software
- 8.1.3. Services
- 8.2. Market Analysis, Insights and Forecast - by Type of Solution
- 8.2.1. Enterprise
- 8.2.2. Standalone
- 8.3. Market Analysis, Insights and Forecast - by Imaging Modality
- 8.3.1. Magnetic Resonance Imaging (MRI)
- 8.3.2. Computed Tomography (CT)
- 8.3.3. Ultrasound
- 8.3.4. Nuclear Medicine
- 8.3.5. Other Imaging Modalities
- 8.4. Market Analysis, Insights and Forecast - by Clinical Application
- 8.4.1. Oncology
- 8.4.2. Orthopedics
- 8.4.3. Cardiovascular
- 8.4.4. Neurology
- 8.4.5. Other Clinical Applications
- 8.1. Market Analysis, Insights and Forecast - by Product and Service
- 9. Asia Pacific Advanced Visualization Tools Industry Analysis, Insights and Forecast, 2020-2032
- 9.1. Market Analysis, Insights and Forecast - by Product and Service
- 9.1.1. Hardware
- 9.1.2. Software
- 9.1.3. Services
- 9.2. Market Analysis, Insights and Forecast - by Type of Solution
- 9.2.1. Enterprise
- 9.2.2. Standalone
- 9.3. Market Analysis, Insights and Forecast - by Imaging Modality
- 9.3.1. Magnetic Resonance Imaging (MRI)
- 9.3.2. Computed Tomography (CT)
- 9.3.3. Ultrasound
- 9.3.4. Nuclear Medicine
- 9.3.5. Other Imaging Modalities
- 9.4. Market Analysis, Insights and Forecast - by Clinical Application
- 9.4.1. Oncology
- 9.4.2. Orthopedics
- 9.4.3. Cardiovascular
- 9.4.4. Neurology
- 9.4.5. Other Clinical Applications
- 9.1. Market Analysis, Insights and Forecast - by Product and Service
- 10. Middle East and Africa Advanced Visualization Tools Industry Analysis, Insights and Forecast, 2020-2032
- 10.1. Market Analysis, Insights and Forecast - by Product and Service
- 10.1.1. Hardware
- 10.1.2. Software
- 10.1.3. Services
- 10.2. Market Analysis, Insights and Forecast - by Type of Solution
- 10.2.1. Enterprise
- 10.2.2. Standalone
- 10.3. Market Analysis, Insights and Forecast - by Imaging Modality
- 10.3.1. Magnetic Resonance Imaging (MRI)
- 10.3.2. Computed Tomography (CT)
- 10.3.3. Ultrasound
- 10.3.4. Nuclear Medicine
- 10.3.5. Other Imaging Modalities
- 10.4. Market Analysis, Insights and Forecast - by Clinical Application
- 10.4.1. Oncology
- 10.4.2. Orthopedics
- 10.4.3. Cardiovascular
- 10.4.4. Neurology
- 10.4.5. Other Clinical Applications
- 10.1. Market Analysis, Insights and Forecast - by Product and Service
- 11. South America Advanced Visualization Tools Industry Analysis, Insights and Forecast, 2020-2032
- 11.1. Market Analysis, Insights and Forecast - by Product and Service
- 11.1.1. Hardware
- 11.1.2. Software
- 11.1.3. Services
- 11.2. Market Analysis, Insights and Forecast - by Type of Solution
- 11.2.1. Enterprise
- 11.2.2. Standalone
- 11.3. Market Analysis, Insights and Forecast - by Imaging Modality
- 11.3.1. Magnetic Resonance Imaging (MRI)
- 11.3.2. Computed Tomography (CT)
- 11.3.3. Ultrasound
- 11.3.4. Nuclear Medicine
- 11.3.5. Other Imaging Modalities
- 11.4. Market Analysis, Insights and Forecast - by Clinical Application
- 11.4.1. Oncology
- 11.4.2. Orthopedics
- 11.4.3. Cardiovascular
- 11.4.4. Neurology
- 11.4.5. Other Clinical Applications
- 11.1. Market Analysis, Insights and Forecast - by Product and Service
- 12. Competitive Analysis
- 12.1. Company Profiles
- 12.1.1 Siemens Healthcare GmbH
- 12.1.1.1. Company Overview
- 12.1.1.2. Products
- 12.1.1.3. Company Financials
- 12.1.1.4. SWOT Analysis
- 12.1.2 Canon Inc (Canon Medical Systems Corporation)
- 12.1.2.1. Company Overview
- 12.1.2.2. Products
- 12.1.2.3. Company Financials
- 12.1.2.4. SWOT Analysis
- 12.1.3 Terarecon Inc
- 12.1.3.1. Company Overview
- 12.1.3.2. Products
- 12.1.3.3. Company Financials
- 12.1.3.4. SWOT Analysis
- 12.1.4 Carestream Health
- 12.1.4.1. Company Overview
- 12.1.4.2. Products
- 12.1.4.3. Company Financials
- 12.1.4.4. SWOT Analysis
- 12.1.5 General Electric Company (GE Healthcare)
- 12.1.5.1. Company Overview
- 12.1.5.2. Products
- 12.1.5.3. Company Financials
- 12.1.5.4. SWOT Analysis
- 12.1.6 Koninklijke Philips NV
- 12.1.6.1. Company Overview
- 12.1.6.2. Products
- 12.1.6.3. Company Financials
- 12.1.6.4. SWOT Analysis
- 12.1.7 Pro Medicus Ltd
- 12.1.7.1. Company Overview
- 12.1.7.2. Products
- 12.1.7.3. Company Financials
- 12.1.7.4. SWOT Analysis
- 12.1.8 Agfa-Gevaert Group
- 12.1.8.1. Company Overview
- 12.1.8.2. Products
- 12.1.8.3. Company Financials
- 12.1.8.4. SWOT Analysis
- 12.1.9 Fujifilm Holdings Corporation
- 12.1.9.1. Company Overview
- 12.1.9.2. Products
- 12.1.9.3. Company Financials
- 12.1.9.4. SWOT Analysis
- 12.1.1 Siemens Healthcare GmbH
- 12.2. Market Entropy
- 12.2.1 Company's Key Areas Served
- 12.2.2 Recent Developments
- 12.3. Company Market Share Analysis 2025
- 12.3.1 Top 5 Companies Market Share Analysis
- 12.3.2 Top 3 Companies Market Share Analysis
- 12.4. List of Potential Customers
- 13. Research Methodology
List of Figures
- Figure 1: Global Advanced Visualization Tools Industry Revenue Breakdown (billion, %) by Region 2025 & 2033
- Figure 2: Global Advanced Visualization Tools Industry Volume Breakdown (K Unit, %) by Region 2025 & 2033
- Figure 3: North America Advanced Visualization Tools Industry Revenue (billion), by Product and Service 2025 & 2033
- Figure 4: North America Advanced Visualization Tools Industry Volume (K Unit), by Product and Service 2025 & 2033
- Figure 5: North America Advanced Visualization Tools Industry Revenue Share (%), by Product and Service 2025 & 2033
- Figure 6: North America Advanced Visualization Tools Industry Volume Share (%), by Product and Service 2025 & 2033
- Figure 7: North America Advanced Visualization Tools Industry Revenue (billion), by Type of Solution 2025 & 2033
- Figure 8: North America Advanced Visualization Tools Industry Volume (K Unit), by Type of Solution 2025 & 2033
- Figure 9: North America Advanced Visualization Tools Industry Revenue Share (%), by Type of Solution 2025 & 2033
- Figure 10: North America Advanced Visualization Tools Industry Volume Share (%), by Type of Solution 2025 & 2033
- Figure 11: North America Advanced Visualization Tools Industry Revenue (billion), by Imaging Modality 2025 & 2033
- Figure 12: North America Advanced Visualization Tools Industry Volume (K Unit), by Imaging Modality 2025 & 2033
- Figure 13: North America Advanced Visualization Tools Industry Revenue Share (%), by Imaging Modality 2025 & 2033
- Figure 14: North America Advanced Visualization Tools Industry Volume Share (%), by Imaging Modality 2025 & 2033
- Figure 15: North America Advanced Visualization Tools Industry Revenue (billion), by Clinical Application 2025 & 2033
- Figure 16: North America Advanced Visualization Tools Industry Volume (K Unit), by Clinical Application 2025 & 2033
- Figure 17: North America Advanced Visualization Tools Industry Revenue Share (%), by Clinical Application 2025 & 2033
- Figure 18: North America Advanced Visualization Tools Industry Volume Share (%), by Clinical Application 2025 & 2033
- Figure 19: North America Advanced Visualization Tools Industry Revenue (billion), by Country 2025 & 2033
- Figure 20: North America Advanced Visualization Tools Industry Volume (K Unit), by Country 2025 & 2033
- Figure 21: North America Advanced Visualization Tools Industry Revenue Share (%), by Country 2025 & 2033
- Figure 22: North America Advanced Visualization Tools Industry Volume Share (%), by Country 2025 & 2033
- Figure 23: Europe Advanced Visualization Tools Industry Revenue (billion), by Product and Service 2025 & 2033
- Figure 24: Europe Advanced Visualization Tools Industry Volume (K Unit), by Product and Service 2025 & 2033
- Figure 25: Europe Advanced Visualization Tools Industry Revenue Share (%), by Product and Service 2025 & 2033
- Figure 26: Europe Advanced Visualization Tools Industry Volume Share (%), by Product and Service 2025 & 2033
- Figure 27: Europe Advanced Visualization Tools Industry Revenue (billion), by Type of Solution 2025 & 2033
- Figure 28: Europe Advanced Visualization Tools Industry Volume (K Unit), by Type of Solution 2025 & 2033
- Figure 29: Europe Advanced Visualization Tools Industry Revenue Share (%), by Type of Solution 2025 & 2033
- Figure 30: Europe Advanced Visualization Tools Industry Volume Share (%), by Type of Solution 2025 & 2033
- Figure 31: Europe Advanced Visualization Tools Industry Revenue (billion), by Imaging Modality 2025 & 2033
- Figure 32: Europe Advanced Visualization Tools Industry Volume (K Unit), by Imaging Modality 2025 & 2033
- Figure 33: Europe Advanced Visualization Tools Industry Revenue Share (%), by Imaging Modality 2025 & 2033
- Figure 34: Europe Advanced Visualization Tools Industry Volume Share (%), by Imaging Modality 2025 & 2033
- Figure 35: Europe Advanced Visualization Tools Industry Revenue (billion), by Clinical Application 2025 & 2033
- Figure 36: Europe Advanced Visualization Tools Industry Volume (K Unit), by Clinical Application 2025 & 2033
- Figure 37: Europe Advanced Visualization Tools Industry Revenue Share (%), by Clinical Application 2025 & 2033
- Figure 38: Europe Advanced Visualization Tools Industry Volume Share (%), by Clinical Application 2025 & 2033
- Figure 39: Europe Advanced Visualization Tools Industry Revenue (billion), by Country 2025 & 2033
- Figure 40: Europe Advanced Visualization Tools Industry Volume (K Unit), by Country 2025 & 2033
- Figure 41: Europe Advanced Visualization Tools Industry Revenue Share (%), by Country 2025 & 2033
- Figure 42: Europe Advanced Visualization Tools Industry Volume Share (%), by Country 2025 & 2033
- Figure 43: Asia Pacific Advanced Visualization Tools Industry Revenue (billion), by Product and Service 2025 & 2033
- Figure 44: Asia Pacific Advanced Visualization Tools Industry Volume (K Unit), by Product and Service 2025 & 2033
- Figure 45: Asia Pacific Advanced Visualization Tools Industry Revenue Share (%), by Product and Service 2025 & 2033
- Figure 46: Asia Pacific Advanced Visualization Tools Industry Volume Share (%), by Product and Service 2025 & 2033
- Figure 47: Asia Pacific Advanced Visualization Tools Industry Revenue (billion), by Type of Solution 2025 & 2033
- Figure 48: Asia Pacific Advanced Visualization Tools Industry Volume (K Unit), by Type of Solution 2025 & 2033
- Figure 49: Asia Pacific Advanced Visualization Tools Industry Revenue Share (%), by Type of Solution 2025 & 2033
- Figure 50: Asia Pacific Advanced Visualization Tools Industry Volume Share (%), by Type of Solution 2025 & 2033
- Figure 51: Asia Pacific Advanced Visualization Tools Industry Revenue (billion), by Imaging Modality 2025 & 2033
- Figure 52: Asia Pacific Advanced Visualization Tools Industry Volume (K Unit), by Imaging Modality 2025 & 2033
- Figure 53: Asia Pacific Advanced Visualization Tools Industry Revenue Share (%), by Imaging Modality 2025 & 2033
- Figure 54: Asia Pacific Advanced Visualization Tools Industry Volume Share (%), by Imaging Modality 2025 & 2033
- Figure 55: Asia Pacific Advanced Visualization Tools Industry Revenue (billion), by Clinical Application 2025 & 2033
- Figure 56: Asia Pacific Advanced Visualization Tools Industry Volume (K Unit), by Clinical Application 2025 & 2033
- Figure 57: Asia Pacific Advanced Visualization Tools Industry Revenue Share (%), by Clinical Application 2025 & 2033
- Figure 58: Asia Pacific Advanced Visualization Tools Industry Volume Share (%), by Clinical Application 2025 & 2033
- Figure 59: Asia Pacific Advanced Visualization Tools Industry Revenue (billion), by Country 2025 & 2033
- Figure 60: Asia Pacific Advanced Visualization Tools Industry Volume (K Unit), by Country 2025 & 2033
- Figure 61: Asia Pacific Advanced Visualization Tools Industry Revenue Share (%), by Country 2025 & 2033
- Figure 62: Asia Pacific Advanced Visualization Tools Industry Volume Share (%), by Country 2025 & 2033
- Figure 63: Middle East and Africa Advanced Visualization Tools Industry Revenue (billion), by Product and Service 2025 & 2033
- Figure 64: Middle East and Africa Advanced Visualization Tools Industry Volume (K Unit), by Product and Service 2025 & 2033
- Figure 65: Middle East and Africa Advanced Visualization Tools Industry Revenue Share (%), by Product and Service 2025 & 2033
- Figure 66: Middle East and Africa Advanced Visualization Tools Industry Volume Share (%), by Product and Service 2025 & 2033
- Figure 67: Middle East and Africa Advanced Visualization Tools Industry Revenue (billion), by Type of Solution 2025 & 2033
- Figure 68: Middle East and Africa Advanced Visualization Tools Industry Volume (K Unit), by Type of Solution 2025 & 2033
- Figure 69: Middle East and Africa Advanced Visualization Tools Industry Revenue Share (%), by Type of Solution 2025 & 2033
- Figure 70: Middle East and Africa Advanced Visualization Tools Industry Volume Share (%), by Type of Solution 2025 & 2033
- Figure 71: Middle East and Africa Advanced Visualization Tools Industry Revenue (billion), by Imaging Modality 2025 & 2033
- Figure 72: Middle East and Africa Advanced Visualization Tools Industry Volume (K Unit), by Imaging Modality 2025 & 2033
- Figure 73: Middle East and Africa Advanced Visualization Tools Industry Revenue Share (%), by Imaging Modality 2025 & 2033
- Figure 74: Middle East and Africa Advanced Visualization Tools Industry Volume Share (%), by Imaging Modality 2025 & 2033
- Figure 75: Middle East and Africa Advanced Visualization Tools Industry Revenue (billion), by Clinical Application 2025 & 2033
- Figure 76: Middle East and Africa Advanced Visualization Tools Industry Volume (K Unit), by Clinical Application 2025 & 2033
- Figure 77: Middle East and Africa Advanced Visualization Tools Industry Revenue Share (%), by Clinical Application 2025 & 2033
- Figure 78: Middle East and Africa Advanced Visualization Tools Industry Volume Share (%), by Clinical Application 2025 & 2033
- Figure 79: Middle East and Africa Advanced Visualization Tools Industry Revenue (billion), by Country 2025 & 2033
- Figure 80: Middle East and Africa Advanced Visualization Tools Industry Volume (K Unit), by Country 2025 & 2033
- Figure 81: Middle East and Africa Advanced Visualization Tools Industry Revenue Share (%), by Country 2025 & 2033
- Figure 82: Middle East and Africa Advanced Visualization Tools Industry Volume Share (%), by Country 2025 & 2033
- Figure 83: South America Advanced Visualization Tools Industry Revenue (billion), by Product and Service 2025 & 2033
- Figure 84: South America Advanced Visualization Tools Industry Volume (K Unit), by Product and Service 2025 & 2033
- Figure 85: South America Advanced Visualization Tools Industry Revenue Share (%), by Product and Service 2025 & 2033
- Figure 86: South America Advanced Visualization Tools Industry Volume Share (%), by Product and Service 2025 & 2033
- Figure 87: South America Advanced Visualization Tools Industry Revenue (billion), by Type of Solution 2025 & 2033
- Figure 88: South America Advanced Visualization Tools Industry Volume (K Unit), by Type of Solution 2025 & 2033
- Figure 89: South America Advanced Visualization Tools Industry Revenue Share (%), by Type of Solution 2025 & 2033
- Figure 90: South America Advanced Visualization Tools Industry Volume Share (%), by Type of Solution 2025 & 2033
- Figure 91: South America Advanced Visualization Tools Industry Revenue (billion), by Imaging Modality 2025 & 2033
- Figure 92: South America Advanced Visualization Tools Industry Volume (K Unit), by Imaging Modality 2025 & 2033
- Figure 93: South America Advanced Visualization Tools Industry Revenue Share (%), by Imaging Modality 2025 & 2033
- Figure 94: South America Advanced Visualization Tools Industry Volume Share (%), by Imaging Modality 2025 & 2033
- Figure 95: South America Advanced Visualization Tools Industry Revenue (billion), by Clinical Application 2025 & 2033
- Figure 96: South America Advanced Visualization Tools Industry Volume (K Unit), by Clinical Application 2025 & 2033
- Figure 97: South America Advanced Visualization Tools Industry Revenue Share (%), by Clinical Application 2025 & 2033
- Figure 98: South America Advanced Visualization Tools Industry Volume Share (%), by Clinical Application 2025 & 2033
- Figure 99: South America Advanced Visualization Tools Industry Revenue (billion), by Country 2025 & 2033
- Figure 100: South America Advanced Visualization Tools Industry Volume (K Unit), by Country 2025 & 2033
- Figure 101: South America Advanced Visualization Tools Industry Revenue Share (%), by Country 2025 & 2033
- Figure 102: South America Advanced Visualization Tools Industry Volume Share (%), by Country 2025 & 2033
List of Tables
- Table 1: Global Advanced Visualization Tools Industry Revenue billion Forecast, by Product and Service 2020 & 2033
- Table 2: Global Advanced Visualization Tools Industry Volume K Unit Forecast, by Product and Service 2020 & 2033
- Table 3: Global Advanced Visualization Tools Industry Revenue billion Forecast, by Type of Solution 2020 & 2033
- Table 4: Global Advanced Visualization Tools Industry Volume K Unit Forecast, by Type of Solution 2020 & 2033
- Table 5: Global Advanced Visualization Tools Industry Revenue billion Forecast, by Imaging Modality 2020 & 2033
- Table 6: Global Advanced Visualization Tools Industry Volume K Unit Forecast, by Imaging Modality 2020 & 2033
- Table 7: Global Advanced Visualization Tools Industry Revenue billion Forecast, by Clinical Application 2020 & 2033
- Table 8: Global Advanced Visualization Tools Industry Volume K Unit Forecast, by Clinical Application 2020 & 2033
- Table 9: Global Advanced Visualization Tools Industry Revenue billion Forecast, by Region 2020 & 2033
- Table 10: Global Advanced Visualization Tools Industry Volume K Unit Forecast, by Region 2020 & 2033
- Table 11: Global Advanced Visualization Tools Industry Revenue billion Forecast, by Product and Service 2020 & 2033
- Table 12: Global Advanced Visualization Tools Industry Volume K Unit Forecast, by Product and Service 2020 & 2033
- Table 13: Global Advanced Visualization Tools Industry Revenue billion Forecast, by Type of Solution 2020 & 2033
- Table 14: Global Advanced Visualization Tools Industry Volume K Unit Forecast, by Type of Solution 2020 & 2033
- Table 15: Global Advanced Visualization Tools Industry Revenue billion Forecast, by Imaging Modality 2020 & 2033
- Table 16: Global Advanced Visualization Tools Industry Volume K Unit Forecast, by Imaging Modality 2020 & 2033
- Table 17: Global Advanced Visualization Tools Industry Revenue billion Forecast, by Clinical Application 2020 & 2033
- Table 18: Global Advanced Visualization Tools Industry Volume K Unit Forecast, by Clinical Application 2020 & 2033
- Table 19: Global Advanced Visualization Tools Industry Revenue billion Forecast, by Country 2020 & 2033
- Table 20: Global Advanced Visualization Tools Industry Volume K Unit Forecast, by Country 2020 & 2033
- Table 21: United States Advanced Visualization Tools Industry Revenue (billion) Forecast, by Application 2020 & 2033
- Table 22: United States Advanced Visualization Tools Industry Volume (K Unit) Forecast, by Application 2020 & 2033
- Table 23: Canada Advanced Visualization Tools Industry Revenue (billion) Forecast, by Application 2020 & 2033
- Table 24: Canada Advanced Visualization Tools Industry Volume (K Unit) Forecast, by Application 2020 & 2033
- Table 25: Mexico Advanced Visualization Tools Industry Revenue (billion) Forecast, by Application 2020 & 2033
- Table 26: Mexico Advanced Visualization Tools Industry Volume (K Unit) Forecast, by Application 2020 & 2033
- Table 27: Global Advanced Visualization Tools Industry Revenue billion Forecast, by Product and Service 2020 & 2033
- Table 28: Global Advanced Visualization Tools Industry Volume K Unit Forecast, by Product and Service 2020 & 2033
- Table 29: Global Advanced Visualization Tools Industry Revenue billion Forecast, by Type of Solution 2020 & 2033
- Table 30: Global Advanced Visualization Tools Industry Volume K Unit Forecast, by Type of Solution 2020 & 2033
- Table 31: Global Advanced Visualization Tools Industry Revenue billion Forecast, by Imaging Modality 2020 & 2033
- Table 32: Global Advanced Visualization Tools Industry Volume K Unit Forecast, by Imaging Modality 2020 & 2033
- Table 33: Global Advanced Visualization Tools Industry Revenue billion Forecast, by Clinical Application 2020 & 2033
- Table 34: Global Advanced Visualization Tools Industry Volume K Unit Forecast, by Clinical Application 2020 & 2033
- Table 35: Global Advanced Visualization Tools Industry Revenue billion Forecast, by Country 2020 & 2033
- Table 36: Global Advanced Visualization Tools Industry Volume K Unit Forecast, by Country 2020 & 2033
- Table 37: Germany Advanced Visualization Tools Industry Revenue (billion) Forecast, by Application 2020 & 2033
- Table 38: Germany Advanced Visualization Tools Industry Volume (K Unit) Forecast, by Application 2020 & 2033
- Table 39: United Kingdom Advanced Visualization Tools Industry Revenue (billion) Forecast, by Application 2020 & 2033
- Table 40: United Kingdom Advanced Visualization Tools Industry Volume (K Unit) Forecast, by Application 2020 & 2033
- Table 41: France Advanced Visualization Tools Industry Revenue (billion) Forecast, by Application 2020 & 2033
- Table 42: France Advanced Visualization Tools Industry Volume (K Unit) Forecast, by Application 2020 & 2033
- Table 43: Italy Advanced Visualization Tools Industry Revenue (billion) Forecast, by Application 2020 & 2033
- Table 44: Italy Advanced Visualization Tools Industry Volume (K Unit) Forecast, by Application 2020 & 2033
- Table 45: Spain Advanced Visualization Tools Industry Revenue (billion) Forecast, by Application 2020 & 2033
- Table 46: Spain Advanced Visualization Tools Industry Volume (K Unit) Forecast, by Application 2020 & 2033
- Table 47: Rest of Europe Advanced Visualization Tools Industry Revenue (billion) Forecast, by Application 2020 & 2033
- Table 48: Rest of Europe Advanced Visualization Tools Industry Volume (K Unit) Forecast, by Application 2020 & 2033
- Table 49: Global Advanced Visualization Tools Industry Revenue billion Forecast, by Product and Service 2020 & 2033
- Table 50: Global Advanced Visualization Tools Industry Volume K Unit Forecast, by Product and Service 2020 & 2033
- Table 51: Global Advanced Visualization Tools Industry Revenue billion Forecast, by Type of Solution 2020 & 2033
- Table 52: Global Advanced Visualization Tools Industry Volume K Unit Forecast, by Type of Solution 2020 & 2033
- Table 53: Global Advanced Visualization Tools Industry Revenue billion Forecast, by Imaging Modality 2020 & 2033
- Table 54: Global Advanced Visualization Tools Industry Volume K Unit Forecast, by Imaging Modality 2020 & 2033
- Table 55: Global Advanced Visualization Tools Industry Revenue billion Forecast, by Clinical Application 2020 & 2033
- Table 56: Global Advanced Visualization Tools Industry Volume K Unit Forecast, by Clinical Application 2020 & 2033
- Table 57: Global Advanced Visualization Tools Industry Revenue billion Forecast, by Country 2020 & 2033
- Table 58: Global Advanced Visualization Tools Industry Volume K Unit Forecast, by Country 2020 & 2033
- Table 59: China Advanced Visualization Tools Industry Revenue (billion) Forecast, by Application 2020 & 2033
- Table 60: China Advanced Visualization Tools Industry Volume (K Unit) Forecast, by Application 2020 & 2033
- Table 61: Japan Advanced Visualization Tools Industry Revenue (billion) Forecast, by Application 2020 & 2033
- Table 62: Japan Advanced Visualization Tools Industry Volume (K Unit) Forecast, by Application 2020 & 2033
- Table 63: India Advanced Visualization Tools Industry Revenue (billion) Forecast, by Application 2020 & 2033
- Table 64: India Advanced Visualization Tools Industry Volume (K Unit) Forecast, by Application 2020 & 2033
- Table 65: Australia Advanced Visualization Tools Industry Revenue (billion) Forecast, by Application 2020 & 2033
- Table 66: Australia Advanced Visualization Tools Industry Volume (K Unit) Forecast, by Application 2020 & 2033
- Table 67: South Korea Advanced Visualization Tools Industry Revenue (billion) Forecast, by Application 2020 & 2033
- Table 68: South Korea Advanced Visualization Tools Industry Volume (K Unit) Forecast, by Application 2020 & 2033
- Table 69: Rest of Asia Pacific Advanced Visualization Tools Industry Revenue (billion) Forecast, by Application 2020 & 2033
- Table 70: Rest of Asia Pacific Advanced Visualization Tools Industry Volume (K Unit) Forecast, by Application 2020 & 2033
- Table 71: Global Advanced Visualization Tools Industry Revenue billion Forecast, by Product and Service 2020 & 2033
- Table 72: Global Advanced Visualization Tools Industry Volume K Unit Forecast, by Product and Service 2020 & 2033
- Table 73: Global Advanced Visualization Tools Industry Revenue billion Forecast, by Type of Solution 2020 & 2033
- Table 74: Global Advanced Visualization Tools Industry Volume K Unit Forecast, by Type of Solution 2020 & 2033
- Table 75: Global Advanced Visualization Tools Industry Revenue billion Forecast, by Imaging Modality 2020 & 2033
- Table 76: Global Advanced Visualization Tools Industry Volume K Unit Forecast, by Imaging Modality 2020 & 2033
- Table 77: Global Advanced Visualization Tools Industry Revenue billion Forecast, by Clinical Application 2020 & 2033
- Table 78: Global Advanced Visualization Tools Industry Volume K Unit Forecast, by Clinical Application 2020 & 2033
- Table 79: Global Advanced Visualization Tools Industry Revenue billion Forecast, by Country 2020 & 2033
- Table 80: Global Advanced Visualization Tools Industry Volume K Unit Forecast, by Country 2020 & 2033
- Table 81: GCC Advanced Visualization Tools Industry Revenue (billion) Forecast, by Application 2020 & 2033
- Table 82: GCC Advanced Visualization Tools Industry Volume (K Unit) Forecast, by Application 2020 & 2033
- Table 83: South Africa Advanced Visualization Tools Industry Revenue (billion) Forecast, by Application 2020 & 2033
- Table 84: South Africa Advanced Visualization Tools Industry Volume (K Unit) Forecast, by Application 2020 & 2033
- Table 85: Rest of Middle East and Africa Advanced Visualization Tools Industry Revenue (billion) Forecast, by Application 2020 & 2033
- Table 86: Rest of Middle East and Africa Advanced Visualization Tools Industry Volume (K Unit) Forecast, by Application 2020 & 2033
- Table 87: Global Advanced Visualization Tools Industry Revenue billion Forecast, by Product and Service 2020 & 2033
- Table 88: Global Advanced Visualization Tools Industry Volume K Unit Forecast, by Product and Service 2020 & 2033
- Table 89: Global Advanced Visualization Tools Industry Revenue billion Forecast, by Type of Solution 2020 & 2033
- Table 90: Global Advanced Visualization Tools Industry Volume K Unit Forecast, by Type of Solution 2020 & 2033
- Table 91: Global Advanced Visualization Tools Industry Revenue billion Forecast, by Imaging Modality 2020 & 2033
- Table 92: Global Advanced Visualization Tools Industry Volume K Unit Forecast, by Imaging Modality 2020 & 2033
- Table 93: Global Advanced Visualization Tools Industry Revenue billion Forecast, by Clinical Application 2020 & 2033
- Table 94: Global Advanced Visualization Tools Industry Volume K Unit Forecast, by Clinical Application 2020 & 2033
- Table 95: Global Advanced Visualization Tools Industry Revenue billion Forecast, by Country 2020 & 2033
- Table 96: Global Advanced Visualization Tools Industry Volume K Unit Forecast, by Country 2020 & 2033
- Table 97: Brazil Advanced Visualization Tools Industry Revenue (billion) Forecast, by Application 2020 & 2033
- Table 98: Brazil Advanced Visualization Tools Industry Volume (K Unit) Forecast, by Application 2020 & 2033
- Table 99: Argentina Advanced Visualization Tools Industry Revenue (billion) Forecast, by Application 2020 & 2033
- Table 100: Argentina Advanced Visualization Tools Industry Volume (K Unit) Forecast, by Application 2020 & 2033
- Table 101: Rest of South America Advanced Visualization Tools Industry Revenue (billion) Forecast, by Application 2020 & 2033
- Table 102: Rest of South America Advanced Visualization Tools Industry Volume (K Unit) Forecast, by Application 2020 & 2033
Frequently Asked Questions
1. What is the projected Compound Annual Growth Rate (CAGR) of the Advanced Visualization Tools Industry?
The projected CAGR is approximately 13.8%.
2. Which companies are prominent players in the Advanced Visualization Tools Industry?
Key companies in the market include Siemens Healthcare GmbH, Canon Inc (Canon Medical Systems Corporation), Terarecon Inc , Carestream Health, General Electric Company (GE Healthcare), Koninklijke Philips NV, Pro Medicus Ltd, Agfa-Gevaert Group, Fujifilm Holdings Corporation.
3. What are the main segments of the Advanced Visualization Tools Industry?
The market segments include Product and Service, Type of Solution, Imaging Modality, Clinical Application.
4. Can you provide details about the market size?
The market size is estimated to be USD 4.14 billion as of 2022.
5. What are some drivers contributing to market growth?
Increasing Prevalence of Chronic Diseases Coupled With Growing Geriatric Population; Rising Awareness of Benefits associated with Advanced Visualization Tools in Disease Diagnosis.
6. What are the notable trends driving market growth?
Oncology Under Clinical Application Expected to Grow Over the Forecast Period.
7. Are there any restraints impacting market growth?
Limited Availability of Reimbursements for Radiology-Based Diagnostic Procedures.
8. Can you provide examples of recent developments in the market?
August 2022: Kitware launched MIQA, a cloud-based application for medical image quality assurance. It facilitates collaboration and longitudinal studies by geographically diverse teams.
9. What pricing options are available for accessing the report?
Pricing options include single-user, multi-user, and enterprise licenses priced at USD 4750, USD 5250, and USD 8750 respectively.
10. Is the market size provided in terms of value or volume?
The market size is provided in terms of value, measured in billion and volume, measured in K Unit.
11. Are there any specific market keywords associated with the report?
Yes, the market keyword associated with the report is "Advanced Visualization Tools Industry," which aids in identifying and referencing the specific market segment covered.
12. How do I determine which pricing option suits my needs best?
The pricing options vary based on user requirements and access needs. Individual users may opt for single-user licenses, while businesses requiring broader access may choose multi-user or enterprise licenses for cost-effective access to the report.
13. Are there any additional resources or data provided in the Advanced Visualization Tools Industry report?
While the report offers comprehensive insights, it's advisable to review the specific contents or supplementary materials provided to ascertain if additional resources or data are available.
14. How can I stay updated on further developments or reports in the Advanced Visualization Tools Industry?
To stay informed about further developments, trends, and reports in the Advanced Visualization Tools Industry, consider subscribing to industry newsletters, following relevant companies and organizations, or regularly checking reputable industry news sources and publications.
Methodology
Step 1 - Identification of Relevant Samples Size from Population Database


Step 2 - Approaches for Defining Global Market Size (Value, Volume* & Price*)

Note*: In applicable scenarios
Step 3 - Data Sources
Primary Research
- Web Analytics
- Survey Reports
- Research Institute
- Latest Research Reports
- Opinion Leaders
Secondary Research
- Annual Reports
- White Paper
- Latest Press Release
- Industry Association
- Paid Database
- Investor Presentations

Step 4 - Data Triangulation
Involves using different sources of information in order to increase the validity of a study
These sources are likely to be stakeholders in a program - participants, other researchers, program staff, other community members, and so on.
Then we put all data in single framework & apply various statistical tools to find out the dynamic on the market.
During the analysis stage, feedback from the stakeholder groups would be compared to determine areas of agreement as well as areas of divergence