

Key Insights
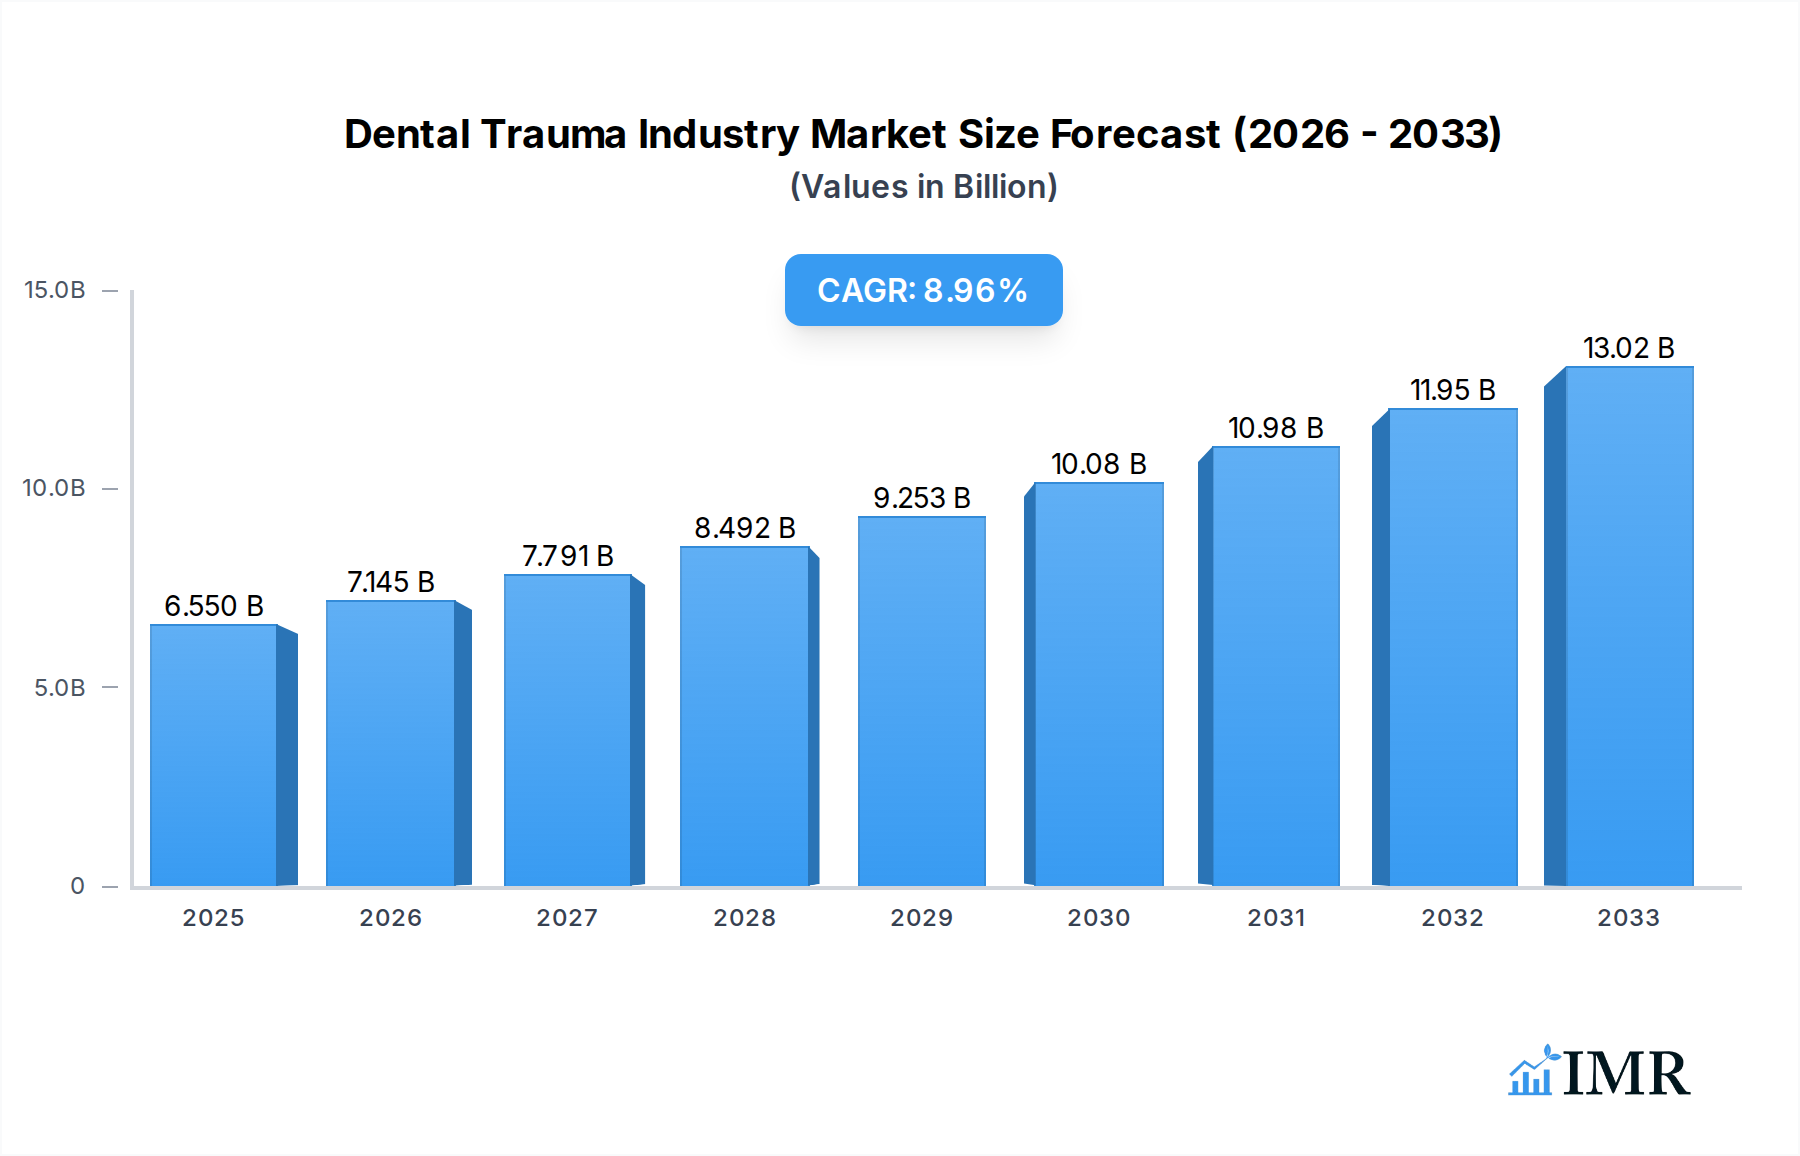
The global dental trauma market is poised for significant expansion, projected to reach an estimated $6.55 billion in 2025 and exhibit a robust compound annual growth rate (CAGR) of 9.03% through 2033. This growth is propelled by an increasing prevalence of dental injuries, largely attributed to rising participation in sports and recreational activities, as well as a growing number of road traffic accidents. The escalating demand for advanced dental treatments, including sophisticated surgical procedures and restorative techniques, further fuels market expansion. Furthermore, a heightened global awareness regarding oral health and the availability of innovative dental materials and technologies are contributing to the upward trajectory of this market. The market is segmented by type into absorbable and non-absorbable sutures, and by material into synthetic and natural variations, catering to diverse clinical needs and preferences. Techniques like mattress sutures, crisscross sutures, interrupted simple sutures, and continuous simple sutures offer tailored solutions for various dental trauma management scenarios.

Dental Trauma Industry Market Size (In Billion)
Key drivers underpinning this market growth include the increasing adoption of minimally invasive surgical techniques in dentistry, which often require specialized sutures for precise wound closure. The growing geriatric population, susceptible to oral health issues and fractures, also contributes to the demand for dental trauma management solutions. Innovations in biomaterials, leading to the development of biocompatible and bioresorbable sutures, are enhancing treatment outcomes and patient comfort, thereby stimulating market penetration. While the market demonstrates a strong growth outlook, factors such as the high cost of advanced dental treatments and limited access to specialized dental care in certain developing regions could pose as potential restraints. Nevertheless, the dynamic nature of dental technology and the continuous innovation by key players like DemeTECH Corporation, Weigao Group, and Mani Inc. are expected to overcome these challenges and sustain the market's impressive growth trajectory across major regions including North America, Europe, and Asia Pacific.
Dental Trauma Industry Company Market Share
Comprehensive Report: Dental Trauma Industry Analysis, Trends, and Future Outlook (2019–2033)
This in-depth report provides a definitive analysis of the global Dental Trauma Industry, offering a granular view of market dynamics, growth trajectories, and competitive landscapes. Covering the period from 2019 to 2033, with a base and estimated year of 2025, this research is essential for stakeholders seeking to understand and capitalize on the evolving dental trauma treatment market. We delve into parent and child market segments, leveraging high-traffic keywords to ensure maximum industry professional engagement and search engine visibility.
Dental Trauma Industry Market Dynamics & Structure
The Dental Trauma Industry exhibits a moderately concentrated market structure, driven by continuous technological advancements and stringent regulatory frameworks governing medical devices. Key innovation drivers include the development of advanced biomaterials and minimally invasive surgical techniques, aiming to improve patient outcomes and reduce recovery times. Competition is characterized by a blend of established players and emerging innovators, with a growing emphasis on research and development to differentiate product offerings.
- Market Concentration: Dominated by a few large players, but with increasing fragmentation due to specialized product development.
- Technological Innovation Drivers: Advancements in suture materials, biomimetic coatings, and minimally invasive instruments for trauma repair.
- Regulatory Frameworks: Strict FDA, EMA, and other regional regulatory approvals are crucial for market entry and product lifecycle management.
- Competitive Product Substitutes: Competition arises from alternative treatments, less invasive dental procedures, and advancements in restorative dentistry.
- End-User Demographics: Primarily dentists, oral surgeons, orthodontists, and periodontists, with increasing demand from emergency dental care providers.
- M&A Trends: Consolidation is observed as larger companies acquire innovative startups to expand their product portfolios and technological capabilities, valued at an estimated $1.5 billion in M&A deals within the historical period.
Dental Trauma Industry Growth Trends & Insights
The global Dental Trauma Industry is poised for significant expansion, projected to reach a market size of $10.2 billion by 2033, exhibiting a Compound Annual Growth Rate (CAGR) of 6.8% from 2025 to 2033. This robust growth is underpinned by an increasing incidence of dental trauma due to sports injuries, accidents, and growing awareness of advanced treatment options. The adoption rates of innovative dental repair materials and techniques are accelerating, driven by enhanced efficacy and patient demand for less intrusive procedures. Technological disruptions, such as the integration of AI in diagnosis and robotic-assisted suturing, are further shaping the market. Consumer behavior is shifting towards seeking immediate and effective solutions for dental injuries, propelling demand for specialized trauma care products.
The market penetration of advanced dental sutures, particularly non-absorbable and specialized synthetic materials, is steadily increasing, reflecting a preference for predictable healing and long-term stability. The historical period (2019-2024) witnessed an average market growth of 5.5% CAGR, laying a strong foundation for future expansion. Emerging economies are also contributing to growth due to rising disposable incomes and improved healthcare infrastructure, leading to greater access to advanced dental treatments. The forecast period (2025-2033) is expected to see continued innovation in biodegradable materials and novel fixation devices, further stimulating market growth.
Dominant Regions, Countries, or Segments in Dental Trauma Industry
North America currently dominates the Dental Trauma Industry, driven by a highly developed healthcare infrastructure, significant investments in dental research and development, and a high prevalence of dental trauma-related incidents. The United States, in particular, represents a substantial market share of an estimated 35% within the global industry. This dominance is fueled by advanced reimbursement policies, a large pool of highly skilled dental professionals, and a proactive adoption of cutting-edge dental technologies. The disposable income levels and increasing consumer awareness regarding the importance of specialized dental trauma care further solidify North America's leading position.
- Segment Dominance (Type): Non-absorbable sutures hold a significant market share, estimated at 60%, due to their superior tensile strength and stability required for complex trauma repairs, particularly in cases involving bone or extensive soft tissue damage. Absorbable sutures, while growing in popularity for less severe cases, lag behind.
- Segment Dominance (Material): Synthetic Material accounts for the largest market share, approximately 70%, owing to their predictability, biocompatibility, and diverse properties, including high tensile strength and controlled degradation rates. Natural materials, like silk or gut, are less prevalent in modern trauma management.
- Segment Dominance (Technique): Interrupted Simple Sutures are the most widely utilized technique, representing an estimated 45% of applications in dental trauma, offering flexibility and precise tissue approximation. Continuous sutures and mattress sutures also play crucial roles depending on the specific injury and location.
Economic policies supporting healthcare innovation and infrastructure development in countries like Canada and Mexico further bolster the North American market. The presence of leading dental implant and surgical device manufacturers in the region also contributes significantly to its market leadership. The projected growth in this region is estimated at 7.2% CAGR over the forecast period, underscoring its continued importance.
Dental Trauma Industry Product Landscape
The product landscape of the Dental Trauma Industry is characterized by continuous innovation aimed at improving efficacy, patient comfort, and procedural efficiency. Key product developments focus on advanced suture materials offering enhanced tensile strength and reduced tissue reactivity, such as high-performance polymers and bio-engineered absorbable materials. Specialized dental adhesives and sealants for wound closure are also gaining traction as alternatives or adjuncts to traditional suturing. Furthermore, the industry is witnessing the integration of antimicrobial properties into sutures and wound dressings to combat infection, a common complication in dental trauma cases.
Unique selling propositions often revolve around biomimetic properties, faster healing times, and reduced scarring. Technological advancements are leading to the development of resorbable fixation devices for bone fractures and advanced materials for reconstruction of damaged dental tissues, thereby expanding the therapeutic options available for complex trauma cases.
Key Drivers, Barriers & Challenges in Dental Trauma Industry
Key Drivers:
- Increasing Incidence of Dental Trauma: Rising sports-related injuries, vehicular accidents, and falls contribute to a growing patient pool requiring specialized treatment.
- Technological Advancements: Development of novel biomaterials, minimally invasive surgical techniques, and advanced diagnostic tools enhance treatment outcomes.
- Growing Awareness and Demand for Aesthetic Outcomes: Patients are increasingly seeking effective treatments that also prioritize cosmetic results, driving demand for sophisticated repair solutions.
- Aging Global Population: An aging demographic often leads to increased susceptibility to falls and associated dental injuries.
Barriers & Challenges:
- High Cost of Advanced Treatments: Innovative products and procedures can be expensive, limiting accessibility in certain regions or for specific patient demographics.
- Regulatory Hurdles: Stringent approval processes for new medical devices can prolong market entry and increase development costs.
- Limited Reimbursement Policies: Inadequate or inconsistent insurance coverage for certain dental trauma procedures can affect patient affordability and provider adoption.
- Supply Chain Disruptions: Global events and geopolitical factors can impact the availability and cost of raw materials and finished products, estimated to impact supply chain costs by up to 15% historically.
- Skilled Professional Shortage: A need for highly trained dental surgeons proficient in advanced trauma management techniques can limit the widespread adoption of new technologies.
Emerging Opportunities in Dental Trauma Industry
Emerging opportunities in the Dental Trauma Industry lie in the development and adoption of advanced regenerative medicine techniques, such as stem cell therapies and growth factor applications, to accelerate tissue repair and regeneration. The untapped potential in developing nations presents a significant growth avenue, requiring localized, cost-effective solutions tailored to specific market needs. Furthermore, the integration of digital technologies, including AI-powered diagnostic tools for precise injury assessment and augmented reality for surgical planning, offers a promising frontier. The growing demand for personalized treatment plans and minimally invasive procedures will continue to drive innovation in customized implantable devices and advanced wound care solutions.
Growth Accelerators in the Dental Trauma Industry Industry
Long-term growth in the Dental Trauma Industry will be significantly propelled by breakthroughs in biomaterials science, leading to the development of next-generation sutures, scaffolds, and fixation devices with superior biocompatibility and accelerated healing properties. Strategic partnerships between technology providers and dental manufacturers will foster the integration of digital health solutions, enhancing diagnostic accuracy and treatment planning. Market expansion into underserved regions, coupled with increasing global healthcare expenditure, will create substantial opportunities. The continuous evolution of minimally invasive surgical techniques will further drive the adoption of specialized instruments and materials, solidifying the industry's upward trajectory.
Key Players Shaping the Dental Trauma Industry Market
- DemeTECH Corporation
- Weigao Group
- HYGITECH
- Mani Inc
- Theragenics (CP Medical)
- Sutumed
- SMI
- Osteogenics Biomedical
- Lux Sutures
- Katsan Medical Devices
Notable Milestones in Dental Trauma Industry Sector
- May 2022: Medical Microinstruments (MMI) SpA launches the Symani Surgical System Simulator developed by VirtaMed, enhancing training for microsurgery, directly impacting the skill set for complex trauma reconstructions.
- April 2021: Dolphin Suture expands its dental product portfolio in India with the launch of its non-absorbable Polytetrafluoroethylene suture, TEFLENE, offering a new high-performance option for dental trauma repair.
In-Depth Dental Trauma Industry Market Outlook
The future outlook for the Dental Trauma Industry is exceptionally positive, driven by a confluence of increasing trauma incidence, relentless technological innovation, and a growing emphasis on patient-centric care. The market is expected to witness sustained growth, fueled by advancements in regenerative medicine, personalized treatment approaches, and the expanding adoption of digital health technologies. Strategic investments in research and development, coupled with market expansion into emerging economies, will be crucial for capitalizing on the vast potential. Stakeholders can anticipate significant opportunities in developing novel, cost-effective, and minimally invasive solutions that cater to the evolving needs of patients and healthcare providers worldwide, ensuring continued market expansion and improved patient outcomes.
Dental Trauma Industry Segmentation
-
1. Type
- 1.1. Absorbable
- 1.2. Non-absorbable
-
2. Material
- 2.1. Synthetic Material
- 2.2. Natural Material
-
3. Technique
- 3.1. Mattress Sutures
- 3.2. Crisscross Sutures
- 3.3. Interrupted Simple Sutures
- 3.4. Continuous Simple Sutures
Dental Trauma Industry Segmentation By Geography
-
1. North America
- 1.1. United States
- 1.2. Canada
- 1.3. Mexico
-
2. Europe
- 2.1. United Kingdom
- 2.2. France
- 2.3. Germany
- 2.4. Italy
- 2.5. Spain
- 2.6. Rest of Europe
-
3. Asia Pacific
- 3.1. India
- 3.2. China
- 3.3. Japan
- 3.4. Australia
- 3.5. South Korea
- 3.6. Rest of Asia Pacific
-
4. Middle East and Africa
- 4.1. GCC
- 4.2. South Africa
- 4.3. Rest of Middle East and Africa
-
5. South America
- 5.1. Brazil
- 5.2. Argentina
- 5.3. Rest of South America
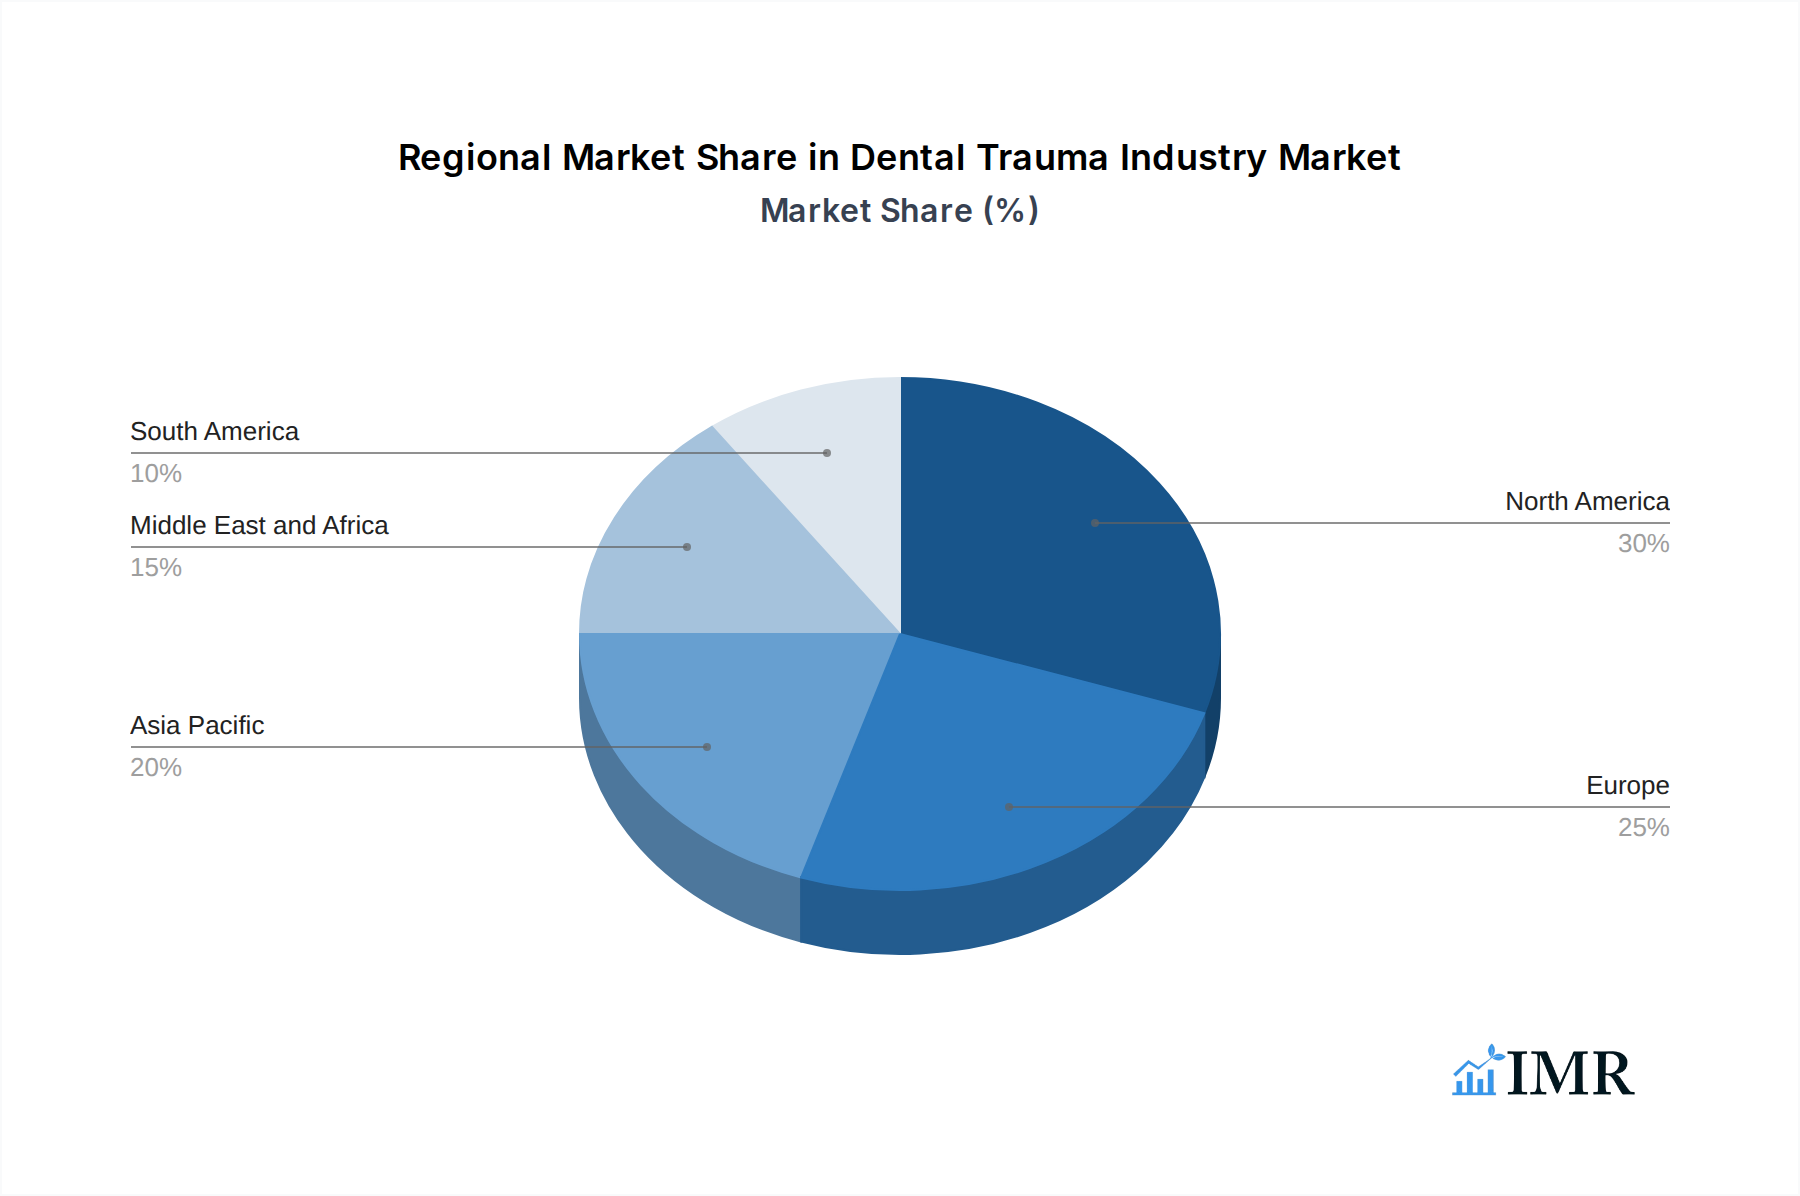
Dental Trauma Industry Regional Market Share
Geographic Coverage of Dental Trauma Industry
Dental Trauma Industry REPORT HIGHLIGHTS
| Aspects | Details |
|---|---|
| Study Period | 2020-2034 |
| Base Year | 2025 |
| Estimated Year | 2026 |
| Forecast Period | 2026-2034 |
| Historical Period | 2020-2025 |
| Growth Rate | CAGR of 9.03% from 2020-2034 |
| Segmentation |
|
Table of Contents
- 1. Introduction
- 1.1. Research Scope
- 1.2. Market Segmentation
- 1.3. Research Objective
- 1.4. Definitions and Assumptions
- 2. Executive Summary
- 2.1. Market Snapshot
- 3. Market Dynamics
- 3.1. Market Drivers
- 3.2. Market Restrains
- 3.3. Market Trends
- 3.4. Market Opportunities
- 4. Market Factor Analysis
- 4.1. Porters Five Forces
- 4.1.1. Bargaining Power of Suppliers
- 4.1.2. Bargaining Power of Buyers
- 4.1.3. Threat of New Entrants
- 4.1.4. Threat of Substitutes
- 4.1.5. Competitive Rivalry
- 4.2. PESTEL analysis
- 4.3. BCG Analysis
- 4.3.1. Stars (High Growth, High Market Share)
- 4.3.2. Cash Cows (Low Growth, High Market Share)
- 4.3.3. Question Mark (High Growth, Low Market Share)
- 4.3.4. Dogs (Low Growth, Low Market Share)
- 4.4. Ansoff Matrix Analysis
- 4.5. Supply Chain Analysis
- 4.6. Regulatory Landscape
- 4.7. Current Market Potential and Opportunity Assessment (TAM–SAM–SOM Framework)
- 4.8. IMR Analyst Note
- 4.1. Porters Five Forces
- 5. Market Analysis, Insights and Forecast 2021-2033
- 5.1. Market Analysis, Insights and Forecast - by Type
- 5.1.1. Absorbable
- 5.1.2. Non-absorbable
- 5.2. Market Analysis, Insights and Forecast - by Material
- 5.2.1. Synthetic Material
- 5.2.2. Natural Material
- 5.3. Market Analysis, Insights and Forecast - by Technique
- 5.3.1. Mattress Sutures
- 5.3.2. Crisscross Sutures
- 5.3.3. Interrupted Simple Sutures
- 5.3.4. Continuous Simple Sutures
- 5.4. Market Analysis, Insights and Forecast - by Region
- 5.4.1. North America
- 5.4.2. Europe
- 5.4.3. Asia Pacific
- 5.4.4. Middle East and Africa
- 5.4.5. South America
- 5.1. Market Analysis, Insights and Forecast - by Type
- 6. Global Dental Trauma Industry Analysis, Insights and Forecast, 2021-2033
- 6.1. Market Analysis, Insights and Forecast - by Type
- 6.1.1. Absorbable
- 6.1.2. Non-absorbable
- 6.2. Market Analysis, Insights and Forecast - by Material
- 6.2.1. Synthetic Material
- 6.2.2. Natural Material
- 6.3. Market Analysis, Insights and Forecast - by Technique
- 6.3.1. Mattress Sutures
- 6.3.2. Crisscross Sutures
- 6.3.3. Interrupted Simple Sutures
- 6.3.4. Continuous Simple Sutures
- 6.1. Market Analysis, Insights and Forecast - by Type
- 7. North America Dental Trauma Industry Analysis, Insights and Forecast, 2020-2032
- 7.1. Market Analysis, Insights and Forecast - by Type
- 7.1.1. Absorbable
- 7.1.2. Non-absorbable
- 7.2. Market Analysis, Insights and Forecast - by Material
- 7.2.1. Synthetic Material
- 7.2.2. Natural Material
- 7.3. Market Analysis, Insights and Forecast - by Technique
- 7.3.1. Mattress Sutures
- 7.3.2. Crisscross Sutures
- 7.3.3. Interrupted Simple Sutures
- 7.3.4. Continuous Simple Sutures
- 7.1. Market Analysis, Insights and Forecast - by Type
- 8. Europe Dental Trauma Industry Analysis, Insights and Forecast, 2020-2032
- 8.1. Market Analysis, Insights and Forecast - by Type
- 8.1.1. Absorbable
- 8.1.2. Non-absorbable
- 8.2. Market Analysis, Insights and Forecast - by Material
- 8.2.1. Synthetic Material
- 8.2.2. Natural Material
- 8.3. Market Analysis, Insights and Forecast - by Technique
- 8.3.1. Mattress Sutures
- 8.3.2. Crisscross Sutures
- 8.3.3. Interrupted Simple Sutures
- 8.3.4. Continuous Simple Sutures
- 8.1. Market Analysis, Insights and Forecast - by Type
- 9. Asia Pacific Dental Trauma Industry Analysis, Insights and Forecast, 2020-2032
- 9.1. Market Analysis, Insights and Forecast - by Type
- 9.1.1. Absorbable
- 9.1.2. Non-absorbable
- 9.2. Market Analysis, Insights and Forecast - by Material
- 9.2.1. Synthetic Material
- 9.2.2. Natural Material
- 9.3. Market Analysis, Insights and Forecast - by Technique
- 9.3.1. Mattress Sutures
- 9.3.2. Crisscross Sutures
- 9.3.3. Interrupted Simple Sutures
- 9.3.4. Continuous Simple Sutures
- 9.1. Market Analysis, Insights and Forecast - by Type
- 10. Middle East and Africa Dental Trauma Industry Analysis, Insights and Forecast, 2020-2032
- 10.1. Market Analysis, Insights and Forecast - by Type
- 10.1.1. Absorbable
- 10.1.2. Non-absorbable
- 10.2. Market Analysis, Insights and Forecast - by Material
- 10.2.1. Synthetic Material
- 10.2.2. Natural Material
- 10.3. Market Analysis, Insights and Forecast - by Technique
- 10.3.1. Mattress Sutures
- 10.3.2. Crisscross Sutures
- 10.3.3. Interrupted Simple Sutures
- 10.3.4. Continuous Simple Sutures
- 10.1. Market Analysis, Insights and Forecast - by Type
- 11. South America Dental Trauma Industry Analysis, Insights and Forecast, 2020-2032
- 11.1. Market Analysis, Insights and Forecast - by Type
- 11.1.1. Absorbable
- 11.1.2. Non-absorbable
- 11.2. Market Analysis, Insights and Forecast - by Material
- 11.2.1. Synthetic Material
- 11.2.2. Natural Material
- 11.3. Market Analysis, Insights and Forecast - by Technique
- 11.3.1. Mattress Sutures
- 11.3.2. Crisscross Sutures
- 11.3.3. Interrupted Simple Sutures
- 11.3.4. Continuous Simple Sutures
- 11.1. Market Analysis, Insights and Forecast - by Type
- 12. Competitive Analysis
- 12.1. Company Profiles
- 12.1.1 DemeTECH Corporation
- 12.1.1.1. Company Overview
- 12.1.1.2. Products
- 12.1.1.3. Company Financials
- 12.1.1.4. SWOT Analysis
- 12.1.2 Weigao Group
- 12.1.2.1. Company Overview
- 12.1.2.2. Products
- 12.1.2.3. Company Financials
- 12.1.2.4. SWOT Analysis
- 12.1.3 HYGITECH
- 12.1.3.1. Company Overview
- 12.1.3.2. Products
- 12.1.3.3. Company Financials
- 12.1.3.4. SWOT Analysis
- 12.1.4 Mani Inc
- 12.1.4.1. Company Overview
- 12.1.4.2. Products
- 12.1.4.3. Company Financials
- 12.1.4.4. SWOT Analysis
- 12.1.5 Theragenics (CP Medical)
- 12.1.5.1. Company Overview
- 12.1.5.2. Products
- 12.1.5.3. Company Financials
- 12.1.5.4. SWOT Analysis
- 12.1.6 Sutumed
- 12.1.6.1. Company Overview
- 12.1.6.2. Products
- 12.1.6.3. Company Financials
- 12.1.6.4. SWOT Analysis
- 12.1.7 SMI
- 12.1.7.1. Company Overview
- 12.1.7.2. Products
- 12.1.7.3. Company Financials
- 12.1.7.4. SWOT Analysis
- 12.1.8 Osteogenics Biomedical
- 12.1.8.1. Company Overview
- 12.1.8.2. Products
- 12.1.8.3. Company Financials
- 12.1.8.4. SWOT Analysis
- 12.1.9 Lux Sutures
- 12.1.9.1. Company Overview
- 12.1.9.2. Products
- 12.1.9.3. Company Financials
- 12.1.9.4. SWOT Analysis
- 12.1.10 Katsan Medical Devices
- 12.1.10.1. Company Overview
- 12.1.10.2. Products
- 12.1.10.3. Company Financials
- 12.1.10.4. SWOT Analysis
- 12.1.1 DemeTECH Corporation
- 12.2. Market Entropy
- 12.2.1 Company's Key Areas Served
- 12.2.2 Recent Developments
- 12.3. Company Market Share Analysis 2025
- 12.3.1 Top 5 Companies Market Share Analysis
- 12.3.2 Top 3 Companies Market Share Analysis
- 12.4. List of Potential Customers
- 13. Research Methodology
List of Figures
- Figure 1: Global Dental Trauma Industry Revenue Breakdown (billion, %) by Region 2025 & 2033
- Figure 2: Global Dental Trauma Industry Volume Breakdown (K Units, %) by Region 2025 & 2033
- Figure 3: North America Dental Trauma Industry Revenue (billion), by Type 2025 & 2033
- Figure 4: North America Dental Trauma Industry Volume (K Units), by Type 2025 & 2033
- Figure 5: North America Dental Trauma Industry Revenue Share (%), by Type 2025 & 2033
- Figure 6: North America Dental Trauma Industry Volume Share (%), by Type 2025 & 2033
- Figure 7: North America Dental Trauma Industry Revenue (billion), by Material 2025 & 2033
- Figure 8: North America Dental Trauma Industry Volume (K Units), by Material 2025 & 2033
- Figure 9: North America Dental Trauma Industry Revenue Share (%), by Material 2025 & 2033
- Figure 10: North America Dental Trauma Industry Volume Share (%), by Material 2025 & 2033
- Figure 11: North America Dental Trauma Industry Revenue (billion), by Technique 2025 & 2033
- Figure 12: North America Dental Trauma Industry Volume (K Units), by Technique 2025 & 2033
- Figure 13: North America Dental Trauma Industry Revenue Share (%), by Technique 2025 & 2033
- Figure 14: North America Dental Trauma Industry Volume Share (%), by Technique 2025 & 2033
- Figure 15: North America Dental Trauma Industry Revenue (billion), by Country 2025 & 2033
- Figure 16: North America Dental Trauma Industry Volume (K Units), by Country 2025 & 2033
- Figure 17: North America Dental Trauma Industry Revenue Share (%), by Country 2025 & 2033
- Figure 18: North America Dental Trauma Industry Volume Share (%), by Country 2025 & 2033
- Figure 19: Europe Dental Trauma Industry Revenue (billion), by Type 2025 & 2033
- Figure 20: Europe Dental Trauma Industry Volume (K Units), by Type 2025 & 2033
- Figure 21: Europe Dental Trauma Industry Revenue Share (%), by Type 2025 & 2033
- Figure 22: Europe Dental Trauma Industry Volume Share (%), by Type 2025 & 2033
- Figure 23: Europe Dental Trauma Industry Revenue (billion), by Material 2025 & 2033
- Figure 24: Europe Dental Trauma Industry Volume (K Units), by Material 2025 & 2033
- Figure 25: Europe Dental Trauma Industry Revenue Share (%), by Material 2025 & 2033
- Figure 26: Europe Dental Trauma Industry Volume Share (%), by Material 2025 & 2033
- Figure 27: Europe Dental Trauma Industry Revenue (billion), by Technique 2025 & 2033
- Figure 28: Europe Dental Trauma Industry Volume (K Units), by Technique 2025 & 2033
- Figure 29: Europe Dental Trauma Industry Revenue Share (%), by Technique 2025 & 2033
- Figure 30: Europe Dental Trauma Industry Volume Share (%), by Technique 2025 & 2033
- Figure 31: Europe Dental Trauma Industry Revenue (billion), by Country 2025 & 2033
- Figure 32: Europe Dental Trauma Industry Volume (K Units), by Country 2025 & 2033
- Figure 33: Europe Dental Trauma Industry Revenue Share (%), by Country 2025 & 2033
- Figure 34: Europe Dental Trauma Industry Volume Share (%), by Country 2025 & 2033
- Figure 35: Asia Pacific Dental Trauma Industry Revenue (billion), by Type 2025 & 2033
- Figure 36: Asia Pacific Dental Trauma Industry Volume (K Units), by Type 2025 & 2033
- Figure 37: Asia Pacific Dental Trauma Industry Revenue Share (%), by Type 2025 & 2033
- Figure 38: Asia Pacific Dental Trauma Industry Volume Share (%), by Type 2025 & 2033
- Figure 39: Asia Pacific Dental Trauma Industry Revenue (billion), by Material 2025 & 2033
- Figure 40: Asia Pacific Dental Trauma Industry Volume (K Units), by Material 2025 & 2033
- Figure 41: Asia Pacific Dental Trauma Industry Revenue Share (%), by Material 2025 & 2033
- Figure 42: Asia Pacific Dental Trauma Industry Volume Share (%), by Material 2025 & 2033
- Figure 43: Asia Pacific Dental Trauma Industry Revenue (billion), by Technique 2025 & 2033
- Figure 44: Asia Pacific Dental Trauma Industry Volume (K Units), by Technique 2025 & 2033
- Figure 45: Asia Pacific Dental Trauma Industry Revenue Share (%), by Technique 2025 & 2033
- Figure 46: Asia Pacific Dental Trauma Industry Volume Share (%), by Technique 2025 & 2033
- Figure 47: Asia Pacific Dental Trauma Industry Revenue (billion), by Country 2025 & 2033
- Figure 48: Asia Pacific Dental Trauma Industry Volume (K Units), by Country 2025 & 2033
- Figure 49: Asia Pacific Dental Trauma Industry Revenue Share (%), by Country 2025 & 2033
- Figure 50: Asia Pacific Dental Trauma Industry Volume Share (%), by Country 2025 & 2033
- Figure 51: Middle East and Africa Dental Trauma Industry Revenue (billion), by Type 2025 & 2033
- Figure 52: Middle East and Africa Dental Trauma Industry Volume (K Units), by Type 2025 & 2033
- Figure 53: Middle East and Africa Dental Trauma Industry Revenue Share (%), by Type 2025 & 2033
- Figure 54: Middle East and Africa Dental Trauma Industry Volume Share (%), by Type 2025 & 2033
- Figure 55: Middle East and Africa Dental Trauma Industry Revenue (billion), by Material 2025 & 2033
- Figure 56: Middle East and Africa Dental Trauma Industry Volume (K Units), by Material 2025 & 2033
- Figure 57: Middle East and Africa Dental Trauma Industry Revenue Share (%), by Material 2025 & 2033
- Figure 58: Middle East and Africa Dental Trauma Industry Volume Share (%), by Material 2025 & 2033
- Figure 59: Middle East and Africa Dental Trauma Industry Revenue (billion), by Technique 2025 & 2033
- Figure 60: Middle East and Africa Dental Trauma Industry Volume (K Units), by Technique 2025 & 2033
- Figure 61: Middle East and Africa Dental Trauma Industry Revenue Share (%), by Technique 2025 & 2033
- Figure 62: Middle East and Africa Dental Trauma Industry Volume Share (%), by Technique 2025 & 2033
- Figure 63: Middle East and Africa Dental Trauma Industry Revenue (billion), by Country 2025 & 2033
- Figure 64: Middle East and Africa Dental Trauma Industry Volume (K Units), by Country 2025 & 2033
- Figure 65: Middle East and Africa Dental Trauma Industry Revenue Share (%), by Country 2025 & 2033
- Figure 66: Middle East and Africa Dental Trauma Industry Volume Share (%), by Country 2025 & 2033
- Figure 67: South America Dental Trauma Industry Revenue (billion), by Type 2025 & 2033
- Figure 68: South America Dental Trauma Industry Volume (K Units), by Type 2025 & 2033
- Figure 69: South America Dental Trauma Industry Revenue Share (%), by Type 2025 & 2033
- Figure 70: South America Dental Trauma Industry Volume Share (%), by Type 2025 & 2033
- Figure 71: South America Dental Trauma Industry Revenue (billion), by Material 2025 & 2033
- Figure 72: South America Dental Trauma Industry Volume (K Units), by Material 2025 & 2033
- Figure 73: South America Dental Trauma Industry Revenue Share (%), by Material 2025 & 2033
- Figure 74: South America Dental Trauma Industry Volume Share (%), by Material 2025 & 2033
- Figure 75: South America Dental Trauma Industry Revenue (billion), by Technique 2025 & 2033
- Figure 76: South America Dental Trauma Industry Volume (K Units), by Technique 2025 & 2033
- Figure 77: South America Dental Trauma Industry Revenue Share (%), by Technique 2025 & 2033
- Figure 78: South America Dental Trauma Industry Volume Share (%), by Technique 2025 & 2033
- Figure 79: South America Dental Trauma Industry Revenue (billion), by Country 2025 & 2033
- Figure 80: South America Dental Trauma Industry Volume (K Units), by Country 2025 & 2033
- Figure 81: South America Dental Trauma Industry Revenue Share (%), by Country 2025 & 2033
- Figure 82: South America Dental Trauma Industry Volume Share (%), by Country 2025 & 2033
List of Tables
- Table 1: Global Dental Trauma Industry Revenue billion Forecast, by Type 2020 & 2033
- Table 2: Global Dental Trauma Industry Volume K Units Forecast, by Type 2020 & 2033
- Table 3: Global Dental Trauma Industry Revenue billion Forecast, by Material 2020 & 2033
- Table 4: Global Dental Trauma Industry Volume K Units Forecast, by Material 2020 & 2033
- Table 5: Global Dental Trauma Industry Revenue billion Forecast, by Technique 2020 & 2033
- Table 6: Global Dental Trauma Industry Volume K Units Forecast, by Technique 2020 & 2033
- Table 7: Global Dental Trauma Industry Revenue billion Forecast, by Region 2020 & 2033
- Table 8: Global Dental Trauma Industry Volume K Units Forecast, by Region 2020 & 2033
- Table 9: Global Dental Trauma Industry Revenue billion Forecast, by Type 2020 & 2033
- Table 10: Global Dental Trauma Industry Volume K Units Forecast, by Type 2020 & 2033
- Table 11: Global Dental Trauma Industry Revenue billion Forecast, by Material 2020 & 2033
- Table 12: Global Dental Trauma Industry Volume K Units Forecast, by Material 2020 & 2033
- Table 13: Global Dental Trauma Industry Revenue billion Forecast, by Technique 2020 & 2033
- Table 14: Global Dental Trauma Industry Volume K Units Forecast, by Technique 2020 & 2033
- Table 15: Global Dental Trauma Industry Revenue billion Forecast, by Country 2020 & 2033
- Table 16: Global Dental Trauma Industry Volume K Units Forecast, by Country 2020 & 2033
- Table 17: United States Dental Trauma Industry Revenue (billion) Forecast, by Application 2020 & 2033
- Table 18: United States Dental Trauma Industry Volume (K Units) Forecast, by Application 2020 & 2033
- Table 19: Canada Dental Trauma Industry Revenue (billion) Forecast, by Application 2020 & 2033
- Table 20: Canada Dental Trauma Industry Volume (K Units) Forecast, by Application 2020 & 2033
- Table 21: Mexico Dental Trauma Industry Revenue (billion) Forecast, by Application 2020 & 2033
- Table 22: Mexico Dental Trauma Industry Volume (K Units) Forecast, by Application 2020 & 2033
- Table 23: Global Dental Trauma Industry Revenue billion Forecast, by Type 2020 & 2033
- Table 24: Global Dental Trauma Industry Volume K Units Forecast, by Type 2020 & 2033
- Table 25: Global Dental Trauma Industry Revenue billion Forecast, by Material 2020 & 2033
- Table 26: Global Dental Trauma Industry Volume K Units Forecast, by Material 2020 & 2033
- Table 27: Global Dental Trauma Industry Revenue billion Forecast, by Technique 2020 & 2033
- Table 28: Global Dental Trauma Industry Volume K Units Forecast, by Technique 2020 & 2033
- Table 29: Global Dental Trauma Industry Revenue billion Forecast, by Country 2020 & 2033
- Table 30: Global Dental Trauma Industry Volume K Units Forecast, by Country 2020 & 2033
- Table 31: United Kingdom Dental Trauma Industry Revenue (billion) Forecast, by Application 2020 & 2033
- Table 32: United Kingdom Dental Trauma Industry Volume (K Units) Forecast, by Application 2020 & 2033
- Table 33: France Dental Trauma Industry Revenue (billion) Forecast, by Application 2020 & 2033
- Table 34: France Dental Trauma Industry Volume (K Units) Forecast, by Application 2020 & 2033
- Table 35: Germany Dental Trauma Industry Revenue (billion) Forecast, by Application 2020 & 2033
- Table 36: Germany Dental Trauma Industry Volume (K Units) Forecast, by Application 2020 & 2033
- Table 37: Italy Dental Trauma Industry Revenue (billion) Forecast, by Application 2020 & 2033
- Table 38: Italy Dental Trauma Industry Volume (K Units) Forecast, by Application 2020 & 2033
- Table 39: Spain Dental Trauma Industry Revenue (billion) Forecast, by Application 2020 & 2033
- Table 40: Spain Dental Trauma Industry Volume (K Units) Forecast, by Application 2020 & 2033
- Table 41: Rest of Europe Dental Trauma Industry Revenue (billion) Forecast, by Application 2020 & 2033
- Table 42: Rest of Europe Dental Trauma Industry Volume (K Units) Forecast, by Application 2020 & 2033
- Table 43: Global Dental Trauma Industry Revenue billion Forecast, by Type 2020 & 2033
- Table 44: Global Dental Trauma Industry Volume K Units Forecast, by Type 2020 & 2033
- Table 45: Global Dental Trauma Industry Revenue billion Forecast, by Material 2020 & 2033
- Table 46: Global Dental Trauma Industry Volume K Units Forecast, by Material 2020 & 2033
- Table 47: Global Dental Trauma Industry Revenue billion Forecast, by Technique 2020 & 2033
- Table 48: Global Dental Trauma Industry Volume K Units Forecast, by Technique 2020 & 2033
- Table 49: Global Dental Trauma Industry Revenue billion Forecast, by Country 2020 & 2033
- Table 50: Global Dental Trauma Industry Volume K Units Forecast, by Country 2020 & 2033
- Table 51: India Dental Trauma Industry Revenue (billion) Forecast, by Application 2020 & 2033
- Table 52: India Dental Trauma Industry Volume (K Units) Forecast, by Application 2020 & 2033
- Table 53: China Dental Trauma Industry Revenue (billion) Forecast, by Application 2020 & 2033
- Table 54: China Dental Trauma Industry Volume (K Units) Forecast, by Application 2020 & 2033
- Table 55: Japan Dental Trauma Industry Revenue (billion) Forecast, by Application 2020 & 2033
- Table 56: Japan Dental Trauma Industry Volume (K Units) Forecast, by Application 2020 & 2033
- Table 57: Australia Dental Trauma Industry Revenue (billion) Forecast, by Application 2020 & 2033
- Table 58: Australia Dental Trauma Industry Volume (K Units) Forecast, by Application 2020 & 2033
- Table 59: South Korea Dental Trauma Industry Revenue (billion) Forecast, by Application 2020 & 2033
- Table 60: South Korea Dental Trauma Industry Volume (K Units) Forecast, by Application 2020 & 2033
- Table 61: Rest of Asia Pacific Dental Trauma Industry Revenue (billion) Forecast, by Application 2020 & 2033
- Table 62: Rest of Asia Pacific Dental Trauma Industry Volume (K Units) Forecast, by Application 2020 & 2033
- Table 63: Global Dental Trauma Industry Revenue billion Forecast, by Type 2020 & 2033
- Table 64: Global Dental Trauma Industry Volume K Units Forecast, by Type 2020 & 2033
- Table 65: Global Dental Trauma Industry Revenue billion Forecast, by Material 2020 & 2033
- Table 66: Global Dental Trauma Industry Volume K Units Forecast, by Material 2020 & 2033
- Table 67: Global Dental Trauma Industry Revenue billion Forecast, by Technique 2020 & 2033
- Table 68: Global Dental Trauma Industry Volume K Units Forecast, by Technique 2020 & 2033
- Table 69: Global Dental Trauma Industry Revenue billion Forecast, by Country 2020 & 2033
- Table 70: Global Dental Trauma Industry Volume K Units Forecast, by Country 2020 & 2033
- Table 71: GCC Dental Trauma Industry Revenue (billion) Forecast, by Application 2020 & 2033
- Table 72: GCC Dental Trauma Industry Volume (K Units) Forecast, by Application 2020 & 2033
- Table 73: South Africa Dental Trauma Industry Revenue (billion) Forecast, by Application 2020 & 2033
- Table 74: South Africa Dental Trauma Industry Volume (K Units) Forecast, by Application 2020 & 2033
- Table 75: Rest of Middle East and Africa Dental Trauma Industry Revenue (billion) Forecast, by Application 2020 & 2033
- Table 76: Rest of Middle East and Africa Dental Trauma Industry Volume (K Units) Forecast, by Application 2020 & 2033
- Table 77: Global Dental Trauma Industry Revenue billion Forecast, by Type 2020 & 2033
- Table 78: Global Dental Trauma Industry Volume K Units Forecast, by Type 2020 & 2033
- Table 79: Global Dental Trauma Industry Revenue billion Forecast, by Material 2020 & 2033
- Table 80: Global Dental Trauma Industry Volume K Units Forecast, by Material 2020 & 2033
- Table 81: Global Dental Trauma Industry Revenue billion Forecast, by Technique 2020 & 2033
- Table 82: Global Dental Trauma Industry Volume K Units Forecast, by Technique 2020 & 2033
- Table 83: Global Dental Trauma Industry Revenue billion Forecast, by Country 2020 & 2033
- Table 84: Global Dental Trauma Industry Volume K Units Forecast, by Country 2020 & 2033
- Table 85: Brazil Dental Trauma Industry Revenue (billion) Forecast, by Application 2020 & 2033
- Table 86: Brazil Dental Trauma Industry Volume (K Units) Forecast, by Application 2020 & 2033
- Table 87: Argentina Dental Trauma Industry Revenue (billion) Forecast, by Application 2020 & 2033
- Table 88: Argentina Dental Trauma Industry Volume (K Units) Forecast, by Application 2020 & 2033
- Table 89: Rest of South America Dental Trauma Industry Revenue (billion) Forecast, by Application 2020 & 2033
- Table 90: Rest of South America Dental Trauma Industry Volume (K Units) Forecast, by Application 2020 & 2033
Frequently Asked Questions
1. What is the projected Compound Annual Growth Rate (CAGR) of the Dental Trauma Industry?
The projected CAGR is approximately 9.03%.
2. Which companies are prominent players in the Dental Trauma Industry?
Key companies in the market include DemeTECH Corporation, Weigao Group, HYGITECH, Mani Inc, Theragenics (CP Medical), Sutumed, SMI, Osteogenics Biomedical, Lux Sutures, Katsan Medical Devices.
3. What are the main segments of the Dental Trauma Industry?
The market segments include Type, Material, Technique.
4. Can you provide details about the market size?
The market size is estimated to be USD 6.55 billion as of 2022.
5. What are some drivers contributing to market growth?
Increase in demand for Cosmetic Dentistry and Dental Procedures; Increasing prevalence of Dental Disorders; Increasing Dental Tourism in Emerging Countries.
6. What are the notable trends driving market growth?
Synthetic Material Segment is Expected to Grow Over the Forecast Period.
7. Are there any restraints impacting market growth?
Excessive Cost and Limited Reimbursement for Dental Procedures.
8. Can you provide examples of recent developments in the market?
In May 2022, Medical Microinstruments (MMI) SpA, a robotics company dedicated to improving clinical outcomes for patients undergoing microsurgery, today announced the launch of its Symani Surgical System Simulator developed by VirtaMed.
9. What pricing options are available for accessing the report?
Pricing options include single-user, multi-user, and enterprise licenses priced at USD 4750, USD 5250, and USD 8750 respectively.
10. Is the market size provided in terms of value or volume?
The market size is provided in terms of value, measured in billion and volume, measured in K Units.
11. Are there any specific market keywords associated with the report?
Yes, the market keyword associated with the report is "Dental Trauma Industry," which aids in identifying and referencing the specific market segment covered.
12. How do I determine which pricing option suits my needs best?
The pricing options vary based on user requirements and access needs. Individual users may opt for single-user licenses, while businesses requiring broader access may choose multi-user or enterprise licenses for cost-effective access to the report.
13. Are there any additional resources or data provided in the Dental Trauma Industry report?
While the report offers comprehensive insights, it's advisable to review the specific contents or supplementary materials provided to ascertain if additional resources or data are available.
14. How can I stay updated on further developments or reports in the Dental Trauma Industry?
To stay informed about further developments, trends, and reports in the Dental Trauma Industry, consider subscribing to industry newsletters, following relevant companies and organizations, or regularly checking reputable industry news sources and publications.
Methodology
Step 1 - Identification of Relevant Samples Size from Population Database


Step 2 - Approaches for Defining Global Market Size (Value, Volume* & Price*)

Note*: In applicable scenarios
Step 3 - Data Sources
Primary Research
- Web Analytics
- Survey Reports
- Research Institute
- Latest Research Reports
- Opinion Leaders
Secondary Research
- Annual Reports
- White Paper
- Latest Press Release
- Industry Association
- Paid Database
- Investor Presentations

Step 4 - Data Triangulation
Involves using different sources of information in order to increase the validity of a study
These sources are likely to be stakeholders in a program - participants, other researchers, program staff, other community members, and so on.
Then we put all data in single framework & apply various statistical tools to find out the dynamic on the market.
During the analysis stage, feedback from the stakeholder groups would be compared to determine areas of agreement as well as areas of divergence