

Key Insights
The global chemical software market is experiencing robust growth, projected to reach a significant USD 6.10 Million in 2025. This expansion is fueled by an impressive Compound Annual Growth Rate (CAGR) of 15.50%, indicating a dynamic and evolving landscape. Key drivers include the accelerating pace of drug discovery and validation, where sophisticated software solutions are indispensable for identifying promising drug candidates, optimizing molecular structures, and predicting efficacy and toxicity. Furthermore, the increasing adoption of virtual screening techniques, enabled by advanced computational tools, is revolutionizing the early stages of drug development by rapidly sifting through vast chemical libraries. In the realm of chemical analysis, advancements in chemometrics and molecular modeling are enhancing the precision and efficiency of data interpretation and prediction, leading to more informed research and development decisions. The market is also witnessing a surge in demand for integrated platforms that offer comprehensive solutions for chemical databases, computational chemistry, and scientific workflows, thereby streamlining research processes and accelerating innovation across various industries.
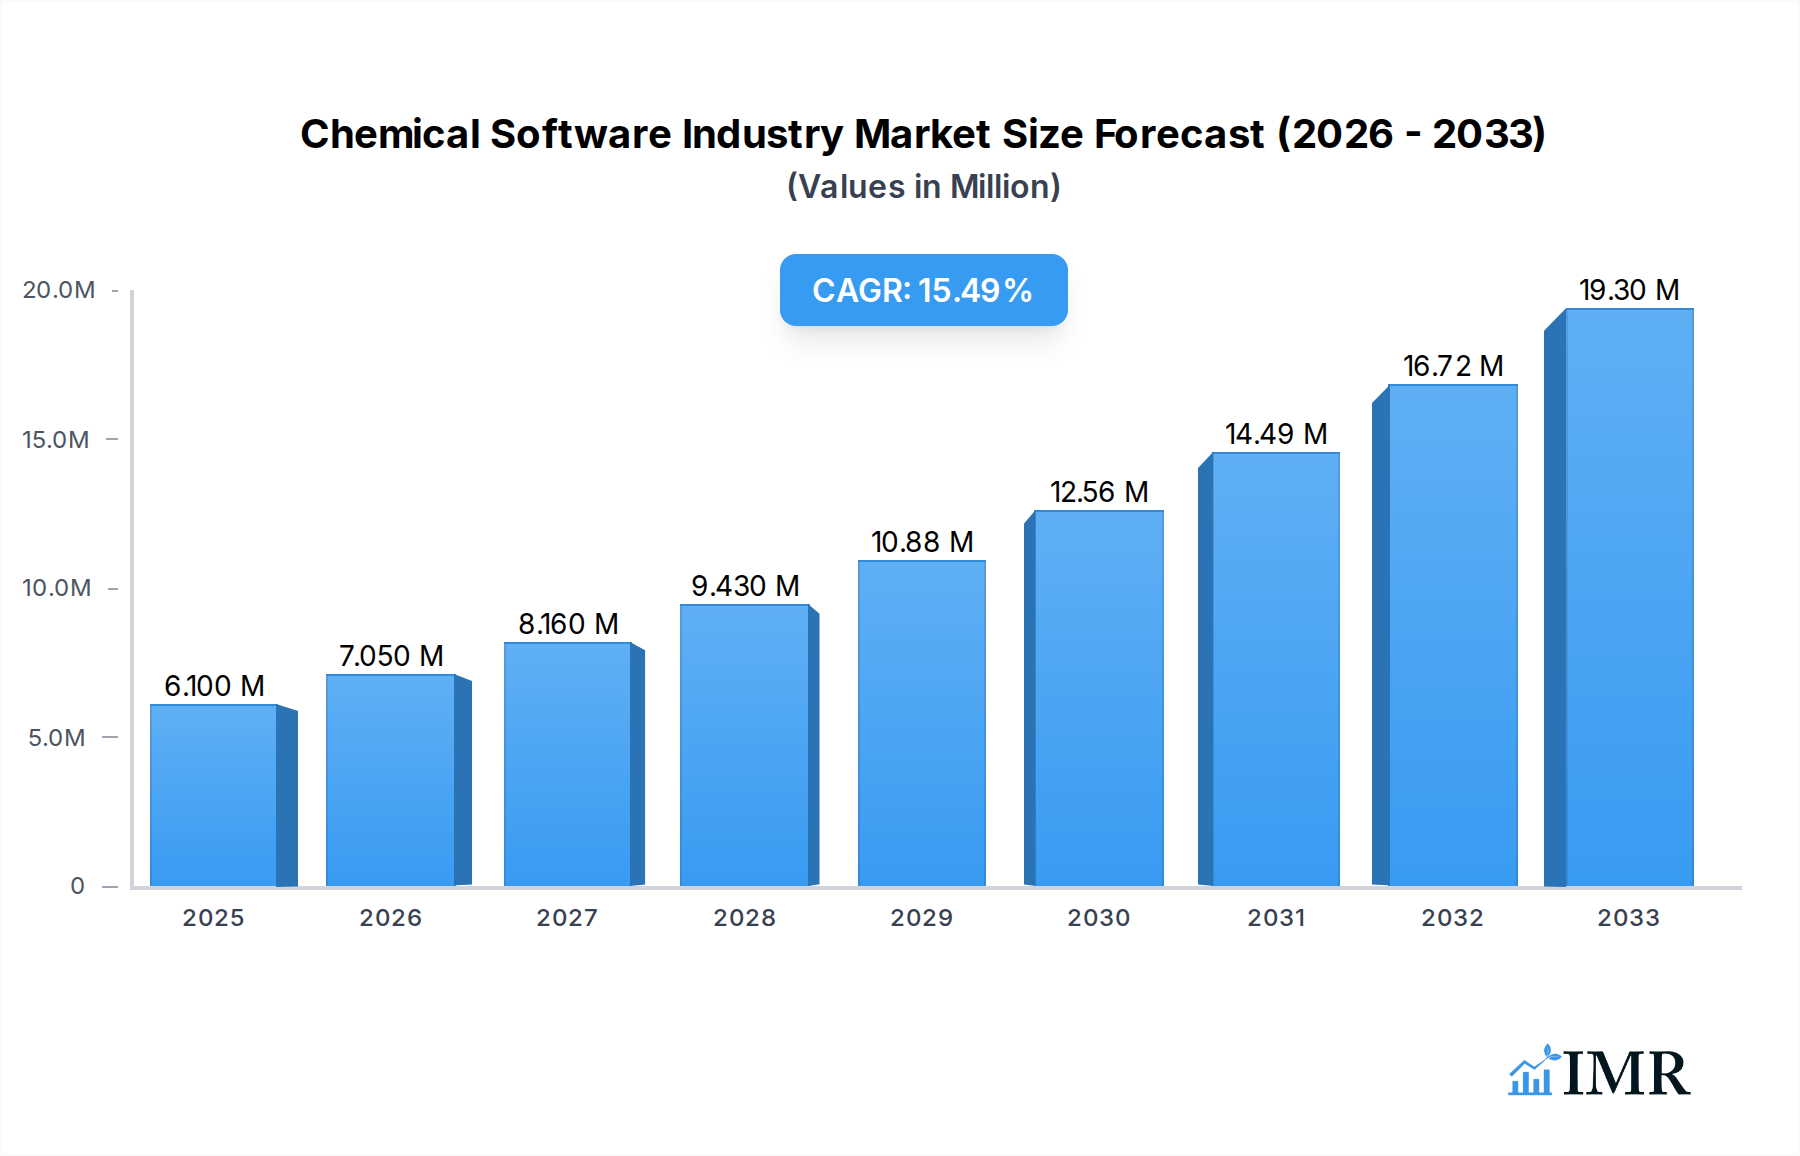
Chemical Software Industry Market Size (In Million)
The chemical software market is poised for substantial growth, driven by strategic investments in research and development and the increasing need for sophisticated analytical and predictive tools. While the market benefits from strong demand in applications like chemical analysis, drug discovery, and virtual screening, it is also influenced by evolving trends such as the rise of artificial intelligence (AI) and machine learning (ML) in chemical research, leading to more intelligent and predictive software. The integration of cloud-based solutions is also a significant trend, offering enhanced accessibility, scalability, and collaborative capabilities for researchers worldwide. However, the market faces certain restraints, including the high cost of implementing and maintaining advanced software systems, the need for specialized expertise to operate these tools effectively, and data security concerns associated with sensitive research information. Despite these challenges, the continuous pursuit of novel materials, advanced pharmaceuticals, and more efficient chemical processes, coupled with the expanding reach of digital transformation in scientific R&D, underscores the bright future and significant opportunities within the chemical software industry.

Chemical Software Industry Company Market Share
Chemical Software Industry: Comprehensive Market Analysis and Future Outlook (2019-2033)
Unlock critical insights into the dynamic global Chemical Software market. This in-depth report provides a panoramic view of market size, growth trajectories, technological advancements, and competitive landscapes from 2019 to 2033. Essential for stakeholders in drug discovery, chemical analysis, and R&D, this report leverages high-traffic keywords like "chemical informatics software," "drug discovery platforms," "molecular modeling software," "cheminformatics solutions," and "virtual screening tools" to ensure maximum visibility and impact. Understand the interplay between parent and child markets, with detailed segmentation and regional analysis, making informed decisions for strategic planning and investment.
Chemical Software Industry Market Dynamics & Structure
The chemical software industry exhibits a moderately concentrated market structure, characterized by a blend of established multinational corporations and agile niche players. Technological innovation remains the primary driver, fueled by advancements in artificial intelligence (AI), machine learning (ML), and high-performance computing (HPC), which are revolutionizing areas like drug discovery and materials science. Regulatory frameworks, particularly those governing pharmaceutical development and chemical safety, indirectly influence software adoption by mandating data integrity and validation. Competitive product substitutes are minimal within core functionalities, but inter-operability and integration with broader laboratory information management systems (LIMS) present evolving competitive avenues. End-user demographics are increasingly diverse, encompassing pharmaceutical and biotechnology companies, academic research institutions, contract research organizations (CROs), and chemical manufacturers. Mergers and acquisitions (M&A) are a significant trend, with larger entities acquiring innovative startups to bolster their portfolios and expand market reach. For instance, the acquisition of OpenEye Scientific Software Inc. by Cadence Design Systems Inc. signifies a consolidation trend aimed at offering integrated design and simulation solutions.
- Market Concentration: Dominated by a few key players alongside a growing number of specialized providers.
- Technological Innovation Drivers: AI/ML for predictive modeling, quantum computing for complex simulations, cloud-based platforms for collaboration.
- Regulatory Frameworks: FDA, EMA guidelines on data integrity, REACH compliance, intellectual property protection.
- Competitive Product Substitutes: Limited for core functionalities, but integration and workflow solutions offer competitive differentiation.
- End-User Demographics: Pharmaceutical & Biotech (XX% of market), Academia (XX%), CROs (XX%), Chemical Manufacturers (XX%).
- M&A Trends: Strategic acquisitions to integrate advanced capabilities and expand service offerings. Expected deal volume for the forecast period: XX transactions per year.
Chemical Software Industry Growth Trends & Insights
The global Chemical Software market is poised for robust expansion, projected to grow at a Compound Annual Growth Rate (CAGR) of approximately XX% from 2025 to 2033. This impressive growth is underpinned by a confluence of factors, including the escalating demand for accelerated drug discovery and development cycles, increasing investments in R&D across the pharmaceutical and chemical sectors, and the pervasive integration of advanced computational tools in scientific research. The market size, estimated at USD XX Million in 2025, is expected to reach USD XX Million by 2033. Adoption rates for sophisticated chemical informatics and molecular modeling software are steadily rising as researchers recognize their capacity to reduce experimental costs and time, and to uncover novel insights that would be intractable through traditional methods.
Technological disruptions are at the forefront of market evolution. The increasing sophistication of AI and ML algorithms is enabling predictive toxicology, virtual screening at unprecedented scales, and de novo drug design, fundamentally reshaping R&D paradigms. Furthermore, the shift towards cloud-based solutions is enhancing accessibility, collaboration, and scalability, allowing smaller research groups and companies to leverage powerful computational resources. Consumer behavior is also shifting; researchers are increasingly seeking integrated platforms that offer seamless workflows from data acquisition and analysis to visualization and reporting. The parent market of scientific software is experiencing substantial growth, with the child market of chemical software carving out a significant and rapidly expanding segment.
- Market Size Evolution: Projected to grow from USD XX Million (2025) to USD XX Million (2033).
- CAGR (2025-2033): Approximately XX%.
- Adoption Rates: Increasing adoption of cheminformatics, molecular modeling, and AI-driven drug discovery tools.
- Technological Disruptions: AI/ML in predictive analytics, quantum computing for molecular simulations, cloud integration.
- Consumer Behavior Shifts: Demand for integrated workflows, collaborative platforms, and user-friendly interfaces.
- Parent & Child Market Dynamics: The broader scientific software market provides a fertile ground for the specialized chemical software segment's growth.
Dominant Regions, Countries, or Segments in Chemical Software Industry
The Drug Discovery and Validation segment stands out as the dominant force driving growth within the global Chemical Software industry. This segment, valued at an estimated USD XX Million in 2025, is projected to witness a CAGR of XX% during the forecast period. The escalating demand for novel therapeutics to address unmet medical needs, coupled with significant global investments in pharmaceutical R&D, directly fuels the adoption of advanced chemical software solutions. Key drivers for this dominance include:
- Pharmaceutical R&D Investment: Global pharmaceutical R&D expenditure, projected to reach USD XX Billion by 2025, directly translates into increased demand for sophisticated computational tools for target identification, lead optimization, and preclinical testing.
- Biotechnology Sector Growth: The burgeoning biotechnology sector, with its focus on precision medicine and novel biologics, increasingly relies on cheminformatics and molecular modeling for designing and validating complex molecular entities.
- Emergence of AI in Drug Discovery: The integration of AI and ML in drug discovery, exemplified by initiatives like the one announced by Vox Biomedical for AI-based chemical identification, is accelerating the identification of potential drug candidates and reducing failure rates.
- Regulatory Push for Efficiency: Stringent regulatory requirements for drug approval necessitate efficient and data-driven discovery processes, which chemical software effectively supports.
Within the Chemical Analysis segment, Molecular Modelling is a key sub-segment, contributing significantly to the overall market. Its market share is estimated at XX% of the Chemical Analysis segment in 2025. The ability to simulate molecular behavior, predict properties, and design novel materials makes it indispensable for both academic and industrial research.
- Molecular Modelling Dominance: Crucial for predicting molecular interactions, designing new materials, and understanding reaction mechanisms. Market share within Chemical Analysis: XX%.
- Geographical Dominance: North America currently leads the chemical software market, primarily driven by its robust pharmaceutical industry and substantial R&D investments. Europe follows closely, with strong contributions from academic research and established chemical conglomerates. Asia-Pacific is the fastest-growing region, fueled by increasing investments in R&D and a burgeoning pharmaceutical sector.
Chemical Software Industry Product Landscape
The chemical software product landscape is characterized by continuous innovation, offering advanced functionalities for diverse scientific applications. Key products include sophisticated cheminformatics platforms for managing, analyzing, and visualizing chemical data, and powerful molecular modeling suites that enable the simulation of molecular structures and interactions. Virtual screening tools are revolutionizing drug discovery by enabling high-throughput computational screening of large compound libraries. Recent advancements include the integration of AI/ML algorithms for predictive modeling, enhancing the accuracy and speed of research. Performance metrics are often measured by computational speed, accuracy of predictions, and the breadth of supported chemical structures and reactions. Unique selling propositions often lie in user-friendliness, scalability, and seamless integration with existing laboratory workflows.
Key Drivers, Barriers & Challenges in Chemical Software Industry
Key Drivers: The primary forces propelling the chemical software industry include the relentless pursuit of novel drug discovery and development, the increasing complexity of chemical research demanding advanced computational tools, and the growing adoption of AI and machine learning to accelerate R&D processes. Government initiatives supporting scientific research and innovation, along with rising investments in the biotechnology and pharmaceutical sectors, further act as significant catalysts.
- Technological Drivers: AI/ML integration, high-performance computing, cloud-based solutions.
- Economic Drivers: Increased R&D spending in pharma/biotech, demand for cost-effective research solutions.
- Policy-Driven Factors: Government funding for research, intellectual property protection.
Key Barriers & Challenges: Despite strong growth, the industry faces challenges. High implementation costs and the need for specialized expertise can be significant barriers to adoption for smaller organizations. The vast amounts of data generated can lead to data management and integration complexities. Moreover, the evolving nature of scientific research necessitates continuous software updates and adaptation, posing a challenge for both developers and users. Cybersecurity threats and data privacy concerns are also increasingly critical.
- Supply Chain Issues: Not directly applicable to software, but dependency on hardware infrastructure can be a factor.
- Regulatory Hurdles: Ensuring compliance with data integrity and validation standards in regulated industries.
- Competitive Pressures: Intense competition driving innovation and price sensitivity.
- Expertise Gap: Requirement for skilled personnel to effectively utilize advanced software.
Emerging Opportunities in Chemical Software Industry
Emerging opportunities in the chemical software industry are abundant, driven by evolving scientific frontiers and technological advancements. The development of AI-powered tools for de novo drug design and predictive toxicology presents a significant growth avenue. The increasing focus on sustainable chemistry and green materials opens up opportunities for specialized software solutions that can model and optimize eco-friendly processes. Furthermore, the expansion of personalized medicine necessitates more sophisticated computational tools for analyzing genomic and proteomic data alongside chemical structures. The integration of blockchain technology for secure data management and intellectual property protection in R&D is another promising area.
Growth Accelerators in the Chemical Software Industry Industry
Several key catalysts are accelerating the long-term growth of the chemical software industry. Breakthroughs in artificial intelligence and machine learning are enabling unprecedented predictive capabilities, dramatically reducing R&D timelines and costs. Strategic partnerships and collaborations between software providers and leading pharmaceutical and chemical companies are fostering innovation and accelerating market penetration. The increasing demand for cloud-based and Software-as-a-Service (SaaS) models is expanding accessibility and enabling scalability, making advanced computational tools available to a broader range of researchers. Furthermore, market expansion into emerging economies with growing R&D capabilities presents significant untapped potential.
Key Players Shaping the Chemical Software Industry Market
- Chemaxon Ltd
- BioSolveIT GmbH
- Chemical Computing Group ULC
- Molecular Discovery Ltd
- Scilligence
- Collaborative Drug Discovery Inc
- Jubilant Biosys Ltd
- Cadence Design Systems Inc (OpenEye Scientific Software Inc)
- Schrödinger Inc
- Dassault Systemes
Notable Milestones in Chemical Software Industry Sector
- October 2023: Cadence Molecular Sciences (OpenEye) announced an agreement with Pfizer Inc. to extend and expand access to its advanced molecular design products and programming toolkits, highlighting the critical role of physics- and AI-based modeling and cheminformatics in early-stage drug discovery innovation.
- June 2023: Vox Biomedical received a program from the National Institute of General Medical Sciences (NIGMS) to develop an AI-based chemical identification library for volatile organic compound (VOC) identification using GC-DMS, showcasing the growing application of AI in chemical analysis and diagnostics.
In-Depth Chemical Software Industry Market Outlook
The future outlook for the chemical software industry is exceptionally promising, driven by sustained innovation and expanding applications. Growth accelerators such as the continued integration of AI/ML for predictive modeling and the rise of cloud-based, collaborative platforms are set to redefine research methodologies. Strategic partnerships between software vendors and leading research institutions and corporations will further propel the development and adoption of cutting-edge solutions. The increasing emphasis on sustainable chemistry and personalized medicine will open new avenues for specialized software, while market expansion into rapidly developing regions will broaden the global reach of these critical technologies. This dynamic landscape promises continued robust growth and significant opportunities for stakeholders across the entire value chain.
Chemical Software Industry Segmentation
-
1. Application
-
1.1. Chemical Analysis
- 1.1.1. Chemical Databases
- 1.1.2. Chemometrics
- 1.1.3. Molecular Modelling
- 1.1.4. Other Chemical Analysis
- 1.2. Drug Discovery and Validation
- 1.3. Virtual Screening
- 1.4. Other Applications
-
1.1. Chemical Analysis
Chemical Software Industry Segmentation By Geography
-
1. North America
- 1.1. United States
- 1.2. Canada
- 1.3. Mexico
-
2. Europe
- 2.1. Germany
- 2.2. United Kingdom
- 2.3. France
- 2.4. Italy
- 2.5. Spain
- 2.6. Rest of Europe
-
3. Asia Pacific
- 3.1. China
- 3.2. Japan
- 3.3. India
- 3.4. Australia
- 3.5. South Korea
- 3.6. Rest of Asia Pacific
-
4. Middle East and Africa
- 4.1. GCC
- 4.2. South Africa
- 4.3. Rest of Middle East and Africa
-
5. South America
- 5.1. Brazil
- 5.2. Argentina
- 5.3. Rest of South America

Chemical Software Industry Regional Market Share
Geographic Coverage of Chemical Software Industry
Chemical Software Industry REPORT HIGHLIGHTS
| Aspects | Details |
|---|---|
| Study Period | 2020-2034 |
| Base Year | 2025 |
| Estimated Year | 2026 |
| Forecast Period | 2026-2034 |
| Historical Period | 2020-2025 |
| Growth Rate | CAGR of 15.50% from 2020-2034 |
| Segmentation |
|
Table of Contents
- 1. Introduction
- 1.1. Research Scope
- 1.2. Market Segmentation
- 1.3. Research Objective
- 1.4. Definitions and Assumptions
- 2. Executive Summary
- 2.1. Market Snapshot
- 3. Market Dynamics
- 3.1. Market Drivers
- 3.2. Market Restrains
- 3.3. Market Trends
- 3.4. Market Opportunities
- 4. Market Factor Analysis
- 4.1. Porters Five Forces
- 4.1.1. Bargaining Power of Suppliers
- 4.1.2. Bargaining Power of Buyers
- 4.1.3. Threat of New Entrants
- 4.1.4. Threat of Substitutes
- 4.1.5. Competitive Rivalry
- 4.2. PESTEL analysis
- 4.3. BCG Analysis
- 4.3.1. Stars (High Growth, High Market Share)
- 4.3.2. Cash Cows (Low Growth, High Market Share)
- 4.3.3. Question Mark (High Growth, Low Market Share)
- 4.3.4. Dogs (Low Growth, Low Market Share)
- 4.4. Ansoff Matrix Analysis
- 4.5. Supply Chain Analysis
- 4.6. Regulatory Landscape
- 4.7. Current Market Potential and Opportunity Assessment (TAM–SAM–SOM Framework)
- 4.8. IMR Analyst Note
- 4.1. Porters Five Forces
- 5. Market Analysis, Insights and Forecast 2021-2033
- 5.1. Market Analysis, Insights and Forecast - by Application
- 5.1.1. Chemical Analysis
- 5.1.1.1. Chemical Databases
- 5.1.1.2. Chemometrics
- 5.1.1.3. Molecular Modelling
- 5.1.1.4. Other Chemical Analysis
- 5.1.2. Drug Discovery and Validation
- 5.1.3. Virtual Screening
- 5.1.4. Other Applications
- 5.1.1. Chemical Analysis
- 5.2. Market Analysis, Insights and Forecast - by Region
- 5.2.1. North America
- 5.2.2. Europe
- 5.2.3. Asia Pacific
- 5.2.4. Middle East and Africa
- 5.2.5. South America
- 5.1. Market Analysis, Insights and Forecast - by Application
- 6. Global Chemical Software Industry Analysis, Insights and Forecast, 2021-2033
- 6.1. Market Analysis, Insights and Forecast - by Application
- 6.1.1. Chemical Analysis
- 6.1.1.1. Chemical Databases
- 6.1.1.2. Chemometrics
- 6.1.1.3. Molecular Modelling
- 6.1.1.4. Other Chemical Analysis
- 6.1.2. Drug Discovery and Validation
- 6.1.3. Virtual Screening
- 6.1.4. Other Applications
- 6.1.1. Chemical Analysis
- 6.1. Market Analysis, Insights and Forecast - by Application
- 7. North America Chemical Software Industry Analysis, Insights and Forecast, 2020-2032
- 7.1. Market Analysis, Insights and Forecast - by Application
- 7.1.1. Chemical Analysis
- 7.1.1.1. Chemical Databases
- 7.1.1.2. Chemometrics
- 7.1.1.3. Molecular Modelling
- 7.1.1.4. Other Chemical Analysis
- 7.1.2. Drug Discovery and Validation
- 7.1.3. Virtual Screening
- 7.1.4. Other Applications
- 7.1.1. Chemical Analysis
- 7.1. Market Analysis, Insights and Forecast - by Application
- 8. Europe Chemical Software Industry Analysis, Insights and Forecast, 2020-2032
- 8.1. Market Analysis, Insights and Forecast - by Application
- 8.1.1. Chemical Analysis
- 8.1.1.1. Chemical Databases
- 8.1.1.2. Chemometrics
- 8.1.1.3. Molecular Modelling
- 8.1.1.4. Other Chemical Analysis
- 8.1.2. Drug Discovery and Validation
- 8.1.3. Virtual Screening
- 8.1.4. Other Applications
- 8.1.1. Chemical Analysis
- 8.1. Market Analysis, Insights and Forecast - by Application
- 9. Asia Pacific Chemical Software Industry Analysis, Insights and Forecast, 2020-2032
- 9.1. Market Analysis, Insights and Forecast - by Application
- 9.1.1. Chemical Analysis
- 9.1.1.1. Chemical Databases
- 9.1.1.2. Chemometrics
- 9.1.1.3. Molecular Modelling
- 9.1.1.4. Other Chemical Analysis
- 9.1.2. Drug Discovery and Validation
- 9.1.3. Virtual Screening
- 9.1.4. Other Applications
- 9.1.1. Chemical Analysis
- 9.1. Market Analysis, Insights and Forecast - by Application
- 10. Middle East and Africa Chemical Software Industry Analysis, Insights and Forecast, 2020-2032
- 10.1. Market Analysis, Insights and Forecast - by Application
- 10.1.1. Chemical Analysis
- 10.1.1.1. Chemical Databases
- 10.1.1.2. Chemometrics
- 10.1.1.3. Molecular Modelling
- 10.1.1.4. Other Chemical Analysis
- 10.1.2. Drug Discovery and Validation
- 10.1.3. Virtual Screening
- 10.1.4. Other Applications
- 10.1.1. Chemical Analysis
- 10.1. Market Analysis, Insights and Forecast - by Application
- 11. South America Chemical Software Industry Analysis, Insights and Forecast, 2020-2032
- 11.1. Market Analysis, Insights and Forecast - by Application
- 11.1.1. Chemical Analysis
- 11.1.1.1. Chemical Databases
- 11.1.1.2. Chemometrics
- 11.1.1.3. Molecular Modelling
- 11.1.1.4. Other Chemical Analysis
- 11.1.2. Drug Discovery and Validation
- 11.1.3. Virtual Screening
- 11.1.4. Other Applications
- 11.1.1. Chemical Analysis
- 11.1. Market Analysis, Insights and Forecast - by Application
- 12. Competitive Analysis
- 12.1. Company Profiles
- 12.1.1 Chemaxon Ltd
- 12.1.1.1. Company Overview
- 12.1.1.2. Products
- 12.1.1.3. Company Financials
- 12.1.1.4. SWOT Analysis
- 12.1.2 BioSolveIT GmbH
- 12.1.2.1. Company Overview
- 12.1.2.2. Products
- 12.1.2.3. Company Financials
- 12.1.2.4. SWOT Analysis
- 12.1.3 Chemical Computing Group ULC
- 12.1.3.1. Company Overview
- 12.1.3.2. Products
- 12.1.3.3. Company Financials
- 12.1.3.4. SWOT Analysis
- 12.1.4 Molecular Discovery Ltd
- 12.1.4.1. Company Overview
- 12.1.4.2. Products
- 12.1.4.3. Company Financials
- 12.1.4.4. SWOT Analysis
- 12.1.5 Scilligence
- 12.1.5.1. Company Overview
- 12.1.5.2. Products
- 12.1.5.3. Company Financials
- 12.1.5.4. SWOT Analysis
- 12.1.6 Collaborative Drug Discovery Inc
- 12.1.6.1. Company Overview
- 12.1.6.2. Products
- 12.1.6.3. Company Financials
- 12.1.6.4. SWOT Analysis
- 12.1.7 Jubilant Biosys Ltd
- 12.1.7.1. Company Overview
- 12.1.7.2. Products
- 12.1.7.3. Company Financials
- 12.1.7.4. SWOT Analysis
- 12.1.8 Cadence Design Systems Inc (OpenEye Scientific Software Inc )
- 12.1.8.1. Company Overview
- 12.1.8.2. Products
- 12.1.8.3. Company Financials
- 12.1.8.4. SWOT Analysis
- 12.1.9 Schrödinger Inc
- 12.1.9.1. Company Overview
- 12.1.9.2. Products
- 12.1.9.3. Company Financials
- 12.1.9.4. SWOT Analysis
- 12.1.10 Dassault Systemes
- 12.1.10.1. Company Overview
- 12.1.10.2. Products
- 12.1.10.3. Company Financials
- 12.1.10.4. SWOT Analysis
- 12.1.1 Chemaxon Ltd
- 12.2. Market Entropy
- 12.2.1 Company's Key Areas Served
- 12.2.2 Recent Developments
- 12.3. Company Market Share Analysis 2025
- 12.3.1 Top 5 Companies Market Share Analysis
- 12.3.2 Top 3 Companies Market Share Analysis
- 12.4. List of Potential Customers
- 13. Research Methodology
List of Figures
- Figure 1: Global Chemical Software Industry Revenue Breakdown (Million, %) by Region 2025 & 2033
- Figure 2: North America Chemical Software Industry Revenue (Million), by Application 2025 & 2033
- Figure 3: North America Chemical Software Industry Revenue Share (%), by Application 2025 & 2033
- Figure 4: North America Chemical Software Industry Revenue (Million), by Country 2025 & 2033
- Figure 5: North America Chemical Software Industry Revenue Share (%), by Country 2025 & 2033
- Figure 6: Europe Chemical Software Industry Revenue (Million), by Application 2025 & 2033
- Figure 7: Europe Chemical Software Industry Revenue Share (%), by Application 2025 & 2033
- Figure 8: Europe Chemical Software Industry Revenue (Million), by Country 2025 & 2033
- Figure 9: Europe Chemical Software Industry Revenue Share (%), by Country 2025 & 2033
- Figure 10: Asia Pacific Chemical Software Industry Revenue (Million), by Application 2025 & 2033
- Figure 11: Asia Pacific Chemical Software Industry Revenue Share (%), by Application 2025 & 2033
- Figure 12: Asia Pacific Chemical Software Industry Revenue (Million), by Country 2025 & 2033
- Figure 13: Asia Pacific Chemical Software Industry Revenue Share (%), by Country 2025 & 2033
- Figure 14: Middle East and Africa Chemical Software Industry Revenue (Million), by Application 2025 & 2033
- Figure 15: Middle East and Africa Chemical Software Industry Revenue Share (%), by Application 2025 & 2033
- Figure 16: Middle East and Africa Chemical Software Industry Revenue (Million), by Country 2025 & 2033
- Figure 17: Middle East and Africa Chemical Software Industry Revenue Share (%), by Country 2025 & 2033
- Figure 18: South America Chemical Software Industry Revenue (Million), by Application 2025 & 2033
- Figure 19: South America Chemical Software Industry Revenue Share (%), by Application 2025 & 2033
- Figure 20: South America Chemical Software Industry Revenue (Million), by Country 2025 & 2033
- Figure 21: South America Chemical Software Industry Revenue Share (%), by Country 2025 & 2033
List of Tables
- Table 1: Global Chemical Software Industry Revenue Million Forecast, by Application 2020 & 2033
- Table 2: Global Chemical Software Industry Revenue Million Forecast, by Region 2020 & 2033
- Table 3: Global Chemical Software Industry Revenue Million Forecast, by Application 2020 & 2033
- Table 4: Global Chemical Software Industry Revenue Million Forecast, by Country 2020 & 2033
- Table 5: United States Chemical Software Industry Revenue (Million) Forecast, by Application 2020 & 2033
- Table 6: Canada Chemical Software Industry Revenue (Million) Forecast, by Application 2020 & 2033
- Table 7: Mexico Chemical Software Industry Revenue (Million) Forecast, by Application 2020 & 2033
- Table 8: Global Chemical Software Industry Revenue Million Forecast, by Application 2020 & 2033
- Table 9: Global Chemical Software Industry Revenue Million Forecast, by Country 2020 & 2033
- Table 10: Germany Chemical Software Industry Revenue (Million) Forecast, by Application 2020 & 2033
- Table 11: United Kingdom Chemical Software Industry Revenue (Million) Forecast, by Application 2020 & 2033
- Table 12: France Chemical Software Industry Revenue (Million) Forecast, by Application 2020 & 2033
- Table 13: Italy Chemical Software Industry Revenue (Million) Forecast, by Application 2020 & 2033
- Table 14: Spain Chemical Software Industry Revenue (Million) Forecast, by Application 2020 & 2033
- Table 15: Rest of Europe Chemical Software Industry Revenue (Million) Forecast, by Application 2020 & 2033
- Table 16: Global Chemical Software Industry Revenue Million Forecast, by Application 2020 & 2033
- Table 17: Global Chemical Software Industry Revenue Million Forecast, by Country 2020 & 2033
- Table 18: China Chemical Software Industry Revenue (Million) Forecast, by Application 2020 & 2033
- Table 19: Japan Chemical Software Industry Revenue (Million) Forecast, by Application 2020 & 2033
- Table 20: India Chemical Software Industry Revenue (Million) Forecast, by Application 2020 & 2033
- Table 21: Australia Chemical Software Industry Revenue (Million) Forecast, by Application 2020 & 2033
- Table 22: South Korea Chemical Software Industry Revenue (Million) Forecast, by Application 2020 & 2033
- Table 23: Rest of Asia Pacific Chemical Software Industry Revenue (Million) Forecast, by Application 2020 & 2033
- Table 24: Global Chemical Software Industry Revenue Million Forecast, by Application 2020 & 2033
- Table 25: Global Chemical Software Industry Revenue Million Forecast, by Country 2020 & 2033
- Table 26: GCC Chemical Software Industry Revenue (Million) Forecast, by Application 2020 & 2033
- Table 27: South Africa Chemical Software Industry Revenue (Million) Forecast, by Application 2020 & 2033
- Table 28: Rest of Middle East and Africa Chemical Software Industry Revenue (Million) Forecast, by Application 2020 & 2033
- Table 29: Global Chemical Software Industry Revenue Million Forecast, by Application 2020 & 2033
- Table 30: Global Chemical Software Industry Revenue Million Forecast, by Country 2020 & 2033
- Table 31: Brazil Chemical Software Industry Revenue (Million) Forecast, by Application 2020 & 2033
- Table 32: Argentina Chemical Software Industry Revenue (Million) Forecast, by Application 2020 & 2033
- Table 33: Rest of South America Chemical Software Industry Revenue (Million) Forecast, by Application 2020 & 2033
Frequently Asked Questions
1. What is the projected Compound Annual Growth Rate (CAGR) of the Chemical Software Industry?
The projected CAGR is approximately 15.50%.
2. Which companies are prominent players in the Chemical Software Industry?
Key companies in the market include Chemaxon Ltd, BioSolveIT GmbH, Chemical Computing Group ULC, Molecular Discovery Ltd, Scilligence, Collaborative Drug Discovery Inc, Jubilant Biosys Ltd, Cadence Design Systems Inc (OpenEye Scientific Software Inc ), Schrödinger Inc, Dassault Systemes.
3. What are the main segments of the Chemical Software Industry?
The market segments include Application.
4. Can you provide details about the market size?
The market size is estimated to be USD 6.10 Million as of 2022.
5. What are some drivers contributing to market growth?
Innovations and Advancements in the Drug Development Process; Increased Demand of Personalized Medicine.
6. What are the notable trends driving market growth?
Virtual Screening Segment is Expected to Witness Growth in the Market Over the Forecast Period.
7. Are there any restraints impacting market growth?
Lack of Skilled Labors.
8. Can you provide examples of recent developments in the market?
In October 2023, Cadence Molecular Sciences (OpenEye) announced that Pfizer Inc. has signed an agreement to extend and expand access to Cadence products and programming toolkits for advanced molecular design. Cadence Molecular Sciences’ physics-and AI-based modelling and cheminformatics computational software is an enabler of early-stage drug discovery innovation.
9. What pricing options are available for accessing the report?
Pricing options include single-user, multi-user, and enterprise licenses priced at USD 4750, USD 5250, and USD 8750 respectively.
10. Is the market size provided in terms of value or volume?
The market size is provided in terms of value, measured in Million.
11. Are there any specific market keywords associated with the report?
Yes, the market keyword associated with the report is "Chemical Software Industry," which aids in identifying and referencing the specific market segment covered.
12. How do I determine which pricing option suits my needs best?
The pricing options vary based on user requirements and access needs. Individual users may opt for single-user licenses, while businesses requiring broader access may choose multi-user or enterprise licenses for cost-effective access to the report.
13. Are there any additional resources or data provided in the Chemical Software Industry report?
While the report offers comprehensive insights, it's advisable to review the specific contents or supplementary materials provided to ascertain if additional resources or data are available.
14. How can I stay updated on further developments or reports in the Chemical Software Industry?
To stay informed about further developments, trends, and reports in the Chemical Software Industry, consider subscribing to industry newsletters, following relevant companies and organizations, or regularly checking reputable industry news sources and publications.
Methodology
Step 1 - Identification of Relevant Samples Size from Population Database


Step 2 - Approaches for Defining Global Market Size (Value, Volume* & Price*)

Note*: In applicable scenarios
Step 3 - Data Sources
Primary Research
- Web Analytics
- Survey Reports
- Research Institute
- Latest Research Reports
- Opinion Leaders
Secondary Research
- Annual Reports
- White Paper
- Latest Press Release
- Industry Association
- Paid Database
- Investor Presentations

Step 4 - Data Triangulation
Involves using different sources of information in order to increase the validity of a study
These sources are likely to be stakeholders in a program - participants, other researchers, program staff, other community members, and so on.
Then we put all data in single framework & apply various statistical tools to find out the dynamic on the market.
During the analysis stage, feedback from the stakeholder groups would be compared to determine areas of agreement as well as areas of divergence