

Key Insights
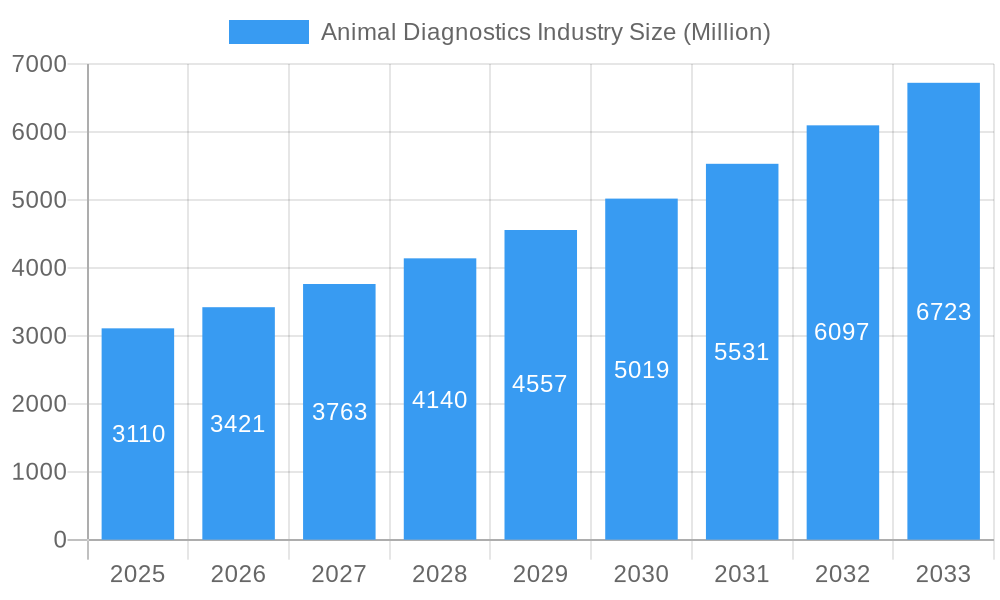
The global animal diagnostics market, valued at approximately $3.11 billion in 2025, is poised for robust growth, exhibiting a compound annual growth rate (CAGR) of 10% from 2025 to 2033. This expansion is fueled by several key factors. Rising pet ownership globally, coupled with increasing awareness of animal health and welfare, drives demand for advanced diagnostic tools. The market is witnessing a significant shift towards sophisticated technologies like immunodiagnostic tests and molecular diagnostics, enabling faster, more accurate disease detection and improved treatment outcomes. Furthermore, the increasing prevalence of zoonotic diseases (diseases transmissible from animals to humans) necessitates enhanced surveillance and diagnostic capabilities, further propelling market growth. The veterinary industry's adoption of preventative healthcare strategies also contributes to market expansion, as early detection through diagnostics becomes crucial in managing animal health effectively. Geographically, North America and Europe currently dominate the market due to high veterinary infrastructure and pet ownership rates, but the Asia-Pacific region is anticipated to experience significant growth, driven by rising disposable incomes and increasing awareness of animal health in developing economies.
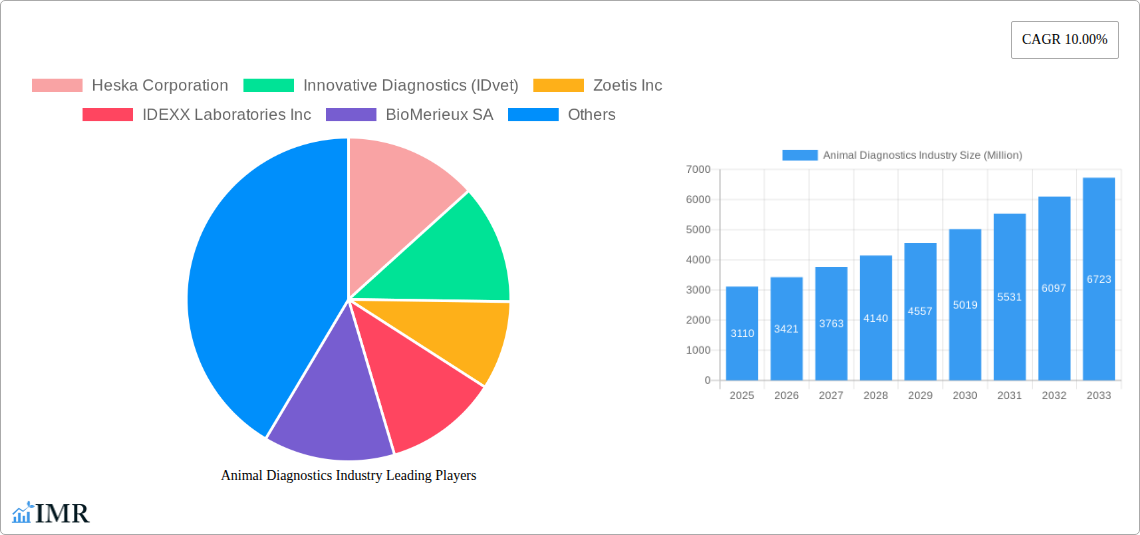
Animal Diagnostics Industry Market Size (In Billion)
However, certain market restraints exist. The high cost of advanced diagnostic technologies can pose a barrier to entry for smaller veterinary clinics, particularly in developing regions. Regulatory hurdles and variations in reimbursement policies across different countries can also impact market growth. Competition among established players and emerging companies is intense, requiring continuous innovation and strategic partnerships to maintain a competitive edge. Despite these challenges, the long-term outlook for the animal diagnostics market remains positive, with ongoing technological advancements, expanding pet ownership, and a growing focus on animal health contributing to sustained market growth throughout the forecast period. The market segmentation shows strong growth across all animal types (cats, dogs, other animals) and application areas (bacteriology, parasitology, clinical pathology, etc.). This highlights the broad applicability and importance of animal diagnostics in veterinary medicine.
Animal Diagnostics Industry Company Market Share
Animal Diagnostics Industry Market Report: 2019-2033
This comprehensive report provides a detailed analysis of the Animal Diagnostics Industry, encompassing market dynamics, growth trends, leading players, and future outlook. The study period covers 2019-2033, with 2025 as the base and estimated year. The report segments the market by animal type (Cats, Dogs, Other Animals), application (Bacteriology, Parasitology, Clinical Pathology, Other Applications), and technology (Immunodiagnostic Tests, Molecular Diagnostics, Diagnostic Imaging, Other Diagnostics). Key players analyzed include Heska Corporation, Innovative Diagnostics (IDvet), Zoetis Inc, IDEXX Laboratories Inc, BioMérieux SA, Randox Laboratories Ltd, Chembio Diagnostic Systems Inc, Thermo Fisher Scientific Inc, Indical Bioscience GmbH, Creative Diagnostics, Agrolabo SpA, Virbac, and Neogen Corporation. The report's market size estimations are presented in Million units.
Animal Diagnostics Industry Market Dynamics & Structure
The animal diagnostics market is characterized by a moderately consolidated structure, with key players holding significant market share. The market size in 2025 is estimated at xx Million units, expected to reach xx Million units by 2033. Technological innovation, particularly in molecular diagnostics and diagnostic imaging, is a major driver, while stringent regulatory frameworks influence product development and market entry. Competitive pressure from substitute products and services is also a factor. The increasing pet humanization trend and rising pet ownership globally fuel demand. Significant M&A activity has been observed, with xx major deals completed between 2019 and 2024, consolidating market share among leading companies.
- Market Concentration: IDEXX Laboratories and Zoetis hold a combined market share of approximately xx%, indicating a moderately concentrated market.
- Technological Innovation: Advancements in molecular diagnostics (e.g., PCR-based tests) and point-of-care diagnostics are driving growth.
- Regulatory Landscape: Regulations concerning diagnostic accuracy, safety, and data privacy vary across geographies, impacting market entry strategies.
- Competitive Substitutes: The availability of simpler, less expensive diagnostic methods poses a challenge to the industry.
- End-User Demographics: Increasing pet ownership, particularly in developed countries, drives market demand, especially for companion animal diagnostics.
- M&A Activity: Consolidation through mergers and acquisitions is a significant trend, aiming to enhance product portfolios and market reach.
Animal Diagnostics Industry Growth Trends & Insights
The animal diagnostics market exhibits robust growth, driven by factors such as increasing pet ownership, rising pet healthcare expenditure, technological advancements, and the growing preference for preventative healthcare. The market experienced a CAGR of xx% during the historical period (2019-2024) and is projected to maintain a CAGR of xx% during the forecast period (2025-2033). Market penetration of advanced diagnostic technologies is gradually increasing, particularly in developed regions. The adoption of point-of-care diagnostics is also rising, fueled by improved efficiency and convenience. Consumer behavior is shifting towards greater proactive pet healthcare, translating into higher demand for diagnostic services.
(Note: This section requires data from the mentioned XXX source to provide specific metrics and a 600-word analysis. The above provides a framework.)
Dominant Regions, Countries, or Segments in Animal Diagnostics Industry
North America currently dominates the animal diagnostics market, accounting for approximately xx% of the global market share in 2025. This dominance is attributed to factors such as high pet ownership rates, well-developed veterinary infrastructure, and high per-capita healthcare expenditure. Within North America, the United States holds the largest share. Europe follows as a significant market, while the Asia-Pacific region is showing the fastest growth rate, driven by expanding economies and rising pet ownership in countries like China and India.
- Leading Segment: Companion animal diagnostics (cats and dogs) represent the largest segment, with cats contributing approximately xx% and dogs xx% in 2025. Clinical pathology is the most widely used application, followed by parasitology and bacteriology. Immunodiagnostic tests hold the largest market share among diagnostic technologies.
- Key Drivers: Factors such as rising pet ownership rates, increased pet healthcare spending, and technological advancements in diagnostic techniques are driving market growth. Strong regulatory frameworks and established veterinary infrastructure in North America support market leadership.
- Growth Potential: The Asia-Pacific region demonstrates significant growth potential driven by rising disposable incomes, increasing pet ownership, and improvements in veterinary infrastructure.
Animal Diagnostics Industry Product Landscape
The animal diagnostics market offers a diverse range of products, including rapid diagnostic tests, ELISA kits, PCR assays, and advanced imaging systems. Product innovation focuses on improving diagnostic accuracy, speed, and ease of use. Many companies offer integrated solutions combining diagnostic tests with software platforms for data management and analysis. Unique selling propositions include enhanced sensitivity, specificity, and streamlined workflows to improve veterinary practice efficiency. Miniaturization and point-of-care diagnostic technologies are key trends.
Key Drivers, Barriers & Challenges in Animal Diagnostics Industry
Key Drivers:
- Rising pet ownership and increasing pet healthcare spending.
- Technological advancements resulting in improved diagnostic accuracy and speed.
- Growing demand for preventative healthcare and early disease detection.
- Increasing adoption of point-of-care diagnostics.
Key Challenges & Restraints:
- High cost of advanced diagnostic technologies, limiting accessibility in some regions.
- Stringent regulatory requirements and approvals for new diagnostic products.
- Intense competition among established and emerging players.
- Potential supply chain disruptions impacting the availability of raw materials and reagents. This resulted in a xx% increase in costs for some reagents in 2023.
Emerging Opportunities in Animal Diagnostics Industry
- Expansion into emerging markets with growing pet ownership and improving veterinary infrastructure.
- Development of new diagnostic tests for emerging animal diseases and novel pathogens.
- Integration of artificial intelligence and machine learning for improved diagnostics and disease prediction.
- Development of personalized medicine approaches based on individual animal genetic profiles.
Growth Accelerators in the Animal Diagnostics Industry
Long-term growth will be significantly influenced by continuous technological advancements, especially in areas like genomics and proteomics for improved diagnostics. Strategic collaborations between diagnostic companies and veterinary clinics or pharmaceutical companies will play a crucial role in expanding market reach. Focus on developing point-of-care and home-testing solutions will drive growth as well. The expanding veterinary market in developing countries presents a significant growth opportunity.
Key Players Shaping the Animal Diagnostics Industry Market
- Heska Corporation
- Innovative Diagnostics (IDvet)
- Zoetis Inc
- IDEXX Laboratories Inc
- BioMérieux SA
- Randox Laboratories Ltd
- Chembio Diagnostic Systems Inc
- Thermo Fisher Scientific Inc
- Indical Bioscience GmbH
- Creative Diagnostics
- Agrolabo SpA
- Virbac
- Neogen Corporation
Notable Milestones in Animal Diagnostics Industry Sector
- January 2022: IDEXX Laboratories, Inc. launched several product and service enhancements, including the IDEXX 4Dx Plus Test and VetConnectPLUS Mobile App, boosting efficiency in veterinary practices.
- August 2022: PepiPets launched a mobile diagnostic testing service, expanding access to at-home pet diagnostics.
In-Depth Animal Diagnostics Industry Market Outlook
The animal diagnostics market is poised for continued growth, driven by technological advancements, increasing pet ownership, and rising awareness of preventative healthcare. Strategic partnerships, expansion into emerging markets, and the development of innovative point-of-care and home-testing solutions will create lucrative opportunities for market players. The market’s long-term potential is substantial, particularly in regions with growing economies and developing veterinary infrastructure.
Animal Diagnostics Industry Segmentation
-
1. Animals
- 1.1. Cats
- 1.2. Dogs
- 1.3. Other Animals
-
2. Application
- 2.1. Bacteriology
- 2.2. Parasitology
- 2.3. Clinical Pathology
- 2.4. Other Applications
-
3. Technology
- 3.1. Immunodiagnostic Tests
- 3.2. Molecular Diagnostics
- 3.3. Diagnostic Imaging
- 3.4. Other Diagnostics
Animal Diagnostics Industry Segmentation By Geography
-
1. North America
- 1.1. United States
- 1.2. Canada
- 1.3. Mexico
-
2. Europe
- 2.1. Germany
- 2.2. United Kingdom
- 2.3. France
- 2.4. Italy
- 2.5. Spain
- 2.6. Rest of Europe
-
3. Asia Pacific
- 3.1. China
- 3.2. Japan
- 3.3. India
- 3.4. Australia
- 3.5. South Korea
- 3.6. Rest of Asia Pacific
-
4. Middle East and Africa
- 4.1. GCC
- 4.2. South Africa
- 4.3. Rest of Middle East and Africa
-
5. South America
- 5.1. Brazil
- 5.2. Argentina
- 5.3. Rest of South America
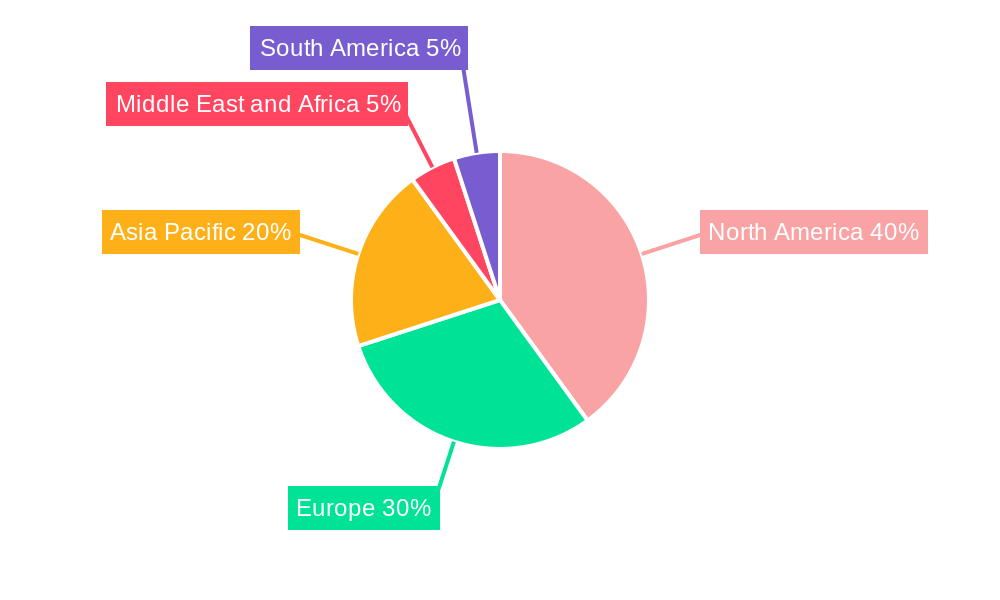
Animal Diagnostics Industry Regional Market Share
Geographic Coverage of Animal Diagnostics Industry
Animal Diagnostics Industry REPORT HIGHLIGHTS
| Aspects | Details |
|---|---|
| Study Period | 2020-2034 |
| Base Year | 2025 |
| Estimated Year | 2026 |
| Forecast Period | 2026-2034 |
| Historical Period | 2020-2025 |
| Growth Rate | CAGR of 10.00% from 2020-2034 |
| Segmentation |
|
Table of Contents
- 1. Introduction
- 1.1. Research Scope
- 1.2. Market Segmentation
- 1.3. Research Objective
- 1.4. Definitions and Assumptions
- 2. Executive Summary
- 2.1. Market Snapshot
- 3. Market Dynamics
- 3.1. Market Drivers
- 3.2. Market Restrains
- 3.3. Market Trends
- 3.4. Market Opportunities
- 4. Market Factor Analysis
- 4.1. Porters Five Forces
- 4.1.1. Bargaining Power of Suppliers
- 4.1.2. Bargaining Power of Buyers
- 4.1.3. Threat of New Entrants
- 4.1.4. Threat of Substitutes
- 4.1.5. Competitive Rivalry
- 4.2. PESTEL analysis
- 4.3. BCG Analysis
- 4.3.1. Stars (High Growth, High Market Share)
- 4.3.2. Cash Cows (Low Growth, High Market Share)
- 4.3.3. Question Mark (High Growth, Low Market Share)
- 4.3.4. Dogs (Low Growth, Low Market Share)
- 4.4. Ansoff Matrix Analysis
- 4.5. Supply Chain Analysis
- 4.6. Regulatory Landscape
- 4.7. Current Market Potential and Opportunity Assessment (TAM–SAM–SOM Framework)
- 4.8. IMR Analyst Note
- 4.1. Porters Five Forces
- 5. Market Analysis, Insights and Forecast 2021-2033
- 5.1. Market Analysis, Insights and Forecast - by Animals
- 5.1.1. Cats
- 5.1.2. Dogs
- 5.1.3. Other Animals
- 5.2. Market Analysis, Insights and Forecast - by Application
- 5.2.1. Bacteriology
- 5.2.2. Parasitology
- 5.2.3. Clinical Pathology
- 5.2.4. Other Applications
- 5.3. Market Analysis, Insights and Forecast - by Technology
- 5.3.1. Immunodiagnostic Tests
- 5.3.2. Molecular Diagnostics
- 5.3.3. Diagnostic Imaging
- 5.3.4. Other Diagnostics
- 5.4. Market Analysis, Insights and Forecast - by Region
- 5.4.1. North America
- 5.4.2. Europe
- 5.4.3. Asia Pacific
- 5.4.4. Middle East and Africa
- 5.4.5. South America
- 5.1. Market Analysis, Insights and Forecast - by Animals
- 6. Global Animal Diagnostics Industry Analysis, Insights and Forecast, 2021-2033
- 6.1. Market Analysis, Insights and Forecast - by Animals
- 6.1.1. Cats
- 6.1.2. Dogs
- 6.1.3. Other Animals
- 6.2. Market Analysis, Insights and Forecast - by Application
- 6.2.1. Bacteriology
- 6.2.2. Parasitology
- 6.2.3. Clinical Pathology
- 6.2.4. Other Applications
- 6.3. Market Analysis, Insights and Forecast - by Technology
- 6.3.1. Immunodiagnostic Tests
- 6.3.2. Molecular Diagnostics
- 6.3.3. Diagnostic Imaging
- 6.3.4. Other Diagnostics
- 6.1. Market Analysis, Insights and Forecast - by Animals
- 7. North America Animal Diagnostics Industry Analysis, Insights and Forecast, 2020-2032
- 7.1. Market Analysis, Insights and Forecast - by Animals
- 7.1.1. Cats
- 7.1.2. Dogs
- 7.1.3. Other Animals
- 7.2. Market Analysis, Insights and Forecast - by Application
- 7.2.1. Bacteriology
- 7.2.2. Parasitology
- 7.2.3. Clinical Pathology
- 7.2.4. Other Applications
- 7.3. Market Analysis, Insights and Forecast - by Technology
- 7.3.1. Immunodiagnostic Tests
- 7.3.2. Molecular Diagnostics
- 7.3.3. Diagnostic Imaging
- 7.3.4. Other Diagnostics
- 7.1. Market Analysis, Insights and Forecast - by Animals
- 8. Europe Animal Diagnostics Industry Analysis, Insights and Forecast, 2020-2032
- 8.1. Market Analysis, Insights and Forecast - by Animals
- 8.1.1. Cats
- 8.1.2. Dogs
- 8.1.3. Other Animals
- 8.2. Market Analysis, Insights and Forecast - by Application
- 8.2.1. Bacteriology
- 8.2.2. Parasitology
- 8.2.3. Clinical Pathology
- 8.2.4. Other Applications
- 8.3. Market Analysis, Insights and Forecast - by Technology
- 8.3.1. Immunodiagnostic Tests
- 8.3.2. Molecular Diagnostics
- 8.3.3. Diagnostic Imaging
- 8.3.4. Other Diagnostics
- 8.1. Market Analysis, Insights and Forecast - by Animals
- 9. Asia Pacific Animal Diagnostics Industry Analysis, Insights and Forecast, 2020-2032
- 9.1. Market Analysis, Insights and Forecast - by Animals
- 9.1.1. Cats
- 9.1.2. Dogs
- 9.1.3. Other Animals
- 9.2. Market Analysis, Insights and Forecast - by Application
- 9.2.1. Bacteriology
- 9.2.2. Parasitology
- 9.2.3. Clinical Pathology
- 9.2.4. Other Applications
- 9.3. Market Analysis, Insights and Forecast - by Technology
- 9.3.1. Immunodiagnostic Tests
- 9.3.2. Molecular Diagnostics
- 9.3.3. Diagnostic Imaging
- 9.3.4. Other Diagnostics
- 9.1. Market Analysis, Insights and Forecast - by Animals
- 10. Middle East and Africa Animal Diagnostics Industry Analysis, Insights and Forecast, 2020-2032
- 10.1. Market Analysis, Insights and Forecast - by Animals
- 10.1.1. Cats
- 10.1.2. Dogs
- 10.1.3. Other Animals
- 10.2. Market Analysis, Insights and Forecast - by Application
- 10.2.1. Bacteriology
- 10.2.2. Parasitology
- 10.2.3. Clinical Pathology
- 10.2.4. Other Applications
- 10.3. Market Analysis, Insights and Forecast - by Technology
- 10.3.1. Immunodiagnostic Tests
- 10.3.2. Molecular Diagnostics
- 10.3.3. Diagnostic Imaging
- 10.3.4. Other Diagnostics
- 10.1. Market Analysis, Insights and Forecast - by Animals
- 11. South America Animal Diagnostics Industry Analysis, Insights and Forecast, 2020-2032
- 11.1. Market Analysis, Insights and Forecast - by Animals
- 11.1.1. Cats
- 11.1.2. Dogs
- 11.1.3. Other Animals
- 11.2. Market Analysis, Insights and Forecast - by Application
- 11.2.1. Bacteriology
- 11.2.2. Parasitology
- 11.2.3. Clinical Pathology
- 11.2.4. Other Applications
- 11.3. Market Analysis, Insights and Forecast - by Technology
- 11.3.1. Immunodiagnostic Tests
- 11.3.2. Molecular Diagnostics
- 11.3.3. Diagnostic Imaging
- 11.3.4. Other Diagnostics
- 11.1. Market Analysis, Insights and Forecast - by Animals
- 12. Competitive Analysis
- 12.1. Company Profiles
- 12.1.1 Heska Corporation
- 12.1.1.1. Company Overview
- 12.1.1.2. Products
- 12.1.1.3. Company Financials
- 12.1.1.4. SWOT Analysis
- 12.1.2 Innovative Diagnostics (IDvet)
- 12.1.2.1. Company Overview
- 12.1.2.2. Products
- 12.1.2.3. Company Financials
- 12.1.2.4. SWOT Analysis
- 12.1.3 Zoetis Inc
- 12.1.3.1. Company Overview
- 12.1.3.2. Products
- 12.1.3.3. Company Financials
- 12.1.3.4. SWOT Analysis
- 12.1.4 IDEXX Laboratories Inc
- 12.1.4.1. Company Overview
- 12.1.4.2. Products
- 12.1.4.3. Company Financials
- 12.1.4.4. SWOT Analysis
- 12.1.5 BioMerieux SA
- 12.1.5.1. Company Overview
- 12.1.5.2. Products
- 12.1.5.3. Company Financials
- 12.1.5.4. SWOT Analysis
- 12.1.6 Randox Laboratories Ltd
- 12.1.6.1. Company Overview
- 12.1.6.2. Products
- 12.1.6.3. Company Financials
- 12.1.6.4. SWOT Analysis
- 12.1.7 Chembio Diagnostic Systems Inc
- 12.1.7.1. Company Overview
- 12.1.7.2. Products
- 12.1.7.3. Company Financials
- 12.1.7.4. SWOT Analysis
- 12.1.8 Thermo Fisher Scientific Inc
- 12.1.8.1. Company Overview
- 12.1.8.2. Products
- 12.1.8.3. Company Financials
- 12.1.8.4. SWOT Analysis
- 12.1.9 Indical Bioscience GmbH
- 12.1.9.1. Company Overview
- 12.1.9.2. Products
- 12.1.9.3. Company Financials
- 12.1.9.4. SWOT Analysis
- 12.1.10 Creative Diagnostics
- 12.1.10.1. Company Overview
- 12.1.10.2. Products
- 12.1.10.3. Company Financials
- 12.1.10.4. SWOT Analysis
- 12.1.11 Agrolabo SpA
- 12.1.11.1. Company Overview
- 12.1.11.2. Products
- 12.1.11.3. Company Financials
- 12.1.11.4. SWOT Analysis
- 12.1.12 Virbac
- 12.1.12.1. Company Overview
- 12.1.12.2. Products
- 12.1.12.3. Company Financials
- 12.1.12.4. SWOT Analysis
- 12.1.13 Neogen Corporation
- 12.1.13.1. Company Overview
- 12.1.13.2. Products
- 12.1.13.3. Company Financials
- 12.1.13.4. SWOT Analysis
- 12.1.1 Heska Corporation
- 12.2. Market Entropy
- 12.2.1 Company's Key Areas Served
- 12.2.2 Recent Developments
- 12.3. Company Market Share Analysis 2025
- 12.3.1 Top 5 Companies Market Share Analysis
- 12.3.2 Top 3 Companies Market Share Analysis
- 12.4. List of Potential Customers
- 13. Research Methodology
List of Figures
- Figure 1: Global Animal Diagnostics Industry Revenue Breakdown (Million, %) by Region 2025 & 2033
- Figure 2: Global Animal Diagnostics Industry Volume Breakdown (K Unit, %) by Region 2025 & 2033
- Figure 3: North America Animal Diagnostics Industry Revenue (Million), by Animals 2025 & 2033
- Figure 4: North America Animal Diagnostics Industry Volume (K Unit), by Animals 2025 & 2033
- Figure 5: North America Animal Diagnostics Industry Revenue Share (%), by Animals 2025 & 2033
- Figure 6: North America Animal Diagnostics Industry Volume Share (%), by Animals 2025 & 2033
- Figure 7: North America Animal Diagnostics Industry Revenue (Million), by Application 2025 & 2033
- Figure 8: North America Animal Diagnostics Industry Volume (K Unit), by Application 2025 & 2033
- Figure 9: North America Animal Diagnostics Industry Revenue Share (%), by Application 2025 & 2033
- Figure 10: North America Animal Diagnostics Industry Volume Share (%), by Application 2025 & 2033
- Figure 11: North America Animal Diagnostics Industry Revenue (Million), by Technology 2025 & 2033
- Figure 12: North America Animal Diagnostics Industry Volume (K Unit), by Technology 2025 & 2033
- Figure 13: North America Animal Diagnostics Industry Revenue Share (%), by Technology 2025 & 2033
- Figure 14: North America Animal Diagnostics Industry Volume Share (%), by Technology 2025 & 2033
- Figure 15: North America Animal Diagnostics Industry Revenue (Million), by Country 2025 & 2033
- Figure 16: North America Animal Diagnostics Industry Volume (K Unit), by Country 2025 & 2033
- Figure 17: North America Animal Diagnostics Industry Revenue Share (%), by Country 2025 & 2033
- Figure 18: North America Animal Diagnostics Industry Volume Share (%), by Country 2025 & 2033
- Figure 19: Europe Animal Diagnostics Industry Revenue (Million), by Animals 2025 & 2033
- Figure 20: Europe Animal Diagnostics Industry Volume (K Unit), by Animals 2025 & 2033
- Figure 21: Europe Animal Diagnostics Industry Revenue Share (%), by Animals 2025 & 2033
- Figure 22: Europe Animal Diagnostics Industry Volume Share (%), by Animals 2025 & 2033
- Figure 23: Europe Animal Diagnostics Industry Revenue (Million), by Application 2025 & 2033
- Figure 24: Europe Animal Diagnostics Industry Volume (K Unit), by Application 2025 & 2033
- Figure 25: Europe Animal Diagnostics Industry Revenue Share (%), by Application 2025 & 2033
- Figure 26: Europe Animal Diagnostics Industry Volume Share (%), by Application 2025 & 2033
- Figure 27: Europe Animal Diagnostics Industry Revenue (Million), by Technology 2025 & 2033
- Figure 28: Europe Animal Diagnostics Industry Volume (K Unit), by Technology 2025 & 2033
- Figure 29: Europe Animal Diagnostics Industry Revenue Share (%), by Technology 2025 & 2033
- Figure 30: Europe Animal Diagnostics Industry Volume Share (%), by Technology 2025 & 2033
- Figure 31: Europe Animal Diagnostics Industry Revenue (Million), by Country 2025 & 2033
- Figure 32: Europe Animal Diagnostics Industry Volume (K Unit), by Country 2025 & 2033
- Figure 33: Europe Animal Diagnostics Industry Revenue Share (%), by Country 2025 & 2033
- Figure 34: Europe Animal Diagnostics Industry Volume Share (%), by Country 2025 & 2033
- Figure 35: Asia Pacific Animal Diagnostics Industry Revenue (Million), by Animals 2025 & 2033
- Figure 36: Asia Pacific Animal Diagnostics Industry Volume (K Unit), by Animals 2025 & 2033
- Figure 37: Asia Pacific Animal Diagnostics Industry Revenue Share (%), by Animals 2025 & 2033
- Figure 38: Asia Pacific Animal Diagnostics Industry Volume Share (%), by Animals 2025 & 2033
- Figure 39: Asia Pacific Animal Diagnostics Industry Revenue (Million), by Application 2025 & 2033
- Figure 40: Asia Pacific Animal Diagnostics Industry Volume (K Unit), by Application 2025 & 2033
- Figure 41: Asia Pacific Animal Diagnostics Industry Revenue Share (%), by Application 2025 & 2033
- Figure 42: Asia Pacific Animal Diagnostics Industry Volume Share (%), by Application 2025 & 2033
- Figure 43: Asia Pacific Animal Diagnostics Industry Revenue (Million), by Technology 2025 & 2033
- Figure 44: Asia Pacific Animal Diagnostics Industry Volume (K Unit), by Technology 2025 & 2033
- Figure 45: Asia Pacific Animal Diagnostics Industry Revenue Share (%), by Technology 2025 & 2033
- Figure 46: Asia Pacific Animal Diagnostics Industry Volume Share (%), by Technology 2025 & 2033
- Figure 47: Asia Pacific Animal Diagnostics Industry Revenue (Million), by Country 2025 & 2033
- Figure 48: Asia Pacific Animal Diagnostics Industry Volume (K Unit), by Country 2025 & 2033
- Figure 49: Asia Pacific Animal Diagnostics Industry Revenue Share (%), by Country 2025 & 2033
- Figure 50: Asia Pacific Animal Diagnostics Industry Volume Share (%), by Country 2025 & 2033
- Figure 51: Middle East and Africa Animal Diagnostics Industry Revenue (Million), by Animals 2025 & 2033
- Figure 52: Middle East and Africa Animal Diagnostics Industry Volume (K Unit), by Animals 2025 & 2033
- Figure 53: Middle East and Africa Animal Diagnostics Industry Revenue Share (%), by Animals 2025 & 2033
- Figure 54: Middle East and Africa Animal Diagnostics Industry Volume Share (%), by Animals 2025 & 2033
- Figure 55: Middle East and Africa Animal Diagnostics Industry Revenue (Million), by Application 2025 & 2033
- Figure 56: Middle East and Africa Animal Diagnostics Industry Volume (K Unit), by Application 2025 & 2033
- Figure 57: Middle East and Africa Animal Diagnostics Industry Revenue Share (%), by Application 2025 & 2033
- Figure 58: Middle East and Africa Animal Diagnostics Industry Volume Share (%), by Application 2025 & 2033
- Figure 59: Middle East and Africa Animal Diagnostics Industry Revenue (Million), by Technology 2025 & 2033
- Figure 60: Middle East and Africa Animal Diagnostics Industry Volume (K Unit), by Technology 2025 & 2033
- Figure 61: Middle East and Africa Animal Diagnostics Industry Revenue Share (%), by Technology 2025 & 2033
- Figure 62: Middle East and Africa Animal Diagnostics Industry Volume Share (%), by Technology 2025 & 2033
- Figure 63: Middle East and Africa Animal Diagnostics Industry Revenue (Million), by Country 2025 & 2033
- Figure 64: Middle East and Africa Animal Diagnostics Industry Volume (K Unit), by Country 2025 & 2033
- Figure 65: Middle East and Africa Animal Diagnostics Industry Revenue Share (%), by Country 2025 & 2033
- Figure 66: Middle East and Africa Animal Diagnostics Industry Volume Share (%), by Country 2025 & 2033
- Figure 67: South America Animal Diagnostics Industry Revenue (Million), by Animals 2025 & 2033
- Figure 68: South America Animal Diagnostics Industry Volume (K Unit), by Animals 2025 & 2033
- Figure 69: South America Animal Diagnostics Industry Revenue Share (%), by Animals 2025 & 2033
- Figure 70: South America Animal Diagnostics Industry Volume Share (%), by Animals 2025 & 2033
- Figure 71: South America Animal Diagnostics Industry Revenue (Million), by Application 2025 & 2033
- Figure 72: South America Animal Diagnostics Industry Volume (K Unit), by Application 2025 & 2033
- Figure 73: South America Animal Diagnostics Industry Revenue Share (%), by Application 2025 & 2033
- Figure 74: South America Animal Diagnostics Industry Volume Share (%), by Application 2025 & 2033
- Figure 75: South America Animal Diagnostics Industry Revenue (Million), by Technology 2025 & 2033
- Figure 76: South America Animal Diagnostics Industry Volume (K Unit), by Technology 2025 & 2033
- Figure 77: South America Animal Diagnostics Industry Revenue Share (%), by Technology 2025 & 2033
- Figure 78: South America Animal Diagnostics Industry Volume Share (%), by Technology 2025 & 2033
- Figure 79: South America Animal Diagnostics Industry Revenue (Million), by Country 2025 & 2033
- Figure 80: South America Animal Diagnostics Industry Volume (K Unit), by Country 2025 & 2033
- Figure 81: South America Animal Diagnostics Industry Revenue Share (%), by Country 2025 & 2033
- Figure 82: South America Animal Diagnostics Industry Volume Share (%), by Country 2025 & 2033
List of Tables
- Table 1: Global Animal Diagnostics Industry Revenue Million Forecast, by Animals 2020 & 2033
- Table 2: Global Animal Diagnostics Industry Volume K Unit Forecast, by Animals 2020 & 2033
- Table 3: Global Animal Diagnostics Industry Revenue Million Forecast, by Application 2020 & 2033
- Table 4: Global Animal Diagnostics Industry Volume K Unit Forecast, by Application 2020 & 2033
- Table 5: Global Animal Diagnostics Industry Revenue Million Forecast, by Technology 2020 & 2033
- Table 6: Global Animal Diagnostics Industry Volume K Unit Forecast, by Technology 2020 & 2033
- Table 7: Global Animal Diagnostics Industry Revenue Million Forecast, by Region 2020 & 2033
- Table 8: Global Animal Diagnostics Industry Volume K Unit Forecast, by Region 2020 & 2033
- Table 9: Global Animal Diagnostics Industry Revenue Million Forecast, by Animals 2020 & 2033
- Table 10: Global Animal Diagnostics Industry Volume K Unit Forecast, by Animals 2020 & 2033
- Table 11: Global Animal Diagnostics Industry Revenue Million Forecast, by Application 2020 & 2033
- Table 12: Global Animal Diagnostics Industry Volume K Unit Forecast, by Application 2020 & 2033
- Table 13: Global Animal Diagnostics Industry Revenue Million Forecast, by Technology 2020 & 2033
- Table 14: Global Animal Diagnostics Industry Volume K Unit Forecast, by Technology 2020 & 2033
- Table 15: Global Animal Diagnostics Industry Revenue Million Forecast, by Country 2020 & 2033
- Table 16: Global Animal Diagnostics Industry Volume K Unit Forecast, by Country 2020 & 2033
- Table 17: United States Animal Diagnostics Industry Revenue (Million) Forecast, by Application 2020 & 2033
- Table 18: United States Animal Diagnostics Industry Volume (K Unit) Forecast, by Application 2020 & 2033
- Table 19: Canada Animal Diagnostics Industry Revenue (Million) Forecast, by Application 2020 & 2033
- Table 20: Canada Animal Diagnostics Industry Volume (K Unit) Forecast, by Application 2020 & 2033
- Table 21: Mexico Animal Diagnostics Industry Revenue (Million) Forecast, by Application 2020 & 2033
- Table 22: Mexico Animal Diagnostics Industry Volume (K Unit) Forecast, by Application 2020 & 2033
- Table 23: Global Animal Diagnostics Industry Revenue Million Forecast, by Animals 2020 & 2033
- Table 24: Global Animal Diagnostics Industry Volume K Unit Forecast, by Animals 2020 & 2033
- Table 25: Global Animal Diagnostics Industry Revenue Million Forecast, by Application 2020 & 2033
- Table 26: Global Animal Diagnostics Industry Volume K Unit Forecast, by Application 2020 & 2033
- Table 27: Global Animal Diagnostics Industry Revenue Million Forecast, by Technology 2020 & 2033
- Table 28: Global Animal Diagnostics Industry Volume K Unit Forecast, by Technology 2020 & 2033
- Table 29: Global Animal Diagnostics Industry Revenue Million Forecast, by Country 2020 & 2033
- Table 30: Global Animal Diagnostics Industry Volume K Unit Forecast, by Country 2020 & 2033
- Table 31: Germany Animal Diagnostics Industry Revenue (Million) Forecast, by Application 2020 & 2033
- Table 32: Germany Animal Diagnostics Industry Volume (K Unit) Forecast, by Application 2020 & 2033
- Table 33: United Kingdom Animal Diagnostics Industry Revenue (Million) Forecast, by Application 2020 & 2033
- Table 34: United Kingdom Animal Diagnostics Industry Volume (K Unit) Forecast, by Application 2020 & 2033
- Table 35: France Animal Diagnostics Industry Revenue (Million) Forecast, by Application 2020 & 2033
- Table 36: France Animal Diagnostics Industry Volume (K Unit) Forecast, by Application 2020 & 2033
- Table 37: Italy Animal Diagnostics Industry Revenue (Million) Forecast, by Application 2020 & 2033
- Table 38: Italy Animal Diagnostics Industry Volume (K Unit) Forecast, by Application 2020 & 2033
- Table 39: Spain Animal Diagnostics Industry Revenue (Million) Forecast, by Application 2020 & 2033
- Table 40: Spain Animal Diagnostics Industry Volume (K Unit) Forecast, by Application 2020 & 2033
- Table 41: Rest of Europe Animal Diagnostics Industry Revenue (Million) Forecast, by Application 2020 & 2033
- Table 42: Rest of Europe Animal Diagnostics Industry Volume (K Unit) Forecast, by Application 2020 & 2033
- Table 43: Global Animal Diagnostics Industry Revenue Million Forecast, by Animals 2020 & 2033
- Table 44: Global Animal Diagnostics Industry Volume K Unit Forecast, by Animals 2020 & 2033
- Table 45: Global Animal Diagnostics Industry Revenue Million Forecast, by Application 2020 & 2033
- Table 46: Global Animal Diagnostics Industry Volume K Unit Forecast, by Application 2020 & 2033
- Table 47: Global Animal Diagnostics Industry Revenue Million Forecast, by Technology 2020 & 2033
- Table 48: Global Animal Diagnostics Industry Volume K Unit Forecast, by Technology 2020 & 2033
- Table 49: Global Animal Diagnostics Industry Revenue Million Forecast, by Country 2020 & 2033
- Table 50: Global Animal Diagnostics Industry Volume K Unit Forecast, by Country 2020 & 2033
- Table 51: China Animal Diagnostics Industry Revenue (Million) Forecast, by Application 2020 & 2033
- Table 52: China Animal Diagnostics Industry Volume (K Unit) Forecast, by Application 2020 & 2033
- Table 53: Japan Animal Diagnostics Industry Revenue (Million) Forecast, by Application 2020 & 2033
- Table 54: Japan Animal Diagnostics Industry Volume (K Unit) Forecast, by Application 2020 & 2033
- Table 55: India Animal Diagnostics Industry Revenue (Million) Forecast, by Application 2020 & 2033
- Table 56: India Animal Diagnostics Industry Volume (K Unit) Forecast, by Application 2020 & 2033
- Table 57: Australia Animal Diagnostics Industry Revenue (Million) Forecast, by Application 2020 & 2033
- Table 58: Australia Animal Diagnostics Industry Volume (K Unit) Forecast, by Application 2020 & 2033
- Table 59: South Korea Animal Diagnostics Industry Revenue (Million) Forecast, by Application 2020 & 2033
- Table 60: South Korea Animal Diagnostics Industry Volume (K Unit) Forecast, by Application 2020 & 2033
- Table 61: Rest of Asia Pacific Animal Diagnostics Industry Revenue (Million) Forecast, by Application 2020 & 2033
- Table 62: Rest of Asia Pacific Animal Diagnostics Industry Volume (K Unit) Forecast, by Application 2020 & 2033
- Table 63: Global Animal Diagnostics Industry Revenue Million Forecast, by Animals 2020 & 2033
- Table 64: Global Animal Diagnostics Industry Volume K Unit Forecast, by Animals 2020 & 2033
- Table 65: Global Animal Diagnostics Industry Revenue Million Forecast, by Application 2020 & 2033
- Table 66: Global Animal Diagnostics Industry Volume K Unit Forecast, by Application 2020 & 2033
- Table 67: Global Animal Diagnostics Industry Revenue Million Forecast, by Technology 2020 & 2033
- Table 68: Global Animal Diagnostics Industry Volume K Unit Forecast, by Technology 2020 & 2033
- Table 69: Global Animal Diagnostics Industry Revenue Million Forecast, by Country 2020 & 2033
- Table 70: Global Animal Diagnostics Industry Volume K Unit Forecast, by Country 2020 & 2033
- Table 71: GCC Animal Diagnostics Industry Revenue (Million) Forecast, by Application 2020 & 2033
- Table 72: GCC Animal Diagnostics Industry Volume (K Unit) Forecast, by Application 2020 & 2033
- Table 73: South Africa Animal Diagnostics Industry Revenue (Million) Forecast, by Application 2020 & 2033
- Table 74: South Africa Animal Diagnostics Industry Volume (K Unit) Forecast, by Application 2020 & 2033
- Table 75: Rest of Middle East and Africa Animal Diagnostics Industry Revenue (Million) Forecast, by Application 2020 & 2033
- Table 76: Rest of Middle East and Africa Animal Diagnostics Industry Volume (K Unit) Forecast, by Application 2020 & 2033
- Table 77: Global Animal Diagnostics Industry Revenue Million Forecast, by Animals 2020 & 2033
- Table 78: Global Animal Diagnostics Industry Volume K Unit Forecast, by Animals 2020 & 2033
- Table 79: Global Animal Diagnostics Industry Revenue Million Forecast, by Application 2020 & 2033
- Table 80: Global Animal Diagnostics Industry Volume K Unit Forecast, by Application 2020 & 2033
- Table 81: Global Animal Diagnostics Industry Revenue Million Forecast, by Technology 2020 & 2033
- Table 82: Global Animal Diagnostics Industry Volume K Unit Forecast, by Technology 2020 & 2033
- Table 83: Global Animal Diagnostics Industry Revenue Million Forecast, by Country 2020 & 2033
- Table 84: Global Animal Diagnostics Industry Volume K Unit Forecast, by Country 2020 & 2033
- Table 85: Brazil Animal Diagnostics Industry Revenue (Million) Forecast, by Application 2020 & 2033
- Table 86: Brazil Animal Diagnostics Industry Volume (K Unit) Forecast, by Application 2020 & 2033
- Table 87: Argentina Animal Diagnostics Industry Revenue (Million) Forecast, by Application 2020 & 2033
- Table 88: Argentina Animal Diagnostics Industry Volume (K Unit) Forecast, by Application 2020 & 2033
- Table 89: Rest of South America Animal Diagnostics Industry Revenue (Million) Forecast, by Application 2020 & 2033
- Table 90: Rest of South America Animal Diagnostics Industry Volume (K Unit) Forecast, by Application 2020 & 2033
Frequently Asked Questions
1. What is the projected Compound Annual Growth Rate (CAGR) of the Animal Diagnostics Industry?
The projected CAGR is approximately 10.00%.
2. Which companies are prominent players in the Animal Diagnostics Industry?
Key companies in the market include Heska Corporation, Innovative Diagnostics (IDvet), Zoetis Inc , IDEXX Laboratories Inc, BioMerieux SA, Randox Laboratories Ltd, Chembio Diagnostic Systems Inc, Thermo Fisher Scientific Inc, Indical Bioscience GmbH, Creative Diagnostics, Agrolabo SpA, Virbac, Neogen Corporation.
3. What are the main segments of the Animal Diagnostics Industry?
The market segments include Animals, Application, Technology.
4. Can you provide details about the market size?
The market size is estimated to be USD 3.11 Million as of 2022.
5. What are some drivers contributing to market growth?
Rising Demand for Pet Insurance; Growth in the Companion Animal Population; Increasing Number of Veterinary Practitioners in Developed Economies.
6. What are the notable trends driving market growth?
Molecular Diagnostics is Expected to Witness Growth Over the Forecast Period.
7. Are there any restraints impacting market growth?
Rising Burden of the Pet Care Cost.
8. Can you provide examples of recent developments in the market?
August 2022: PepiPets launched a new mobile diagnostic testing service allowing clients to receive diagnostic testing at home for their pets.
9. What pricing options are available for accessing the report?
Pricing options include single-user, multi-user, and enterprise licenses priced at USD 4750, USD 5250, and USD 8750 respectively.
10. Is the market size provided in terms of value or volume?
The market size is provided in terms of value, measured in Million and volume, measured in K Unit.
11. Are there any specific market keywords associated with the report?
Yes, the market keyword associated with the report is "Animal Diagnostics Industry," which aids in identifying and referencing the specific market segment covered.
12. How do I determine which pricing option suits my needs best?
The pricing options vary based on user requirements and access needs. Individual users may opt for single-user licenses, while businesses requiring broader access may choose multi-user or enterprise licenses for cost-effective access to the report.
13. Are there any additional resources or data provided in the Animal Diagnostics Industry report?
While the report offers comprehensive insights, it's advisable to review the specific contents or supplementary materials provided to ascertain if additional resources or data are available.
14. How can I stay updated on further developments or reports in the Animal Diagnostics Industry?
To stay informed about further developments, trends, and reports in the Animal Diagnostics Industry, consider subscribing to industry newsletters, following relevant companies and organizations, or regularly checking reputable industry news sources and publications.
Methodology
Step 1 - Identification of Relevant Samples Size from Population Database


Step 2 - Approaches for Defining Global Market Size (Value, Volume* & Price*)

Note*: In applicable scenarios
Step 3 - Data Sources
Primary Research
- Web Analytics
- Survey Reports
- Research Institute
- Latest Research Reports
- Opinion Leaders
Secondary Research
- Annual Reports
- White Paper
- Latest Press Release
- Industry Association
- Paid Database
- Investor Presentations

Step 4 - Data Triangulation
Involves using different sources of information in order to increase the validity of a study
These sources are likely to be stakeholders in a program - participants, other researchers, program staff, other community members, and so on.
Then we put all data in single framework & apply various statistical tools to find out the dynamic on the market.
During the analysis stage, feedback from the stakeholder groups would be compared to determine areas of agreement as well as areas of divergence