

Key Insights
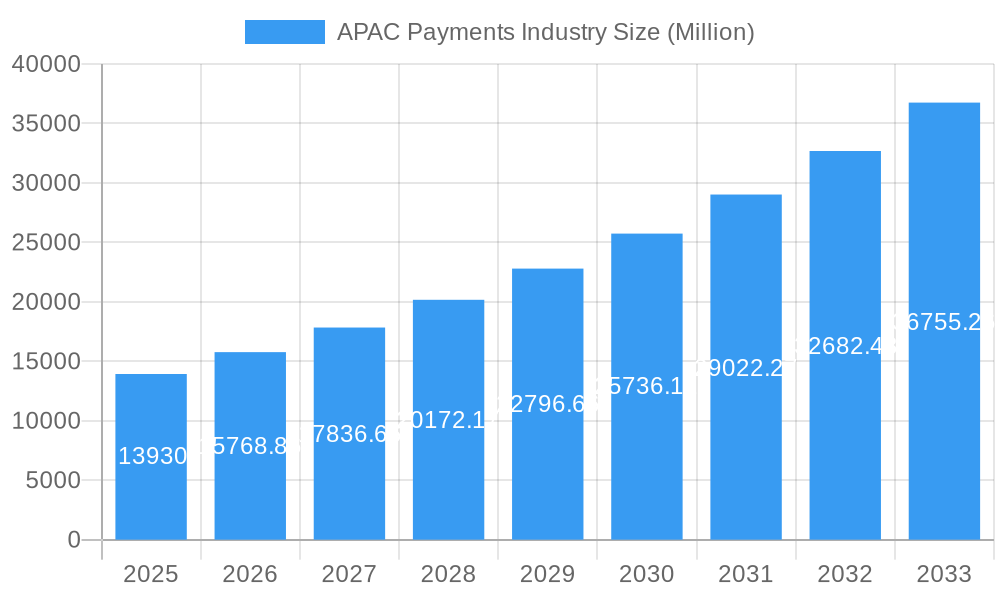
The Asia-Pacific (APAC) payments industry is experiencing robust growth, projected to reach a market size of $13.93 billion in 2025 and maintain a Compound Annual Growth Rate (CAGR) of 13.32% from 2025 to 2033. This expansion is fueled by several key factors. The region's burgeoning digital economy, coupled with increasing smartphone penetration and internet access, is driving the adoption of digital payment methods. E-commerce is booming across APAC, particularly in countries like China and India, significantly contributing to the growth of online payment platforms. Furthermore, the rise of fintech companies and innovative payment solutions, such as mobile wallets and Buy Now Pay Later (BNPL) services, is disrupting traditional payment systems and creating new opportunities. Government initiatives promoting digital financial inclusion are also playing a significant role in expanding the market. Key players such as Alipay, WeChat Pay, GrabPay, and others are aggressively competing and expanding their market share through strategic partnerships and technological advancements. The industry is segmented by payment mode (offline vs. online), end-user industry (retail, entertainment, healthcare, hospitality), and country, showcasing diverse growth trajectories across the region. Specific country markets are characterized by varied regulatory environments, consumer preferences, and levels of digital literacy.
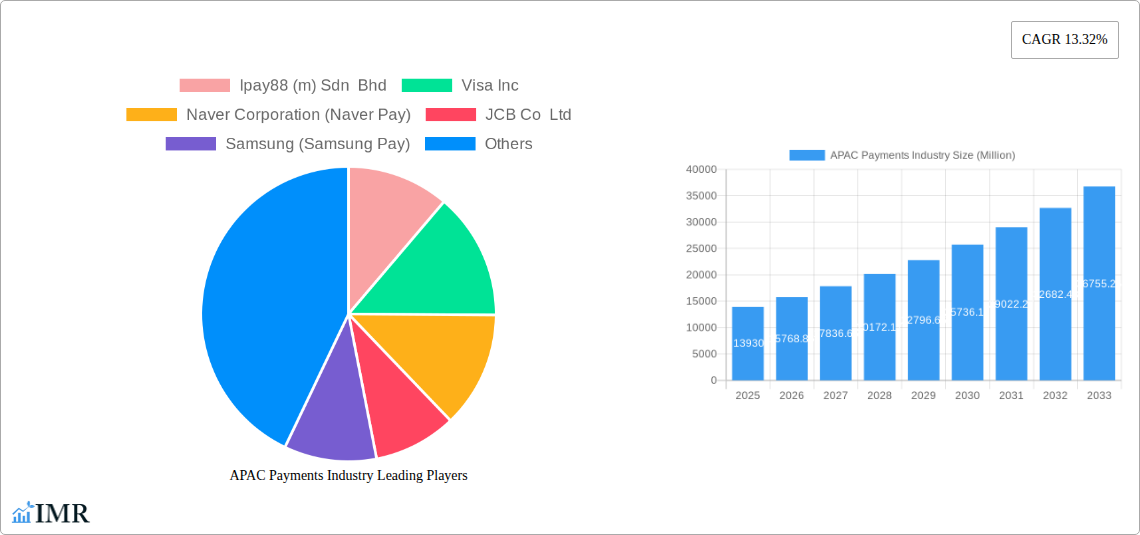
APAC Payments Industry Market Size (In Billion)
The competitive landscape is highly dynamic, with both established players like Visa and Mastercard, and innovative fintech companies vying for dominance. The growth isn't uniform across all segments and countries; for example, countries with higher levels of financial inclusion and digital adoption exhibit more rapid growth. Challenges remain, including addressing cybersecurity concerns, maintaining data privacy, and adapting to evolving regulatory frameworks. However, the long-term outlook for the APAC payments industry remains extremely positive, driven by sustained economic growth, increasing consumer spending, and ongoing technological innovations. The market's diverse structure, coupled with its considerable growth potential, presents lucrative investment opportunities for both established and emerging players.
APAC Payments Industry Company Market Share
APAC Payments Industry Market Report: 2019-2033
This comprehensive report provides a detailed analysis of the Asia-Pacific (APAC) payments industry, covering the period from 2019 to 2033. With a focus on key market segments, dominant players, and emerging trends, this report is an invaluable resource for industry professionals, investors, and strategic decision-makers. The study utilizes a robust methodology, incorporating historical data (2019-2024), a base year of 2025, and forecasts extending to 2033. The total market size is projected to reach xx Million by 2033, exhibiting a CAGR of xx%.
APAC Payments Industry Market Dynamics & Structure
The APAC payments landscape is characterized by high growth, intense competition, and rapid technological advancements. Market concentration varies significantly across countries, with some dominated by a few large players while others exhibit a more fragmented structure. China and India, representing substantial market share, show contrasting dynamics due to differing regulatory environments and technological adoption rates. Innovation is driven by the need for enhanced security, improved user experience, and the integration of emerging technologies such as AI and blockchain. Regulatory frameworks, while evolving, often lag behind technological advancements, creating both opportunities and challenges for market participants. The industry witnesses frequent mergers and acquisitions (M&A), particularly among fintech companies seeking scale and expansion.
- Market Concentration: Highly fragmented in several Southeast Asian nations, with increasing consolidation in major markets like China and India. Market share data for major players (Visa, Mastercard, Alipay, etc.) will be provided in the full report.
- Technological Innovation: Key drivers include mobile payments, digital wallets, and real-time payment systems.
- Regulatory Frameworks: Differ widely across countries, impacting market entry and operational strategies. Variations in data privacy regulations also influence market development.
- Competitive Product Substitutes: Traditional banking services face challenges from the rise of fintech players offering alternative payment methods.
- End-user Demographics: A young, tech-savvy population fuels the adoption of digital payments, particularly in urban areas.
- M&A Trends: A high volume of M&A activity observed, particularly in the fintech sector (xx deals in the last 5 years, with a total value of xx Million).
APAC Payments Industry Growth Trends & Insights
The APAC payments market experienced significant growth during the historical period (2019-2024), driven by factors such as rising smartphone penetration, increasing internet connectivity, and favorable government initiatives. The online payments segment, particularly e-commerce transactions, showed particularly strong growth, contributing significantly to the overall market expansion. The adoption of mobile wallets and digital payment platforms has accelerated, particularly in countries with high mobile penetration rates, reshaping consumer behavior. Technological disruptions, including the rise of super apps and embedded finance, have further fueled market expansion. Future growth will be impacted by factors like infrastructure development, financial inclusion initiatives, and evolving consumer preferences. The full report provides detailed CAGR and market penetration data for various segments.
Dominant Regions, Countries, or Segments in APAC Payments Industry
China and India dominate the APAC payments market in terms of sheer volume. However, other countries like South Korea, Singapore, and Japan show high per capita usage and advanced technological adoption. The online sales (e-commerce) segment demonstrates the most significant growth, driven by the booming e-commerce sector across the region. The retail sector remains the largest end-user industry for payment transactions.
- By Country: China and India lead in terms of total transaction volume. Singapore and South Korea lead in per capita transaction value and digital adoption rates.
- By Mode of Payment: Online payments (e-commerce) demonstrate faster growth than offline (point-of-sale) transactions.
- By End-user Industry: Retail accounts for the largest share, followed by the entertainment and hospitality sectors.
APAC Payments Industry Product Landscape
The APAC payments market offers a diverse range of products and services, including mobile wallets, digital payment platforms, and integrated payment gateways. Innovations include biometric authentication, AI-powered fraud detection, and blockchain-based solutions enhancing security and efficiency. Many platforms offer unique selling propositions, such as loyalty programs, cashback offers, and seamless integration with other financial services. Technological advancements such as open banking and embedded finance are transforming the payments landscape.
Key Drivers, Barriers & Challenges in APAC Payments Industry
Key Drivers: Rising smartphone penetration, increasing internet and mobile connectivity, government initiatives promoting digital payments, and the expanding e-commerce sector are key drivers.
Key Challenges: Regulatory uncertainty in certain markets, security concerns related to data breaches and fraud, and infrastructure limitations in certain regions pose significant challenges. Competition from established players and new entrants also creates pressure on profit margins. The estimated impact of these challenges on market growth is projected to be xx Million annually.
Emerging Opportunities in APAC Payments Industry
Untapped markets in rural areas, the growing popularity of buy-now-pay-later (BNPL) services, and the increasing demand for cross-border payments present significant opportunities. The integration of fintech solutions into other industries, such as healthcare and education, also offers substantial potential.
Growth Accelerators in the APAC Payments Industry
Technological advancements such as AI, blockchain, and open banking are driving growth. Strategic partnerships between fintech companies and traditional financial institutions are fostering innovation. Expanding into untapped markets and leveraging the growth of e-commerce will accelerate market expansion.
Key Players Shaping the APAC Payments Industry Market
- Ipay88 (m) Sdn Bhd
- Visa Inc
- Naver Corporation (Naver Pay)
- JCB Co Ltd
- Samsung (Samsung Pay)
- Huawei Pay (Huawei Technologies Co Limited)
- Matercard Inc
- Smile Pay
- Toss Financial Services Private Limited
- American Express Company
- Grab Pay (grab Holdings Limited)
- PayCo (NHN Corp)
- Paypal Holdings Inc
- Google Pay (Alphabet Inc)
- kakaopay Corp
Notable Milestones in APAC Payments Industry Sector
- October 2023: The linkage of India's UPI and Singapore's PayNow expands cross-border digital payment options. Six Indian banks (Indian Bank, Axis Bank, Bank of Baroda, DBS Bank India, ICICI Bank, Indian Overseas Bank, and State Bank of India) participate in this initiative.
- July 2023: Razorpay launches its international payment gateway via Curlec in Malaysia, aiming for RM10 Bn in annualized GTV by 2025.
In-Depth APAC Payments Industry Market Outlook
The APAC payments industry is poised for continued strong growth, driven by technological advancements, expanding digital adoption, and supportive government policies. Strategic partnerships, expansion into underserved markets, and the development of innovative payment solutions will further shape the market's evolution. The market's potential for growth is significant, with opportunities for both established players and emerging fintech companies.
APAC Payments Industry Segmentation
-
1. Mode of Payment
-
1.1. Offline (Point of Sale)
- 1.1.1. Card Pay
- 1.1.2. Digital Wallets (includes mobile wallets)
- 1.1.3. Cash
- 1.1.4. Other Modes of Payment
-
1.2. Online Sale (E-commerce)
- 1.2.1. Other Mo
-
1.1. Offline (Point of Sale)
-
2. End-user Industry
- 2.1. Retail
- 2.2. Entertainment
- 2.3. Healthcare
- 2.4. Hospitality
- 2.5. Other End-user Industries
APAC Payments Industry Segmentation By Geography
-
1. North America
- 1.1. United States
- 1.2. Canada
- 1.3. Mexico
-
2. South America
- 2.1. Brazil
- 2.2. Argentina
- 2.3. Rest of South America
-
3. Europe
- 3.1. United Kingdom
- 3.2. Germany
- 3.3. France
- 3.4. Italy
- 3.5. Spain
- 3.6. Russia
- 3.7. Benelux
- 3.8. Nordics
- 3.9. Rest of Europe
-
4. Middle East & Africa
- 4.1. Turkey
- 4.2. Israel
- 4.3. GCC
- 4.4. North Africa
- 4.5. South Africa
- 4.6. Rest of Middle East & Africa
-
5. Asia Pacific
- 5.1. China
- 5.2. India
- 5.3. Japan
- 5.4. South Korea
- 5.5. ASEAN
- 5.6. Oceania
- 5.7. Rest of Asia Pacific
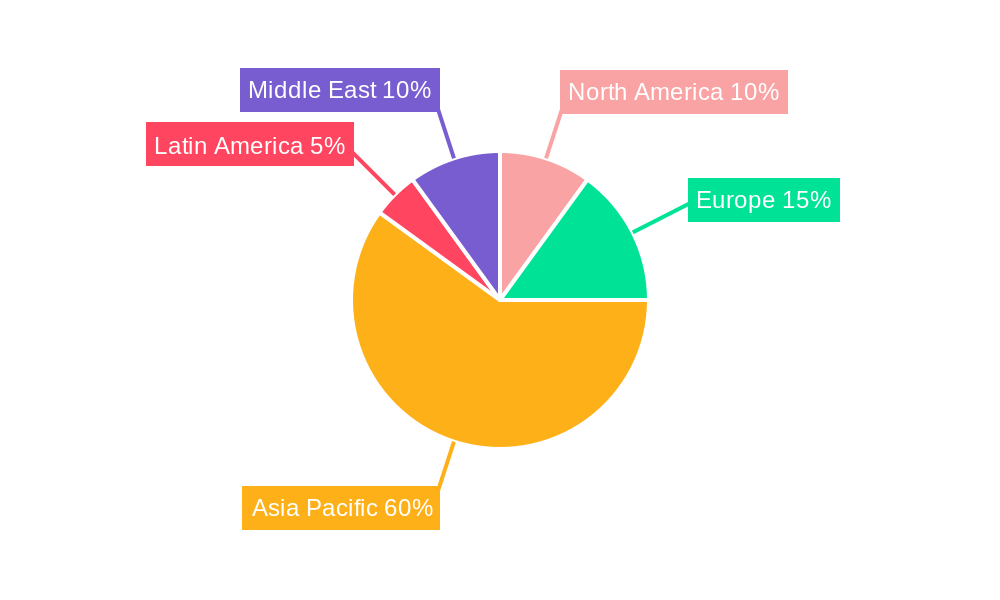
APAC Payments Industry Regional Market Share
Geographic Coverage of APAC Payments Industry
APAC Payments Industry REPORT HIGHLIGHTS
| Aspects | Details |
|---|---|
| Study Period | 2020-2034 |
| Base Year | 2025 |
| Estimated Year | 2026 |
| Forecast Period | 2026-2034 |
| Historical Period | 2020-2025 |
| Growth Rate | CAGR of 13.32% from 2020-2034 |
| Segmentation |
|
Table of Contents
- 1. Introduction
- 1.1. Research Scope
- 1.2. Market Segmentation
- 1.3. Research Objective
- 1.4. Definitions and Assumptions
- 2. Executive Summary
- 2.1. Market Snapshot
- 3. Market Dynamics
- 3.1. Market Drivers
- 3.2. Market Restrains
- 3.3. Market Trends
- 3.4. Market Opportunities
- 4. Market Factor Analysis
- 4.1. Porters Five Forces
- 4.1.1. Bargaining Power of Suppliers
- 4.1.2. Bargaining Power of Buyers
- 4.1.3. Threat of New Entrants
- 4.1.4. Threat of Substitutes
- 4.1.5. Competitive Rivalry
- 4.2. PESTEL analysis
- 4.3. BCG Analysis
- 4.3.1. Stars (High Growth, High Market Share)
- 4.3.2. Cash Cows (Low Growth, High Market Share)
- 4.3.3. Question Mark (High Growth, Low Market Share)
- 4.3.4. Dogs (Low Growth, Low Market Share)
- 4.4. Ansoff Matrix Analysis
- 4.5. Supply Chain Analysis
- 4.6. Regulatory Landscape
- 4.7. Current Market Potential and Opportunity Assessment (TAM–SAM–SOM Framework)
- 4.8. IMR Analyst Note
- 4.1. Porters Five Forces
- 5. Market Analysis, Insights and Forecast 2021-2033
- 5.1. Market Analysis, Insights and Forecast - by Mode of Payment
- 5.1.1. Offline (Point of Sale)
- 5.1.1.1. Card Pay
- 5.1.1.2. Digital Wallets (includes mobile wallets)
- 5.1.1.3. Cash
- 5.1.1.4. Other Modes of Payment
- 5.1.2. Online Sale (E-commerce)
- 5.1.2.1. Other Mo
- 5.1.1. Offline (Point of Sale)
- 5.2. Market Analysis, Insights and Forecast - by End-user Industry
- 5.2.1. Retail
- 5.2.2. Entertainment
- 5.2.3. Healthcare
- 5.2.4. Hospitality
- 5.2.5. Other End-user Industries
- 5.3. Market Analysis, Insights and Forecast - by Region
- 5.3.1. North America
- 5.3.2. South America
- 5.3.3. Europe
- 5.3.4. Middle East & Africa
- 5.3.5. Asia Pacific
- 5.1. Market Analysis, Insights and Forecast - by Mode of Payment
- 6. Global APAC Payments Industry Analysis, Insights and Forecast, 2021-2033
- 6.1. Market Analysis, Insights and Forecast - by Mode of Payment
- 6.1.1. Offline (Point of Sale)
- 6.1.1.1. Card Pay
- 6.1.1.2. Digital Wallets (includes mobile wallets)
- 6.1.1.3. Cash
- 6.1.1.4. Other Modes of Payment
- 6.1.2. Online Sale (E-commerce)
- 6.1.2.1. Other Mo
- 6.1.1. Offline (Point of Sale)
- 6.2. Market Analysis, Insights and Forecast - by End-user Industry
- 6.2.1. Retail
- 6.2.2. Entertainment
- 6.2.3. Healthcare
- 6.2.4. Hospitality
- 6.2.5. Other End-user Industries
- 6.1. Market Analysis, Insights and Forecast - by Mode of Payment
- 7. North America APAC Payments Industry Analysis, Insights and Forecast, 2020-2032
- 7.1. Market Analysis, Insights and Forecast - by Mode of Payment
- 7.1.1. Offline (Point of Sale)
- 7.1.1.1. Card Pay
- 7.1.1.2. Digital Wallets (includes mobile wallets)
- 7.1.1.3. Cash
- 7.1.1.4. Other Modes of Payment
- 7.1.2. Online Sale (E-commerce)
- 7.1.2.1. Other Mo
- 7.1.1. Offline (Point of Sale)
- 7.2. Market Analysis, Insights and Forecast - by End-user Industry
- 7.2.1. Retail
- 7.2.2. Entertainment
- 7.2.3. Healthcare
- 7.2.4. Hospitality
- 7.2.5. Other End-user Industries
- 7.1. Market Analysis, Insights and Forecast - by Mode of Payment
- 8. South America APAC Payments Industry Analysis, Insights and Forecast, 2020-2032
- 8.1. Market Analysis, Insights and Forecast - by Mode of Payment
- 8.1.1. Offline (Point of Sale)
- 8.1.1.1. Card Pay
- 8.1.1.2. Digital Wallets (includes mobile wallets)
- 8.1.1.3. Cash
- 8.1.1.4. Other Modes of Payment
- 8.1.2. Online Sale (E-commerce)
- 8.1.2.1. Other Mo
- 8.1.1. Offline (Point of Sale)
- 8.2. Market Analysis, Insights and Forecast - by End-user Industry
- 8.2.1. Retail
- 8.2.2. Entertainment
- 8.2.3. Healthcare
- 8.2.4. Hospitality
- 8.2.5. Other End-user Industries
- 8.1. Market Analysis, Insights and Forecast - by Mode of Payment
- 9. Europe APAC Payments Industry Analysis, Insights and Forecast, 2020-2032
- 9.1. Market Analysis, Insights and Forecast - by Mode of Payment
- 9.1.1. Offline (Point of Sale)
- 9.1.1.1. Card Pay
- 9.1.1.2. Digital Wallets (includes mobile wallets)
- 9.1.1.3. Cash
- 9.1.1.4. Other Modes of Payment
- 9.1.2. Online Sale (E-commerce)
- 9.1.2.1. Other Mo
- 9.1.1. Offline (Point of Sale)
- 9.2. Market Analysis, Insights and Forecast - by End-user Industry
- 9.2.1. Retail
- 9.2.2. Entertainment
- 9.2.3. Healthcare
- 9.2.4. Hospitality
- 9.2.5. Other End-user Industries
- 9.1. Market Analysis, Insights and Forecast - by Mode of Payment
- 10. Middle East & Africa APAC Payments Industry Analysis, Insights and Forecast, 2020-2032
- 10.1. Market Analysis, Insights and Forecast - by Mode of Payment
- 10.1.1. Offline (Point of Sale)
- 10.1.1.1. Card Pay
- 10.1.1.2. Digital Wallets (includes mobile wallets)
- 10.1.1.3. Cash
- 10.1.1.4. Other Modes of Payment
- 10.1.2. Online Sale (E-commerce)
- 10.1.2.1. Other Mo
- 10.1.1. Offline (Point of Sale)
- 10.2. Market Analysis, Insights and Forecast - by End-user Industry
- 10.2.1. Retail
- 10.2.2. Entertainment
- 10.2.3. Healthcare
- 10.2.4. Hospitality
- 10.2.5. Other End-user Industries
- 10.1. Market Analysis, Insights and Forecast - by Mode of Payment
- 11. Asia Pacific APAC Payments Industry Analysis, Insights and Forecast, 2020-2032
- 11.1. Market Analysis, Insights and Forecast - by Mode of Payment
- 11.1.1. Offline (Point of Sale)
- 11.1.1.1. Card Pay
- 11.1.1.2. Digital Wallets (includes mobile wallets)
- 11.1.1.3. Cash
- 11.1.1.4. Other Modes of Payment
- 11.1.2. Online Sale (E-commerce)
- 11.1.2.1. Other Mo
- 11.1.1. Offline (Point of Sale)
- 11.2. Market Analysis, Insights and Forecast - by End-user Industry
- 11.2.1. Retail
- 11.2.2. Entertainment
- 11.2.3. Healthcare
- 11.2.4. Hospitality
- 11.2.5. Other End-user Industries
- 11.1. Market Analysis, Insights and Forecast - by Mode of Payment
- 12. Competitive Analysis
- 12.1. Company Profiles
- 12.1.1 Ipay88 (m) Sdn Bhd
- 12.1.1.1. Company Overview
- 12.1.1.2. Products
- 12.1.1.3. Company Financials
- 12.1.1.4. SWOT Analysis
- 12.1.2 Visa Inc
- 12.1.2.1. Company Overview
- 12.1.2.2. Products
- 12.1.2.3. Company Financials
- 12.1.2.4. SWOT Analysis
- 12.1.3 Naver Corporation (Naver Pay)
- 12.1.3.1. Company Overview
- 12.1.3.2. Products
- 12.1.3.3. Company Financials
- 12.1.3.4. SWOT Analysis
- 12.1.4 JCB Co Ltd
- 12.1.4.1. Company Overview
- 12.1.4.2. Products
- 12.1.4.3. Company Financials
- 12.1.4.4. SWOT Analysis
- 12.1.5 Samsung (Samsung Pay)
- 12.1.5.1. Company Overview
- 12.1.5.2. Products
- 12.1.5.3. Company Financials
- 12.1.5.4. SWOT Analysis
- 12.1.6 Huawei Pay (Huawei Technologies Co Limited*List Not Exhaustive
- 12.1.6.1. Company Overview
- 12.1.6.2. Products
- 12.1.6.3. Company Financials
- 12.1.6.4. SWOT Analysis
- 12.1.7 Matercard Inc
- 12.1.7.1. Company Overview
- 12.1.7.2. Products
- 12.1.7.3. Company Financials
- 12.1.7.4. SWOT Analysis
- 12.1.8 Smile Pay
- 12.1.8.1. Company Overview
- 12.1.8.2. Products
- 12.1.8.3. Company Financials
- 12.1.8.4. SWOT Analysis
- 12.1.9 Toss Financial Services Private Limited
- 12.1.9.1. Company Overview
- 12.1.9.2. Products
- 12.1.9.3. Company Financials
- 12.1.9.4. SWOT Analysis
- 12.1.10 American Express Company
- 12.1.10.1. Company Overview
- 12.1.10.2. Products
- 12.1.10.3. Company Financials
- 12.1.10.4. SWOT Analysis
- 12.1.11 Grab Pay (grab Holdings Limited)
- 12.1.11.1. Company Overview
- 12.1.11.2. Products
- 12.1.11.3. Company Financials
- 12.1.11.4. SWOT Analysis
- 12.1.12 Samsung Pay (Samsung Electronics Co ltd)
- 12.1.12.1. Company Overview
- 12.1.12.2. Products
- 12.1.12.3. Company Financials
- 12.1.12.4. SWOT Analysis
- 12.1.13 PayCo (NHN Corp )
- 12.1.13.1. Company Overview
- 12.1.13.2. Products
- 12.1.13.3. Company Financials
- 12.1.13.4. SWOT Analysis
- 12.1.14 Paypal Holdings Inc
- 12.1.14.1. Company Overview
- 12.1.14.2. Products
- 12.1.14.3. Company Financials
- 12.1.14.4. SWOT Analysis
- 12.1.15 Google Pay (Alphabet Inc )
- 12.1.15.1. Company Overview
- 12.1.15.2. Products
- 12.1.15.3. Company Financials
- 12.1.15.4. SWOT Analysis
- 12.1.16 kakaopay Corp
- 12.1.16.1. Company Overview
- 12.1.16.2. Products
- 12.1.16.3. Company Financials
- 12.1.16.4. SWOT Analysis
- 12.1.1 Ipay88 (m) Sdn Bhd
- 12.2. Market Entropy
- 12.2.1 Company's Key Areas Served
- 12.2.2 Recent Developments
- 12.3. Company Market Share Analysis 2025
- 12.3.1 Top 5 Companies Market Share Analysis
- 12.3.2 Top 3 Companies Market Share Analysis
- 12.4. List of Potential Customers
- 13. Research Methodology
List of Figures
- Figure 1: Global APAC Payments Industry Revenue Breakdown (Million, %) by Region 2025 & 2033
- Figure 2: North America APAC Payments Industry Revenue (Million), by Mode of Payment 2025 & 2033
- Figure 3: North America APAC Payments Industry Revenue Share (%), by Mode of Payment 2025 & 2033
- Figure 4: North America APAC Payments Industry Revenue (Million), by End-user Industry 2025 & 2033
- Figure 5: North America APAC Payments Industry Revenue Share (%), by End-user Industry 2025 & 2033
- Figure 6: North America APAC Payments Industry Revenue (Million), by Country 2025 & 2033
- Figure 7: North America APAC Payments Industry Revenue Share (%), by Country 2025 & 2033
- Figure 8: South America APAC Payments Industry Revenue (Million), by Mode of Payment 2025 & 2033
- Figure 9: South America APAC Payments Industry Revenue Share (%), by Mode of Payment 2025 & 2033
- Figure 10: South America APAC Payments Industry Revenue (Million), by End-user Industry 2025 & 2033
- Figure 11: South America APAC Payments Industry Revenue Share (%), by End-user Industry 2025 & 2033
- Figure 12: South America APAC Payments Industry Revenue (Million), by Country 2025 & 2033
- Figure 13: South America APAC Payments Industry Revenue Share (%), by Country 2025 & 2033
- Figure 14: Europe APAC Payments Industry Revenue (Million), by Mode of Payment 2025 & 2033
- Figure 15: Europe APAC Payments Industry Revenue Share (%), by Mode of Payment 2025 & 2033
- Figure 16: Europe APAC Payments Industry Revenue (Million), by End-user Industry 2025 & 2033
- Figure 17: Europe APAC Payments Industry Revenue Share (%), by End-user Industry 2025 & 2033
- Figure 18: Europe APAC Payments Industry Revenue (Million), by Country 2025 & 2033
- Figure 19: Europe APAC Payments Industry Revenue Share (%), by Country 2025 & 2033
- Figure 20: Middle East & Africa APAC Payments Industry Revenue (Million), by Mode of Payment 2025 & 2033
- Figure 21: Middle East & Africa APAC Payments Industry Revenue Share (%), by Mode of Payment 2025 & 2033
- Figure 22: Middle East & Africa APAC Payments Industry Revenue (Million), by End-user Industry 2025 & 2033
- Figure 23: Middle East & Africa APAC Payments Industry Revenue Share (%), by End-user Industry 2025 & 2033
- Figure 24: Middle East & Africa APAC Payments Industry Revenue (Million), by Country 2025 & 2033
- Figure 25: Middle East & Africa APAC Payments Industry Revenue Share (%), by Country 2025 & 2033
- Figure 26: Asia Pacific APAC Payments Industry Revenue (Million), by Mode of Payment 2025 & 2033
- Figure 27: Asia Pacific APAC Payments Industry Revenue Share (%), by Mode of Payment 2025 & 2033
- Figure 28: Asia Pacific APAC Payments Industry Revenue (Million), by End-user Industry 2025 & 2033
- Figure 29: Asia Pacific APAC Payments Industry Revenue Share (%), by End-user Industry 2025 & 2033
- Figure 30: Asia Pacific APAC Payments Industry Revenue (Million), by Country 2025 & 2033
- Figure 31: Asia Pacific APAC Payments Industry Revenue Share (%), by Country 2025 & 2033
List of Tables
- Table 1: Global APAC Payments Industry Revenue Million Forecast, by Mode of Payment 2020 & 2033
- Table 2: Global APAC Payments Industry Revenue Million Forecast, by End-user Industry 2020 & 2033
- Table 3: Global APAC Payments Industry Revenue Million Forecast, by Region 2020 & 2033
- Table 4: Global APAC Payments Industry Revenue Million Forecast, by Mode of Payment 2020 & 2033
- Table 5: Global APAC Payments Industry Revenue Million Forecast, by End-user Industry 2020 & 2033
- Table 6: Global APAC Payments Industry Revenue Million Forecast, by Country 2020 & 2033
- Table 7: United States APAC Payments Industry Revenue (Million) Forecast, by Application 2020 & 2033
- Table 8: Canada APAC Payments Industry Revenue (Million) Forecast, by Application 2020 & 2033
- Table 9: Mexico APAC Payments Industry Revenue (Million) Forecast, by Application 2020 & 2033
- Table 10: Global APAC Payments Industry Revenue Million Forecast, by Mode of Payment 2020 & 2033
- Table 11: Global APAC Payments Industry Revenue Million Forecast, by End-user Industry 2020 & 2033
- Table 12: Global APAC Payments Industry Revenue Million Forecast, by Country 2020 & 2033
- Table 13: Brazil APAC Payments Industry Revenue (Million) Forecast, by Application 2020 & 2033
- Table 14: Argentina APAC Payments Industry Revenue (Million) Forecast, by Application 2020 & 2033
- Table 15: Rest of South America APAC Payments Industry Revenue (Million) Forecast, by Application 2020 & 2033
- Table 16: Global APAC Payments Industry Revenue Million Forecast, by Mode of Payment 2020 & 2033
- Table 17: Global APAC Payments Industry Revenue Million Forecast, by End-user Industry 2020 & 2033
- Table 18: Global APAC Payments Industry Revenue Million Forecast, by Country 2020 & 2033
- Table 19: United Kingdom APAC Payments Industry Revenue (Million) Forecast, by Application 2020 & 2033
- Table 20: Germany APAC Payments Industry Revenue (Million) Forecast, by Application 2020 & 2033
- Table 21: France APAC Payments Industry Revenue (Million) Forecast, by Application 2020 & 2033
- Table 22: Italy APAC Payments Industry Revenue (Million) Forecast, by Application 2020 & 2033
- Table 23: Spain APAC Payments Industry Revenue (Million) Forecast, by Application 2020 & 2033
- Table 24: Russia APAC Payments Industry Revenue (Million) Forecast, by Application 2020 & 2033
- Table 25: Benelux APAC Payments Industry Revenue (Million) Forecast, by Application 2020 & 2033
- Table 26: Nordics APAC Payments Industry Revenue (Million) Forecast, by Application 2020 & 2033
- Table 27: Rest of Europe APAC Payments Industry Revenue (Million) Forecast, by Application 2020 & 2033
- Table 28: Global APAC Payments Industry Revenue Million Forecast, by Mode of Payment 2020 & 2033
- Table 29: Global APAC Payments Industry Revenue Million Forecast, by End-user Industry 2020 & 2033
- Table 30: Global APAC Payments Industry Revenue Million Forecast, by Country 2020 & 2033
- Table 31: Turkey APAC Payments Industry Revenue (Million) Forecast, by Application 2020 & 2033
- Table 32: Israel APAC Payments Industry Revenue (Million) Forecast, by Application 2020 & 2033
- Table 33: GCC APAC Payments Industry Revenue (Million) Forecast, by Application 2020 & 2033
- Table 34: North Africa APAC Payments Industry Revenue (Million) Forecast, by Application 2020 & 2033
- Table 35: South Africa APAC Payments Industry Revenue (Million) Forecast, by Application 2020 & 2033
- Table 36: Rest of Middle East & Africa APAC Payments Industry Revenue (Million) Forecast, by Application 2020 & 2033
- Table 37: Global APAC Payments Industry Revenue Million Forecast, by Mode of Payment 2020 & 2033
- Table 38: Global APAC Payments Industry Revenue Million Forecast, by End-user Industry 2020 & 2033
- Table 39: Global APAC Payments Industry Revenue Million Forecast, by Country 2020 & 2033
- Table 40: China APAC Payments Industry Revenue (Million) Forecast, by Application 2020 & 2033
- Table 41: India APAC Payments Industry Revenue (Million) Forecast, by Application 2020 & 2033
- Table 42: Japan APAC Payments Industry Revenue (Million) Forecast, by Application 2020 & 2033
- Table 43: South Korea APAC Payments Industry Revenue (Million) Forecast, by Application 2020 & 2033
- Table 44: ASEAN APAC Payments Industry Revenue (Million) Forecast, by Application 2020 & 2033
- Table 45: Oceania APAC Payments Industry Revenue (Million) Forecast, by Application 2020 & 2033
- Table 46: Rest of Asia Pacific APAC Payments Industry Revenue (Million) Forecast, by Application 2020 & 2033
Frequently Asked Questions
1. What is the projected Compound Annual Growth Rate (CAGR) of the APAC Payments Industry?
The projected CAGR is approximately 13.32%.
2. Which companies are prominent players in the APAC Payments Industry?
Key companies in the market include Ipay88 (m) Sdn Bhd, Visa Inc, Naver Corporation (Naver Pay), JCB Co Ltd, Samsung (Samsung Pay), Huawei Pay (Huawei Technologies Co Limited*List Not Exhaustive, Matercard Inc, Smile Pay, Toss Financial Services Private Limited, American Express Company, Grab Pay (grab Holdings Limited), Samsung Pay (Samsung Electronics Co ltd), PayCo (NHN Corp ), Paypal Holdings Inc, Google Pay (Alphabet Inc ), kakaopay Corp.
3. What are the main segments of the APAC Payments Industry?
The market segments include Mode of Payment, End-user Industry.
4. Can you provide details about the market size?
The market size is estimated to be USD 13.93 Million as of 2022.
5. What are some drivers contributing to market growth?
High Proliferation of E-commerce and Rising Adoption of M-commerce; Enablement Programs by Key Retailers and Government Encouraging Digitization of the Market; Growing Adoption of Buy Now Pay Later in Asia-Pacific Countries.
6. What are the notable trends driving market growth?
Online sales segment to show higher growth.
7. Are there any restraints impacting market growth?
High Implementation and Maintenance Cost.
8. Can you provide examples of recent developments in the market?
October 2023, According to a statement made by the National Payments Corporation of India (NPCI), six Indian banks contributing to the arrangement are Indian Bank, Axis Bank, Bank, DBS Bank India, ICICI Indian Overseas Bank, as well as State Bank of India. India and Singapore are all set to increase the range of their digital payment link after they proclaimed the milestone linkage between India’s Unified Payments Interface (UPI) in addition to Singapore’s PayNow.
9. What pricing options are available for accessing the report?
Pricing options include single-user, multi-user, and enterprise licenses priced at USD 4750, USD 4950, and USD 6800 respectively.
10. Is the market size provided in terms of value or volume?
The market size is provided in terms of value, measured in Million.
11. Are there any specific market keywords associated with the report?
Yes, the market keyword associated with the report is "APAC Payments Industry," which aids in identifying and referencing the specific market segment covered.
12. How do I determine which pricing option suits my needs best?
The pricing options vary based on user requirements and access needs. Individual users may opt for single-user licenses, while businesses requiring broader access may choose multi-user or enterprise licenses for cost-effective access to the report.
13. Are there any additional resources or data provided in the APAC Payments Industry report?
While the report offers comprehensive insights, it's advisable to review the specific contents or supplementary materials provided to ascertain if additional resources or data are available.
14. How can I stay updated on further developments or reports in the APAC Payments Industry?
To stay informed about further developments, trends, and reports in the APAC Payments Industry, consider subscribing to industry newsletters, following relevant companies and organizations, or regularly checking reputable industry news sources and publications.
Methodology
Step 1 - Identification of Relevant Samples Size from Population Database


Step 2 - Approaches for Defining Global Market Size (Value, Volume* & Price*)

Note*: In applicable scenarios
Step 3 - Data Sources
Primary Research
- Web Analytics
- Survey Reports
- Research Institute
- Latest Research Reports
- Opinion Leaders
Secondary Research
- Annual Reports
- White Paper
- Latest Press Release
- Industry Association
- Paid Database
- Investor Presentations

Step 4 - Data Triangulation
Involves using different sources of information in order to increase the validity of a study
These sources are likely to be stakeholders in a program - participants, other researchers, program staff, other community members, and so on.
Then we put all data in single framework & apply various statistical tools to find out the dynamic on the market.
During the analysis stage, feedback from the stakeholder groups would be compared to determine areas of agreement as well as areas of divergence