

Key Insights
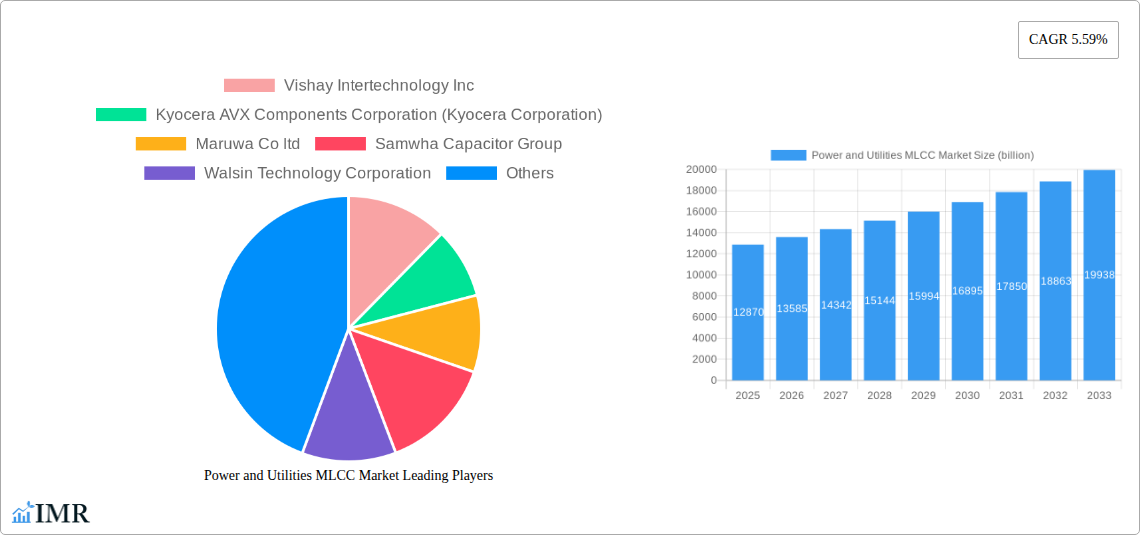
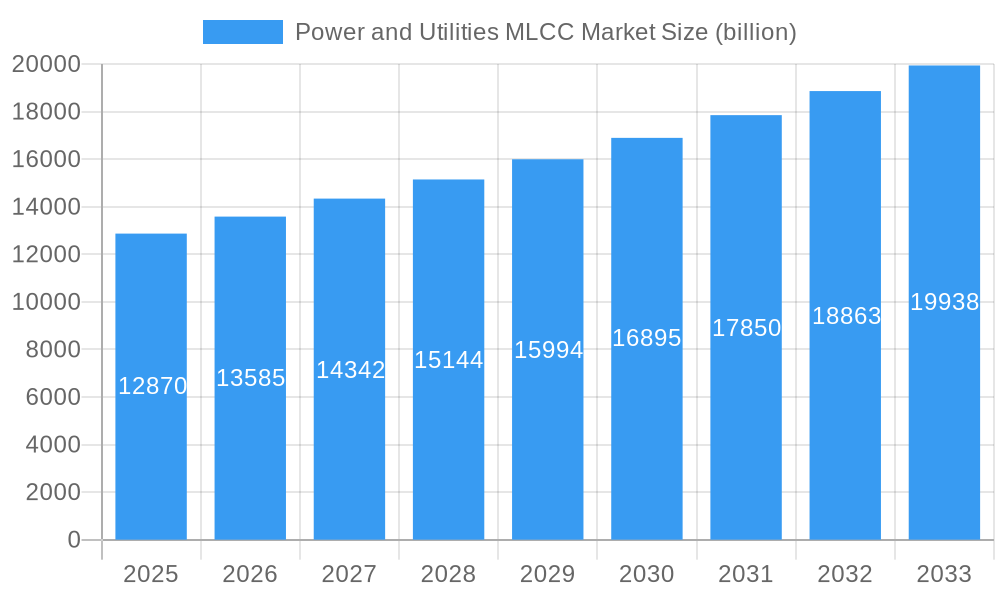
The Power and Utilities MLCC Market is poised for significant expansion, driven by the escalating demand for reliable and high-performance electronic components across the energy sector. With a current market size of approximately $12.87 billion in 2025, this market is projected to experience a robust Compound Annual Growth Rate (CAGR) of 5.59% through 2033. This growth is underpinned by the increasing adoption of advanced grid infrastructure, renewable energy integration, and the electrification of transportation, all of which rely heavily on sophisticated MLCCs for power management and signal integrity. The burgeoning need for efficient power conversion and robust filtering solutions in substations, solar farms, wind turbines, and electric vehicle charging stations directly fuels the demand for these versatile ceramic capacitors. Key market drivers include technological advancements in MLCC materials and manufacturing, leading to higher capacitance densities and improved voltage ratings, alongside stringent regulatory requirements for energy efficiency and grid stability.
Power and Utilities MLCC Market Market Size (In Billion)
The market landscape is characterized by a dynamic segmentation, with MLCCs categorized by case size (ranging from 1210 to 4540 and others), voltage ratings (less than 600V, 600V to 1100V, and more than 1100V), capacitance values (less than 10 μF, 10 μF to 100 μF, and more than 100 μF), and dielectric types (Class 1 and Class 2). The 600V to 1100V voltage range and capacitance values between 10 μF to 100 μF are anticipated to witness substantial growth due to their suitability for medium-voltage applications in renewable energy systems and smart grids. While the market presents considerable opportunities, potential restraints include the fluctuating costs of raw materials and intense competition among major global manufacturers such as Murata Manufacturing Co Ltd, TDK Corporation, and Samsung Electro-Mechanics. However, the continuous innovation in product development and the expanding applications in energy storage systems and smart grid technologies are expected to propel the Power and Utilities MLCC Market forward.
Power and Utilities MLCC Market Company Market Share
Power and Utilities MLCC Market: Comprehensive Report & Forecast (2019-2033)
Unlock insights into the dynamic Power and Utilities MLCC market. This detailed report analyzes market size, growth trends, dominant segments, and competitive strategies from 2019-2033, with a base year of 2025. Discover the impact of key players, technological advancements, and emerging opportunities shaping the future of this critical industry.
Keywords: Power MLCC, Utilities MLCC, MLCC Market, Ceramic Capacitor, Electronic Components, Power Electronics, Renewable Energy, Grid Modernization, Electric Vehicles, Industrial Automation, High Voltage MLCC, High Capacitance MLCC, SMD MLCC, X7R MLCC, X5R MLCC, Market Size, Market Share, CAGR, Forecast, Trends, Drivers, Challenges, Opportunities, Key Players, Vishay, Kyocera AVX, Murata, TDK, Yageo.
Power and Utilities MLCC Market Market Dynamics & Structure
The Power and Utilities MLCC market is characterized by a moderately concentrated structure, with a few key players holding significant market share, though the competitive landscape is evolving. Technological innovation is a primary driver, fueled by the increasing demand for higher voltage ratings, greater capacitance density, and enhanced reliability in demanding power applications. Regulatory frameworks, particularly those focused on grid modernization, renewable energy integration, and energy efficiency, indirectly influence MLCC adoption by setting standards for power quality and component performance. Competitive product substitutes, such as tantalum capacitors and film capacitors, exist but often fall short in areas like miniaturization, cost-effectiveness for high volumes, and high-frequency performance, where MLCCs excel. End-user demographics are shifting towards utilities investing in smart grid infrastructure, renewable energy farms (solar, wind), and the electrification of transportation, alongside industrial automation and advanced manufacturing sectors. Mergers and acquisitions (M&A) trends, while not as frequent as in broader electronics markets, indicate strategic moves by larger entities to consolidate market presence and acquire specialized technological capabilities. For instance, a recent acquisition of a niche MLCC manufacturer by a diversified electronic component supplier could be observed, aiming to bolster their portfolio in the high-growth power segment. Innovation barriers include the high capital expenditure required for advanced manufacturing processes and the stringent qualification procedures for components used in critical infrastructure.
Power and Utilities MLCC Market Growth Trends & Insights
The Power and Utilities MLCC market is poised for robust growth, driven by the global transition towards sustainable energy and the continuous expansion of industrial and consumer electronics. Over the historical period (2019-2024), the market has witnessed steady expansion, largely propelled by the increasing integration of renewable energy sources and the upgrading of existing power grids. The base year 2025 estimates the market size at approximately $5.5 billion units. The forecast period (2025–2033) anticipates a compound annual growth rate (CAGR) of approximately 6.5%, projecting the market to reach an estimated $9.2 billion units by the end of the forecast horizon. This growth is intrinsically linked to the escalating demand for high-voltage MLCCs, essential for managing the increased power flows in smart grids and for the efficient operation of renewable energy inverters and power conversion systems. Adoption rates of advanced MLCCs are accelerating as industries prioritize miniaturization, improved thermal performance, and higher reliability. Technological disruptions, such as the development of novel dielectric materials and advanced manufacturing techniques, are enabling MLCCs to meet increasingly stringent performance requirements. Consumer behavior shifts, particularly the growing acceptance and adoption of electric vehicles (EVs) and the demand for more energy-efficient appliances, are indirectly fueling the demand for power MLCCs used in their respective power management systems. The increasing complexity and miniaturization of power electronics across various sectors, from industrial automation to telecommunications, further contribute to the upward trajectory of the Power and Utilities MLCC market. The penetration of MLCCs in high-power applications continues to deepen as their performance-to-cost ratio improves, making them a preferred choice over traditional components for many new designs.
Dominant Regions, Countries, or Segments in Power and Utilities MLCC Market
Several regions and specific market segments are currently demonstrating significant dominance and are poised to drive the Power and Utilities MLCC market growth.
Dominant Region: Asia-Pacific is the undisputed leader in the Power and Utilities MLCC market.
- Key Drivers:
- Manufacturing Hub: The region's status as a global manufacturing powerhouse for electronic components, coupled with strong domestic demand, provides a robust foundation.
- Renewable Energy Investments: Countries like China, India, and South Korea are making substantial investments in solar, wind, and other renewable energy projects, necessitating a vast supply of power MLCCs for inverters, grid integration, and energy storage.
- Smart Grid Initiatives: Extensive government-backed smart grid development programs in China and other nations are a significant demand catalyst.
- Automotive Industry Growth: The burgeoning electric vehicle (EV) market in Asia, particularly in China, relies heavily on MLCCs for power management systems.
- Industrial Automation: Rapid industrialization and the adoption of Industry 4.0 technologies across Asia are driving demand for reliable power electronic components.
- Market Share & Growth Potential: Asia-Pacific accounts for an estimated 55% of the global Power and Utilities MLCC market share and is projected to maintain its lead, with a CAGR slightly above the global average.
- Key Drivers:
Dominant Segment: Within the Power and Utilities MLCC market, the Voltage: 600V to 1100V segment is exhibiting particularly strong growth and dominance.
- Key Drivers:
- Grid Modernization: The need to handle higher voltage levels in modern power grids for efficient transmission and distribution directly increases the demand for these higher-rated MLCCs.
- Renewable Energy Integration: High-voltage MLCCs are crucial for the inverters and converters used in large-scale solar and wind farms to step up voltage for grid connection.
- Industrial Power Supplies: Advanced industrial machinery and high-power equipment often require power supplies operating within this voltage range.
- Electric Vehicle Charging Infrastructure: The development of high-power EV charging stations also relies on components capable of handling these voltage levels.
- Market Share & Growth Potential: This segment is estimated to hold a significant market share, projected to grow at a CAGR of approximately 7.0% from 2025 to 2033, reflecting its critical role in evolving power infrastructure.
- Key Drivers:
Emerging Segment to Watch: Capacitance: More than 100 μF is another segment gaining considerable traction, especially for energy storage and power smoothing applications in advanced power systems. This segment is expected to exhibit above-average growth as higher capacitance density MLCCs become more prevalent.
Power and Utilities MLCC Market Product Landscape
The Power and Utilities MLCC market is witnessing a significant surge in product innovation, driven by the relentless pursuit of higher performance, miniaturization, and enhanced reliability. Manufacturers are introducing MLCCs with expanded voltage ranges, now commonly offering solutions beyond 1100V, catering to increasingly demanding grid applications and next-generation power electronics. High capacitance density MLCCs, particularly in larger case sizes like 4540 and beyond, are becoming more accessible, enabling engineers to achieve significant energy storage in compact footprints. Advanced dielectric types, such as Class 1 (e.g., C0G/NP0) for high stability and Class 2 (e.g., X7R, X5R) for higher capacitance values with controlled temperature and voltage dependencies, are being optimized for power applications. Unique selling propositions revolve around enhanced ripple current handling capabilities, superior thermal management, and extended operational lifetimes under harsh environmental conditions. Technological advancements in materials science and manufacturing processes are enabling lower Equivalent Series Inductance (ESL) and Equivalent Series Resistance (ESR), crucial for high-frequency switching applications in power converters and grid interfaces.
Key Drivers, Barriers & Challenges in Power and Utilities MLCC Market
Key Drivers:
- Renewable Energy Expansion: The global push for clean energy sources like solar and wind power necessitates robust power conversion and grid integration systems, directly boosting demand for high-performance MLCCs.
- Smart Grid Modernization: Investments in upgrading power grids with advanced metering, distributed generation, and smart control systems require reliable MLCCs for various electronic functions.
- Electrification of Transportation: The rapidly growing electric vehicle (EV) market, including charging infrastructure, is a major consumer of MLCCs for power management and battery systems.
- Industrial Automation (Industry 4.0): The increasing adoption of sophisticated automation and robotics in manufacturing drives the need for advanced power supplies and control systems, which utilize MLCCs.
- Technological Advancements: Continuous innovation in MLCC materials and manufacturing processes leads to improved voltage ratings, capacitance densities, and reliability, opening up new application areas.
Key Barriers & Challenges:
- Supply Chain Volatility: Disruptions in raw material availability (e.g., ceramics, noble metals) and geopolitical factors can lead to price fluctuations and lead time extensions, impacting production schedules. For instance, a shortage of specific ceramic powders can halt production lines, creating delays that have a significant ripple effect on the electronics industry.
- Stringent Qualification and Reliability Standards: Components used in critical power infrastructure require extensive testing and certification, which can be time-consuming and costly, posing a barrier to entry for smaller manufacturers.
- Competitive Pricing Pressure: While performance is key, there is constant pressure from customers for cost-effective solutions, especially for high-volume applications, requiring manufacturers to optimize production efficiency.
- Technological Obsolescence: Rapid advancements in power electronics can lead to faster product cycles, requiring continuous investment in R&D to keep pace and avoid market irrelevance.
- Environmental Regulations: Evolving environmental regulations concerning material usage and manufacturing processes can necessitate costly adjustments in production.
Emerging Opportunities in Power and Utilities MLCC Market
The Power and Utilities MLCC market is ripe with emerging opportunities. The burgeoning hydrogen energy sector presents a new frontier, as electrolyzers and fuel cells require sophisticated power electronics that can leverage advanced MLCCs. The expansion of distributed energy resources (DERs) and microgrids offers significant potential, as these localized power systems demand highly reliable and adaptable MLCCs for their complex energy management. Furthermore, the increasing integration of artificial intelligence (AI) and machine learning (ML) in grid management and energy optimization systems will create a need for MLCCs in the advanced computing hardware powering these applications. The development of next-generation power conversion topologies for enhanced energy efficiency and miniaturization in all sectors also presents a fertile ground for innovative MLCC solutions.
Growth Accelerators in the Power and Utilities MLCC Market Industry
Several key growth accelerators are poised to propel the Power and Utilities MLCC market forward. The sustained global commitment to decarbonization and the aggressive expansion of renewable energy portfolios will remain a primary driver. Technological breakthroughs in high-dielectric constant materials and advanced multilayering techniques are enabling MLCCs to achieve unprecedented capacitance densities and voltage ratings, making them indispensable for next-generation power systems. Strategic partnerships between MLCC manufacturers and leading power electronics companies, especially in the EV and renewable energy sectors, are accelerating product development and market penetration. Furthermore, government initiatives promoting energy independence and grid resilience are spurring significant investments in power infrastructure upgrades, creating a sustained demand for high-quality MLCCs.
Key Players Shaping the Power and Utilities MLCC Market Market
- Vishay Intertechnology Inc
- Kyocera AVX Components Corporation (Kyocera Corporation)
- Maruwa Co ltd
- Samwha Capacitor Group
- Walsin Technology Corporation
- Samsung Electro-Mechanics
- Würth Elektronik GmbH & Co KG
- Yageo Corporation
- Taiyo Yuden Co Ltd
- TDK Corporation
- Murata Manufacturing Co Ltd
- Nippon Chemi-Con Corporation
Notable Milestones in Power and Utilities MLCC Market Sector
- June 2023: Growing demand for industrial equipment spurred the introduction of NTS/NTF Series SMD type MLCCs, rated from 25 to 500 Vdc with capacitances from 0.010 to 47µF, finding applications in on-board power supplies, voltage regulators, and DC-DC converter smoothing circuits.
- July 2022: Walsin Technology released several new MLCC products, including high capacitance MLCCs with X5R & X7R temperature coefficients, high-temperature MLCCs, Feedthrough MLCCs, and miniaturized/low-profile MLCCs (e.g., 01005 package).
- June 2022: YAGEO Group offered its CL series MLCCs designed for applications requiring low ESL, crucial for reducing noise and voltage fluctuations from high-frequency current discharges, thereby stabilizing power line operation.
In-Depth Power and Utilities MLCC Market Market Outlook
The future outlook for the Power and Utilities MLCC market is exceptionally bright, characterized by sustained growth driven by macro-trends in energy transition and technological advancement. Strategic opportunities lie in catering to the evolving demands of high-voltage DC (HVDC) transmission systems, the increasing complexity of electric vehicle powertrains, and the burgeoning market for energy storage solutions. Companies that invest in developing ultra-high capacitance MLCCs with superior thermal management and extended lifespan will be well-positioned. Furthermore, focusing on miniaturization for embedded power applications and ensuring supply chain resilience will be critical for long-term success. The market's trajectory suggests a continued upward trend, underscoring the vital role of MLCCs in powering the modern and future energy landscape.
Power and Utilities MLCC Market Segmentation
-
1. Case Size
- 1.1. 1210
- 1.2. 1812
- 1.3. 2 220
- 1.4. 3 640
- 1.5. 4 540
- 1.6. Others
-
2. Voltage
- 2.1. 600V to 1100V
- 2.2. Less than 600V
- 2.3. More than 1100V
-
3. Capacitance
- 3.1. 10 μF to 100 μF
- 3.2. Less than 10 μF
- 3.3. More than 100 μF
-
4. Dielectric Type
- 4.1. Class 1
- 4.2. Class 2
Power and Utilities MLCC Market Segmentation By Geography
-
1. North America
- 1.1. United States
- 1.2. Canada
- 1.3. Mexico
-
2. South America
- 2.1. Brazil
- 2.2. Argentina
- 2.3. Rest of South America
-
3. Europe
- 3.1. United Kingdom
- 3.2. Germany
- 3.3. France
- 3.4. Italy
- 3.5. Spain
- 3.6. Russia
- 3.7. Benelux
- 3.8. Nordics
- 3.9. Rest of Europe
-
4. Middle East & Africa
- 4.1. Turkey
- 4.2. Israel
- 4.3. GCC
- 4.4. North Africa
- 4.5. South Africa
- 4.6. Rest of Middle East & Africa
-
5. Asia Pacific
- 5.1. China
- 5.2. India
- 5.3. Japan
- 5.4. South Korea
- 5.5. ASEAN
- 5.6. Oceania
- 5.7. Rest of Asia Pacific
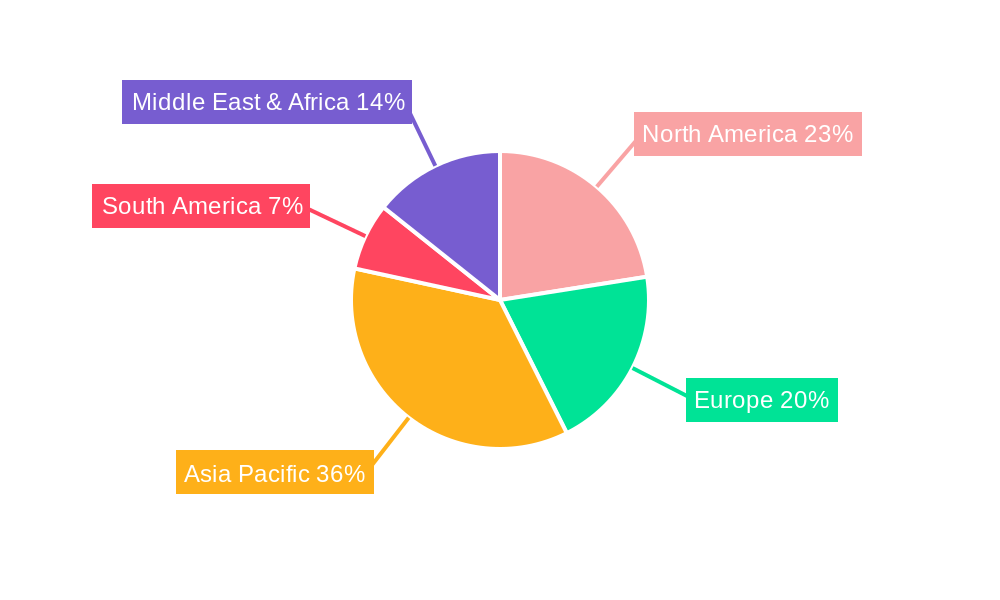
Power and Utilities MLCC Market Regional Market Share
Geographic Coverage of Power and Utilities MLCC Market
Power and Utilities MLCC Market REPORT HIGHLIGHTS
| Aspects | Details |
|---|---|
| Study Period | 2020-2034 |
| Base Year | 2025 |
| Estimated Year | 2026 |
| Forecast Period | 2026-2034 |
| Historical Period | 2020-2025 |
| Growth Rate | CAGR of 5.59% from 2020-2034 |
| Segmentation |
|
Table of Contents
- 1. Introduction
- 1.1. Research Scope
- 1.2. Market Segmentation
- 1.3. Research Objective
- 1.4. Definitions and Assumptions
- 2. Executive Summary
- 2.1. Market Snapshot
- 3. Market Dynamics
- 3.1. Market Drivers
- 3.2. Market Restrains
- 3.3. Market Trends
- 3.4. Market Opportunities
- 4. Market Factor Analysis
- 4.1. Porters Five Forces
- 4.1.1. Bargaining Power of Suppliers
- 4.1.2. Bargaining Power of Buyers
- 4.1.3. Threat of New Entrants
- 4.1.4. Threat of Substitutes
- 4.1.5. Competitive Rivalry
- 4.2. PESTEL analysis
- 4.3. BCG Analysis
- 4.3.1. Stars (High Growth, High Market Share)
- 4.3.2. Cash Cows (Low Growth, High Market Share)
- 4.3.3. Question Mark (High Growth, Low Market Share)
- 4.3.4. Dogs (Low Growth, Low Market Share)
- 4.4. Ansoff Matrix Analysis
- 4.5. Supply Chain Analysis
- 4.6. Regulatory Landscape
- 4.7. Current Market Potential and Opportunity Assessment (TAM–SAM–SOM Framework)
- 4.8. IMR Analyst Note
- 4.1. Porters Five Forces
- 5. Market Analysis, Insights and Forecast 2021-2033
- 5.1. Market Analysis, Insights and Forecast - by Case Size
- 5.1.1. 1210
- 5.1.2. 1812
- 5.1.3. 2 220
- 5.1.4. 3 640
- 5.1.5. 4 540
- 5.1.6. Others
- 5.2. Market Analysis, Insights and Forecast - by Voltage
- 5.2.1. 600V to 1100V
- 5.2.2. Less than 600V
- 5.2.3. More than 1100V
- 5.3. Market Analysis, Insights and Forecast - by Capacitance
- 5.3.1. 10 μF to 100 μF
- 5.3.2. Less than 10 μF
- 5.3.3. More than 100 μF
- 5.4. Market Analysis, Insights and Forecast - by Dielectric Type
- 5.4.1. Class 1
- 5.4.2. Class 2
- 5.5. Market Analysis, Insights and Forecast - by Region
- 5.5.1. North America
- 5.5.2. South America
- 5.5.3. Europe
- 5.5.4. Middle East & Africa
- 5.5.5. Asia Pacific
- 5.1. Market Analysis, Insights and Forecast - by Case Size
- 6. Global Power and Utilities MLCC Market Analysis, Insights and Forecast, 2021-2033
- 6.1. Market Analysis, Insights and Forecast - by Case Size
- 6.1.1. 1210
- 6.1.2. 1812
- 6.1.3. 2 220
- 6.1.4. 3 640
- 6.1.5. 4 540
- 6.1.6. Others
- 6.2. Market Analysis, Insights and Forecast - by Voltage
- 6.2.1. 600V to 1100V
- 6.2.2. Less than 600V
- 6.2.3. More than 1100V
- 6.3. Market Analysis, Insights and Forecast - by Capacitance
- 6.3.1. 10 μF to 100 μF
- 6.3.2. Less than 10 μF
- 6.3.3. More than 100 μF
- 6.4. Market Analysis, Insights and Forecast - by Dielectric Type
- 6.4.1. Class 1
- 6.4.2. Class 2
- 6.1. Market Analysis, Insights and Forecast - by Case Size
- 7. North America Power and Utilities MLCC Market Analysis, Insights and Forecast, 2020-2032
- 7.1. Market Analysis, Insights and Forecast - by Case Size
- 7.1.1. 1210
- 7.1.2. 1812
- 7.1.3. 2 220
- 7.1.4. 3 640
- 7.1.5. 4 540
- 7.1.6. Others
- 7.2. Market Analysis, Insights and Forecast - by Voltage
- 7.2.1. 600V to 1100V
- 7.2.2. Less than 600V
- 7.2.3. More than 1100V
- 7.3. Market Analysis, Insights and Forecast - by Capacitance
- 7.3.1. 10 μF to 100 μF
- 7.3.2. Less than 10 μF
- 7.3.3. More than 100 μF
- 7.4. Market Analysis, Insights and Forecast - by Dielectric Type
- 7.4.1. Class 1
- 7.4.2. Class 2
- 7.1. Market Analysis, Insights and Forecast - by Case Size
- 8. South America Power and Utilities MLCC Market Analysis, Insights and Forecast, 2020-2032
- 8.1. Market Analysis, Insights and Forecast - by Case Size
- 8.1.1. 1210
- 8.1.2. 1812
- 8.1.3. 2 220
- 8.1.4. 3 640
- 8.1.5. 4 540
- 8.1.6. Others
- 8.2. Market Analysis, Insights and Forecast - by Voltage
- 8.2.1. 600V to 1100V
- 8.2.2. Less than 600V
- 8.2.3. More than 1100V
- 8.3. Market Analysis, Insights and Forecast - by Capacitance
- 8.3.1. 10 μF to 100 μF
- 8.3.2. Less than 10 μF
- 8.3.3. More than 100 μF
- 8.4. Market Analysis, Insights and Forecast - by Dielectric Type
- 8.4.1. Class 1
- 8.4.2. Class 2
- 8.1. Market Analysis, Insights and Forecast - by Case Size
- 9. Europe Power and Utilities MLCC Market Analysis, Insights and Forecast, 2020-2032
- 9.1. Market Analysis, Insights and Forecast - by Case Size
- 9.1.1. 1210
- 9.1.2. 1812
- 9.1.3. 2 220
- 9.1.4. 3 640
- 9.1.5. 4 540
- 9.1.6. Others
- 9.2. Market Analysis, Insights and Forecast - by Voltage
- 9.2.1. 600V to 1100V
- 9.2.2. Less than 600V
- 9.2.3. More than 1100V
- 9.3. Market Analysis, Insights and Forecast - by Capacitance
- 9.3.1. 10 μF to 100 μF
- 9.3.2. Less than 10 μF
- 9.3.3. More than 100 μF
- 9.4. Market Analysis, Insights and Forecast - by Dielectric Type
- 9.4.1. Class 1
- 9.4.2. Class 2
- 9.1. Market Analysis, Insights and Forecast - by Case Size
- 10. Middle East & Africa Power and Utilities MLCC Market Analysis, Insights and Forecast, 2020-2032
- 10.1. Market Analysis, Insights and Forecast - by Case Size
- 10.1.1. 1210
- 10.1.2. 1812
- 10.1.3. 2 220
- 10.1.4. 3 640
- 10.1.5. 4 540
- 10.1.6. Others
- 10.2. Market Analysis, Insights and Forecast - by Voltage
- 10.2.1. 600V to 1100V
- 10.2.2. Less than 600V
- 10.2.3. More than 1100V
- 10.3. Market Analysis, Insights and Forecast - by Capacitance
- 10.3.1. 10 μF to 100 μF
- 10.3.2. Less than 10 μF
- 10.3.3. More than 100 μF
- 10.4. Market Analysis, Insights and Forecast - by Dielectric Type
- 10.4.1. Class 1
- 10.4.2. Class 2
- 10.1. Market Analysis, Insights and Forecast - by Case Size
- 11. Asia Pacific Power and Utilities MLCC Market Analysis, Insights and Forecast, 2020-2032
- 11.1. Market Analysis, Insights and Forecast - by Case Size
- 11.1.1. 1210
- 11.1.2. 1812
- 11.1.3. 2 220
- 11.1.4. 3 640
- 11.1.5. 4 540
- 11.1.6. Others
- 11.2. Market Analysis, Insights and Forecast - by Voltage
- 11.2.1. 600V to 1100V
- 11.2.2. Less than 600V
- 11.2.3. More than 1100V
- 11.3. Market Analysis, Insights and Forecast - by Capacitance
- 11.3.1. 10 μF to 100 μF
- 11.3.2. Less than 10 μF
- 11.3.3. More than 100 μF
- 11.4. Market Analysis, Insights and Forecast - by Dielectric Type
- 11.4.1. Class 1
- 11.4.2. Class 2
- 11.1. Market Analysis, Insights and Forecast - by Case Size
- 12. Competitive Analysis
- 12.1. Company Profiles
- 12.1.1 Vishay Intertechnology Inc
- 12.1.1.1. Company Overview
- 12.1.1.2. Products
- 12.1.1.3. Company Financials
- 12.1.1.4. SWOT Analysis
- 12.1.2 Kyocera AVX Components Corporation (Kyocera Corporation)
- 12.1.2.1. Company Overview
- 12.1.2.2. Products
- 12.1.2.3. Company Financials
- 12.1.2.4. SWOT Analysis
- 12.1.3 Maruwa Co ltd
- 12.1.3.1. Company Overview
- 12.1.3.2. Products
- 12.1.3.3. Company Financials
- 12.1.3.4. SWOT Analysis
- 12.1.4 Samwha Capacitor Group
- 12.1.4.1. Company Overview
- 12.1.4.2. Products
- 12.1.4.3. Company Financials
- 12.1.4.4. SWOT Analysis
- 12.1.5 Walsin Technology Corporation
- 12.1.5.1. Company Overview
- 12.1.5.2. Products
- 12.1.5.3. Company Financials
- 12.1.5.4. SWOT Analysis
- 12.1.6 Samsung Electro-Mechanics
- 12.1.6.1. Company Overview
- 12.1.6.2. Products
- 12.1.6.3. Company Financials
- 12.1.6.4. SWOT Analysis
- 12.1.7 Würth Elektronik GmbH & Co KG
- 12.1.7.1. Company Overview
- 12.1.7.2. Products
- 12.1.7.3. Company Financials
- 12.1.7.4. SWOT Analysis
- 12.1.8 Yageo Corporatio
- 12.1.8.1. Company Overview
- 12.1.8.2. Products
- 12.1.8.3. Company Financials
- 12.1.8.4. SWOT Analysis
- 12.1.9 Taiyo Yuden Co Ltd
- 12.1.9.1. Company Overview
- 12.1.9.2. Products
- 12.1.9.3. Company Financials
- 12.1.9.4. SWOT Analysis
- 12.1.10 TDK Corporation
- 12.1.10.1. Company Overview
- 12.1.10.2. Products
- 12.1.10.3. Company Financials
- 12.1.10.4. SWOT Analysis
- 12.1.11 Murata Manufacturing Co Ltd
- 12.1.11.1. Company Overview
- 12.1.11.2. Products
- 12.1.11.3. Company Financials
- 12.1.11.4. SWOT Analysis
- 12.1.12 Nippon Chemi-Con Corporation
- 12.1.12.1. Company Overview
- 12.1.12.2. Products
- 12.1.12.3. Company Financials
- 12.1.12.4. SWOT Analysis
- 12.1.1 Vishay Intertechnology Inc
- 12.2. Market Entropy
- 12.2.1 Company's Key Areas Served
- 12.2.2 Recent Developments
- 12.3. Company Market Share Analysis 2025
- 12.3.1 Top 5 Companies Market Share Analysis
- 12.3.2 Top 3 Companies Market Share Analysis
- 12.4. List of Potential Customers
- 13. Research Methodology
List of Figures
- Figure 1: Global Power and Utilities MLCC Market Revenue Breakdown (billion, %) by Region 2025 & 2033
- Figure 2: North America Power and Utilities MLCC Market Revenue (billion), by Case Size 2025 & 2033
- Figure 3: North America Power and Utilities MLCC Market Revenue Share (%), by Case Size 2025 & 2033
- Figure 4: North America Power and Utilities MLCC Market Revenue (billion), by Voltage 2025 & 2033
- Figure 5: North America Power and Utilities MLCC Market Revenue Share (%), by Voltage 2025 & 2033
- Figure 6: North America Power and Utilities MLCC Market Revenue (billion), by Capacitance 2025 & 2033
- Figure 7: North America Power and Utilities MLCC Market Revenue Share (%), by Capacitance 2025 & 2033
- Figure 8: North America Power and Utilities MLCC Market Revenue (billion), by Dielectric Type 2025 & 2033
- Figure 9: North America Power and Utilities MLCC Market Revenue Share (%), by Dielectric Type 2025 & 2033
- Figure 10: North America Power and Utilities MLCC Market Revenue (billion), by Country 2025 & 2033
- Figure 11: North America Power and Utilities MLCC Market Revenue Share (%), by Country 2025 & 2033
- Figure 12: South America Power and Utilities MLCC Market Revenue (billion), by Case Size 2025 & 2033
- Figure 13: South America Power and Utilities MLCC Market Revenue Share (%), by Case Size 2025 & 2033
- Figure 14: South America Power and Utilities MLCC Market Revenue (billion), by Voltage 2025 & 2033
- Figure 15: South America Power and Utilities MLCC Market Revenue Share (%), by Voltage 2025 & 2033
- Figure 16: South America Power and Utilities MLCC Market Revenue (billion), by Capacitance 2025 & 2033
- Figure 17: South America Power and Utilities MLCC Market Revenue Share (%), by Capacitance 2025 & 2033
- Figure 18: South America Power and Utilities MLCC Market Revenue (billion), by Dielectric Type 2025 & 2033
- Figure 19: South America Power and Utilities MLCC Market Revenue Share (%), by Dielectric Type 2025 & 2033
- Figure 20: South America Power and Utilities MLCC Market Revenue (billion), by Country 2025 & 2033
- Figure 21: South America Power and Utilities MLCC Market Revenue Share (%), by Country 2025 & 2033
- Figure 22: Europe Power and Utilities MLCC Market Revenue (billion), by Case Size 2025 & 2033
- Figure 23: Europe Power and Utilities MLCC Market Revenue Share (%), by Case Size 2025 & 2033
- Figure 24: Europe Power and Utilities MLCC Market Revenue (billion), by Voltage 2025 & 2033
- Figure 25: Europe Power and Utilities MLCC Market Revenue Share (%), by Voltage 2025 & 2033
- Figure 26: Europe Power and Utilities MLCC Market Revenue (billion), by Capacitance 2025 & 2033
- Figure 27: Europe Power and Utilities MLCC Market Revenue Share (%), by Capacitance 2025 & 2033
- Figure 28: Europe Power and Utilities MLCC Market Revenue (billion), by Dielectric Type 2025 & 2033
- Figure 29: Europe Power and Utilities MLCC Market Revenue Share (%), by Dielectric Type 2025 & 2033
- Figure 30: Europe Power and Utilities MLCC Market Revenue (billion), by Country 2025 & 2033
- Figure 31: Europe Power and Utilities MLCC Market Revenue Share (%), by Country 2025 & 2033
- Figure 32: Middle East & Africa Power and Utilities MLCC Market Revenue (billion), by Case Size 2025 & 2033
- Figure 33: Middle East & Africa Power and Utilities MLCC Market Revenue Share (%), by Case Size 2025 & 2033
- Figure 34: Middle East & Africa Power and Utilities MLCC Market Revenue (billion), by Voltage 2025 & 2033
- Figure 35: Middle East & Africa Power and Utilities MLCC Market Revenue Share (%), by Voltage 2025 & 2033
- Figure 36: Middle East & Africa Power and Utilities MLCC Market Revenue (billion), by Capacitance 2025 & 2033
- Figure 37: Middle East & Africa Power and Utilities MLCC Market Revenue Share (%), by Capacitance 2025 & 2033
- Figure 38: Middle East & Africa Power and Utilities MLCC Market Revenue (billion), by Dielectric Type 2025 & 2033
- Figure 39: Middle East & Africa Power and Utilities MLCC Market Revenue Share (%), by Dielectric Type 2025 & 2033
- Figure 40: Middle East & Africa Power and Utilities MLCC Market Revenue (billion), by Country 2025 & 2033
- Figure 41: Middle East & Africa Power and Utilities MLCC Market Revenue Share (%), by Country 2025 & 2033
- Figure 42: Asia Pacific Power and Utilities MLCC Market Revenue (billion), by Case Size 2025 & 2033
- Figure 43: Asia Pacific Power and Utilities MLCC Market Revenue Share (%), by Case Size 2025 & 2033
- Figure 44: Asia Pacific Power and Utilities MLCC Market Revenue (billion), by Voltage 2025 & 2033
- Figure 45: Asia Pacific Power and Utilities MLCC Market Revenue Share (%), by Voltage 2025 & 2033
- Figure 46: Asia Pacific Power and Utilities MLCC Market Revenue (billion), by Capacitance 2025 & 2033
- Figure 47: Asia Pacific Power and Utilities MLCC Market Revenue Share (%), by Capacitance 2025 & 2033
- Figure 48: Asia Pacific Power and Utilities MLCC Market Revenue (billion), by Dielectric Type 2025 & 2033
- Figure 49: Asia Pacific Power and Utilities MLCC Market Revenue Share (%), by Dielectric Type 2025 & 2033
- Figure 50: Asia Pacific Power and Utilities MLCC Market Revenue (billion), by Country 2025 & 2033
- Figure 51: Asia Pacific Power and Utilities MLCC Market Revenue Share (%), by Country 2025 & 2033
List of Tables
- Table 1: Global Power and Utilities MLCC Market Revenue billion Forecast, by Case Size 2020 & 2033
- Table 2: Global Power and Utilities MLCC Market Revenue billion Forecast, by Voltage 2020 & 2033
- Table 3: Global Power and Utilities MLCC Market Revenue billion Forecast, by Capacitance 2020 & 2033
- Table 4: Global Power and Utilities MLCC Market Revenue billion Forecast, by Dielectric Type 2020 & 2033
- Table 5: Global Power and Utilities MLCC Market Revenue billion Forecast, by Region 2020 & 2033
- Table 6: Global Power and Utilities MLCC Market Revenue billion Forecast, by Case Size 2020 & 2033
- Table 7: Global Power and Utilities MLCC Market Revenue billion Forecast, by Voltage 2020 & 2033
- Table 8: Global Power and Utilities MLCC Market Revenue billion Forecast, by Capacitance 2020 & 2033
- Table 9: Global Power and Utilities MLCC Market Revenue billion Forecast, by Dielectric Type 2020 & 2033
- Table 10: Global Power and Utilities MLCC Market Revenue billion Forecast, by Country 2020 & 2033
- Table 11: United States Power and Utilities MLCC Market Revenue (billion) Forecast, by Application 2020 & 2033
- Table 12: Canada Power and Utilities MLCC Market Revenue (billion) Forecast, by Application 2020 & 2033
- Table 13: Mexico Power and Utilities MLCC Market Revenue (billion) Forecast, by Application 2020 & 2033
- Table 14: Global Power and Utilities MLCC Market Revenue billion Forecast, by Case Size 2020 & 2033
- Table 15: Global Power and Utilities MLCC Market Revenue billion Forecast, by Voltage 2020 & 2033
- Table 16: Global Power and Utilities MLCC Market Revenue billion Forecast, by Capacitance 2020 & 2033
- Table 17: Global Power and Utilities MLCC Market Revenue billion Forecast, by Dielectric Type 2020 & 2033
- Table 18: Global Power and Utilities MLCC Market Revenue billion Forecast, by Country 2020 & 2033
- Table 19: Brazil Power and Utilities MLCC Market Revenue (billion) Forecast, by Application 2020 & 2033
- Table 20: Argentina Power and Utilities MLCC Market Revenue (billion) Forecast, by Application 2020 & 2033
- Table 21: Rest of South America Power and Utilities MLCC Market Revenue (billion) Forecast, by Application 2020 & 2033
- Table 22: Global Power and Utilities MLCC Market Revenue billion Forecast, by Case Size 2020 & 2033
- Table 23: Global Power and Utilities MLCC Market Revenue billion Forecast, by Voltage 2020 & 2033
- Table 24: Global Power and Utilities MLCC Market Revenue billion Forecast, by Capacitance 2020 & 2033
- Table 25: Global Power and Utilities MLCC Market Revenue billion Forecast, by Dielectric Type 2020 & 2033
- Table 26: Global Power and Utilities MLCC Market Revenue billion Forecast, by Country 2020 & 2033
- Table 27: United Kingdom Power and Utilities MLCC Market Revenue (billion) Forecast, by Application 2020 & 2033
- Table 28: Germany Power and Utilities MLCC Market Revenue (billion) Forecast, by Application 2020 & 2033
- Table 29: France Power and Utilities MLCC Market Revenue (billion) Forecast, by Application 2020 & 2033
- Table 30: Italy Power and Utilities MLCC Market Revenue (billion) Forecast, by Application 2020 & 2033
- Table 31: Spain Power and Utilities MLCC Market Revenue (billion) Forecast, by Application 2020 & 2033
- Table 32: Russia Power and Utilities MLCC Market Revenue (billion) Forecast, by Application 2020 & 2033
- Table 33: Benelux Power and Utilities MLCC Market Revenue (billion) Forecast, by Application 2020 & 2033
- Table 34: Nordics Power and Utilities MLCC Market Revenue (billion) Forecast, by Application 2020 & 2033
- Table 35: Rest of Europe Power and Utilities MLCC Market Revenue (billion) Forecast, by Application 2020 & 2033
- Table 36: Global Power and Utilities MLCC Market Revenue billion Forecast, by Case Size 2020 & 2033
- Table 37: Global Power and Utilities MLCC Market Revenue billion Forecast, by Voltage 2020 & 2033
- Table 38: Global Power and Utilities MLCC Market Revenue billion Forecast, by Capacitance 2020 & 2033
- Table 39: Global Power and Utilities MLCC Market Revenue billion Forecast, by Dielectric Type 2020 & 2033
- Table 40: Global Power and Utilities MLCC Market Revenue billion Forecast, by Country 2020 & 2033
- Table 41: Turkey Power and Utilities MLCC Market Revenue (billion) Forecast, by Application 2020 & 2033
- Table 42: Israel Power and Utilities MLCC Market Revenue (billion) Forecast, by Application 2020 & 2033
- Table 43: GCC Power and Utilities MLCC Market Revenue (billion) Forecast, by Application 2020 & 2033
- Table 44: North Africa Power and Utilities MLCC Market Revenue (billion) Forecast, by Application 2020 & 2033
- Table 45: South Africa Power and Utilities MLCC Market Revenue (billion) Forecast, by Application 2020 & 2033
- Table 46: Rest of Middle East & Africa Power and Utilities MLCC Market Revenue (billion) Forecast, by Application 2020 & 2033
- Table 47: Global Power and Utilities MLCC Market Revenue billion Forecast, by Case Size 2020 & 2033
- Table 48: Global Power and Utilities MLCC Market Revenue billion Forecast, by Voltage 2020 & 2033
- Table 49: Global Power and Utilities MLCC Market Revenue billion Forecast, by Capacitance 2020 & 2033
- Table 50: Global Power and Utilities MLCC Market Revenue billion Forecast, by Dielectric Type 2020 & 2033
- Table 51: Global Power and Utilities MLCC Market Revenue billion Forecast, by Country 2020 & 2033
- Table 52: China Power and Utilities MLCC Market Revenue (billion) Forecast, by Application 2020 & 2033
- Table 53: India Power and Utilities MLCC Market Revenue (billion) Forecast, by Application 2020 & 2033
- Table 54: Japan Power and Utilities MLCC Market Revenue (billion) Forecast, by Application 2020 & 2033
- Table 55: South Korea Power and Utilities MLCC Market Revenue (billion) Forecast, by Application 2020 & 2033
- Table 56: ASEAN Power and Utilities MLCC Market Revenue (billion) Forecast, by Application 2020 & 2033
- Table 57: Oceania Power and Utilities MLCC Market Revenue (billion) Forecast, by Application 2020 & 2033
- Table 58: Rest of Asia Pacific Power and Utilities MLCC Market Revenue (billion) Forecast, by Application 2020 & 2033
Frequently Asked Questions
1. What is the projected Compound Annual Growth Rate (CAGR) of the Power and Utilities MLCC Market?
The projected CAGR is approximately 5.59%.
2. Which companies are prominent players in the Power and Utilities MLCC Market?
Key companies in the market include Vishay Intertechnology Inc, Kyocera AVX Components Corporation (Kyocera Corporation), Maruwa Co ltd, Samwha Capacitor Group, Walsin Technology Corporation, Samsung Electro-Mechanics, Würth Elektronik GmbH & Co KG, Yageo Corporatio, Taiyo Yuden Co Ltd, TDK Corporation, Murata Manufacturing Co Ltd, Nippon Chemi-Con Corporation.
3. What are the main segments of the Power and Utilities MLCC Market?
The market segments include Case Size, Voltage, Capacitance, Dielectric Type.
4. Can you provide details about the market size?
The market size is estimated to be USD 12.87 billion as of 2022.
5. What are some drivers contributing to market growth?
Rise in the Applications of Semiconductors; Advancement in Technology Such as Magnetron Sputtering Technology.
6. What are the notable trends driving market growth?
OTHER KEY INDUSTRY TRENDS COVERED IN THE REPORT.
7. Are there any restraints impacting market growth?
Rise of Alternative Technologies Such as Thermal Evaporation.
8. Can you provide examples of recent developments in the market?
June 2023: The growing demand for industrial equipments has driven the company to introduce NTS/NTF NTS/NTF Series of SMD type MLCC. These capacitors are rated with 25 to 500 Vdc with a capacitance ranging from 0.010 to 47µF. These MLCCs are used in on-board power supplies,voltage regulators for computers,smoothing circuit of DC-DC converters,etc.July 2022: In 2022, Walsin Technology developed and released several new MLCC products are
9. What pricing options are available for accessing the report?
Pricing options include single-user, multi-user, and enterprise licenses priced at USD 3800, USD 4500, and USD 5800 respectively.
10. Is the market size provided in terms of value or volume?
The market size is provided in terms of value, measured in billion.
11. Are there any specific market keywords associated with the report?
Yes, the market keyword associated with the report is "Power and Utilities MLCC Market," which aids in identifying and referencing the specific market segment covered.
12. How do I determine which pricing option suits my needs best?
The pricing options vary based on user requirements and access needs. Individual users may opt for single-user licenses, while businesses requiring broader access may choose multi-user or enterprise licenses for cost-effective access to the report.
13. Are there any additional resources or data provided in the Power and Utilities MLCC Market report?
While the report offers comprehensive insights, it's advisable to review the specific contents or supplementary materials provided to ascertain if additional resources or data are available.
14. How can I stay updated on further developments or reports in the Power and Utilities MLCC Market?
To stay informed about further developments, trends, and reports in the Power and Utilities MLCC Market, consider subscribing to industry newsletters, following relevant companies and organizations, or regularly checking reputable industry news sources and publications.
Methodology
Step 1 - Identification of Relevant Samples Size from Population Database


Step 2 - Approaches for Defining Global Market Size (Value, Volume* & Price*)

Note*: In applicable scenarios
Step 3 - Data Sources
Primary Research
- Web Analytics
- Survey Reports
- Research Institute
- Latest Research Reports
- Opinion Leaders
Secondary Research
- Annual Reports
- White Paper
- Latest Press Release
- Industry Association
- Paid Database
- Investor Presentations

Step 4 - Data Triangulation
Involves using different sources of information in order to increase the validity of a study
These sources are likely to be stakeholders in a program - participants, other researchers, program staff, other community members, and so on.
Then we put all data in single framework & apply various statistical tools to find out the dynamic on the market.
During the analysis stage, feedback from the stakeholder groups would be compared to determine areas of agreement as well as areas of divergence