

Key Insights
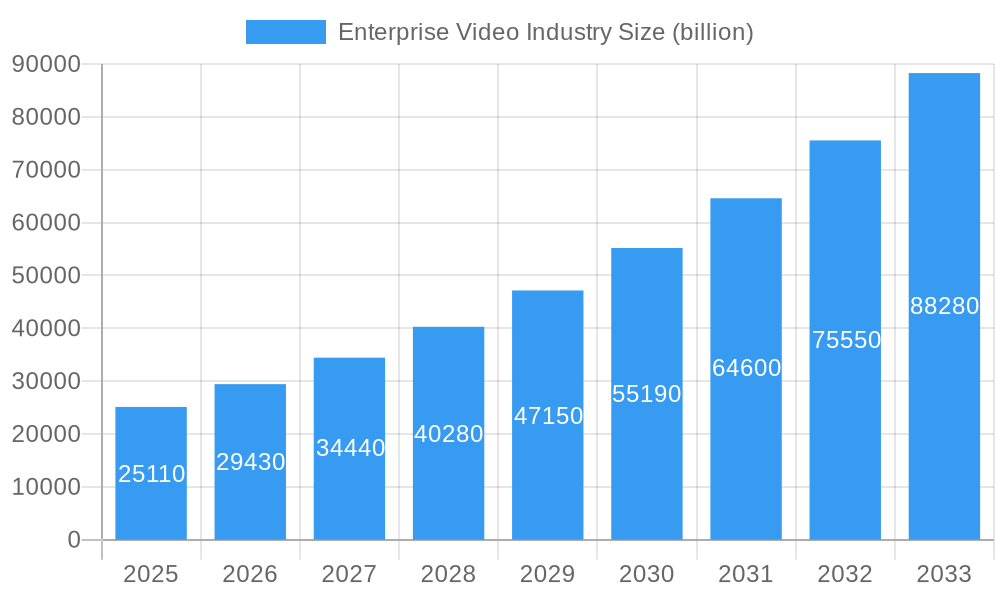
The Enterprise Video Industry is poised for substantial growth, projected to reach an impressive $25.11 billion in 2025. This expansion is fueled by a robust CAGR of 17.2%, indicating a dynamic and rapidly evolving market. Key drivers of this surge include the increasing demand for enhanced internal and external communication, the growing adoption of remote and hybrid work models, and the imperative for organizations to deliver engaging and accessible video content. Video conferencing solutions are at the forefront, enabling seamless collaboration and virtual meetings for distributed workforces. Furthermore, the growing need for effective video content management systems, sophisticated webcasting capabilities for company-wide announcements and events, and the continuous innovation in related hardware and software components are all contributing to this upward trajectory. The IT & Telecommunications sector, along with Healthcare and BFSI, are leading the adoption of these advanced video solutions to streamline operations, improve patient care, and enhance customer engagement.
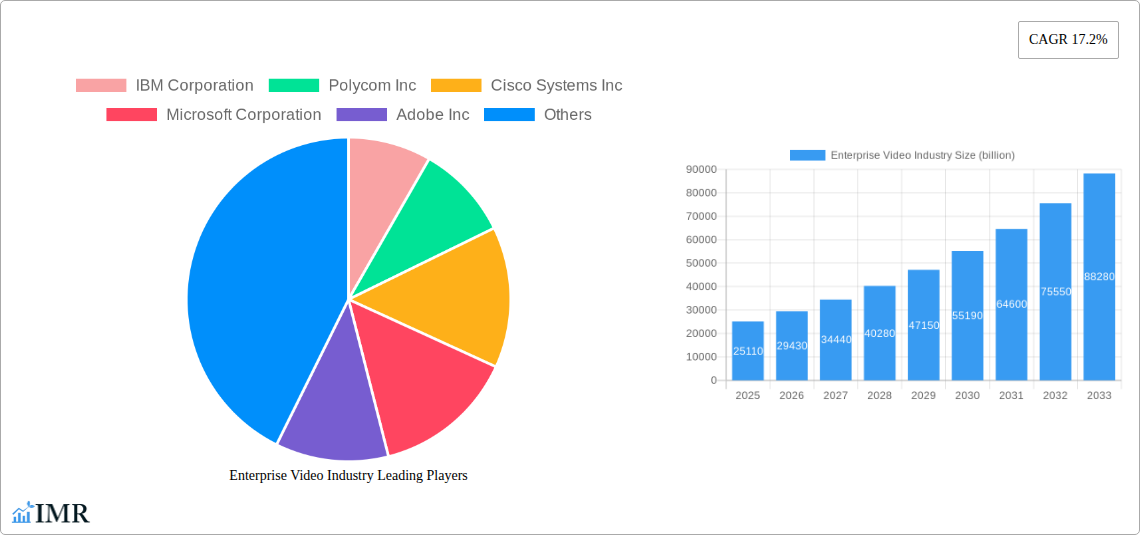
Enterprise Video Industry Market Size (In Billion)
The market's expansive growth is further underscored by significant investments in cloud-based video platforms and AI-powered video analytics, which are revolutionizing how businesses create, manage, and distribute video content. While the market benefits from strong demand, potential restraints such as the initial cost of implementation for certain advanced solutions and the ongoing need for robust cybersecurity measures to protect sensitive video data need careful consideration by stakeholders. However, the overarching trend of digital transformation and the pervasive need for rich, interactive communication channels are expected to outweigh these challenges. Major players like Cisco Systems, Microsoft, and IBM are actively innovating and expanding their offerings, driving competition and pushing the boundaries of enterprise video capabilities. The Asia Pacific region, with its burgeoning digital infrastructure and rapid adoption of new technologies, is emerging as a critical growth area alongside established markets in North America and Europe.
Enterprise Video Industry Company Market Share
This comprehensive report offers an in-depth analysis of the global Enterprise Video Industry, exploring its intricate market dynamics, growth trajectories, and future potential. Delving into parent and child markets, this study leverages high-traffic keywords to maximize search engine visibility for industry professionals. With a robust methodology spanning the historical period of 2019–2024, a base year of 2025, and a forecast period extending to 2033, this report provides actionable insights into market size evolution, technological disruptions, and key strategic opportunities.
Enterprise Video Industry Market Dynamics & Structure
The Enterprise Video Industry is characterized by a dynamic and evolving market structure. Market concentration is moderate, with a mix of established giants and agile innovators vying for market share. Technological innovation remains a primary driver, fueled by advancements in AI, cloud computing, and advanced codecs, leading to enhanced video quality, improved collaboration features, and more sophisticated analytics. Regulatory frameworks, particularly concerning data privacy and security (e.g., GDPR, CCPA), influence platform development and deployment strategies. Competitive product substitutes include traditional teleconferencing tools and asynchronous communication platforms, pushing enterprise video solutions to offer more integrated and immersive experiences. End-user demographics are increasingly diverse, with a growing demand for scalable and user-friendly solutions across all organizational sizes. Mergers and acquisitions (M&A) trends are prevalent as larger players seek to consolidate their offerings, acquire innovative technologies, or expand their geographical reach.
- Market Concentration: A mix of large corporations and specialized vendors, with increasing consolidation observed.
- Technological Innovation Drivers: AI-powered features (e.g., transcription, analytics), cloud-native solutions, enhanced security protocols, and immersive AR/VR integration.
- Regulatory Frameworks: Growing emphasis on data privacy, compliance, and secure communication channels.
- Competitive Product Substitutes: Traditional conferencing systems, instant messaging platforms with limited video capabilities, and in-person meetings.
- End-User Demographics: Diversified across SMBs, large enterprises, and government sectors, with a focus on remote and hybrid work enablement.
- M&A Trends: Strategic acquisitions to bolster product portfolios, gain market access, and integrate emerging technologies.
Enterprise Video Industry Growth Trends & Insights
The Enterprise Video Industry is poised for significant expansion, driven by the pervasive need for seamless communication and collaboration in modern business environments. The market size is projected to witness a substantial Compound Annual Growth Rate (CAGR) throughout the forecast period. Adoption rates for enterprise video solutions have surged, accelerated by the global shift towards remote and hybrid work models. Technological disruptions, such as the integration of artificial intelligence for features like automated content tagging and real-time translation, are reshaping the user experience and driving demand for advanced platforms. Consumer behavior shifts, including a greater reliance on visual communication and a preference for flexible, on-demand access to video content, are further propelling market growth. The ongoing digital transformation across industries is creating a fertile ground for enterprise video adoption, as organizations seek to enhance productivity, improve employee engagement, and streamline internal and external communications. The increasing sophistication of video analytics is also empowering businesses to gain deeper insights into content performance and user engagement, leading to more data-driven decision-making.
Dominant Regions, Countries, or Segments in Enterprise Video Industry
North America currently holds a dominant position in the Enterprise Video Industry, driven by its robust technological infrastructure, early adoption of advanced communication tools, and the presence of major technology corporations. The United States, in particular, represents a significant market share due to its large enterprise base, strong emphasis on innovation, and the widespread implementation of remote and hybrid work policies. The IT & Telecommunications sector is a leading end-user industry, consistently investing in scalable and secure video solutions to support its distributed workforce and complex operational needs.
- Leading Region: North America, with the United States as the primary market.
- Dominant End-User Industry: IT & Telecommunications, driven by the need for efficient collaboration and communication.
- Key Drivers in North America:
- Technological Advancements: Early adoption and development of cutting-edge video technologies.
- Remote Work Culture: Established hybrid and remote work models necessitate advanced collaboration tools.
- Strong Enterprise Base: Significant presence of large corporations with substantial IT budgets.
- Investment in Innovation: Continuous R&D and adoption of new features and platforms.
- Growth Potential: High, with sustained demand from various sectors embracing digital transformation.
Within the segment landscape, Video Conferencing remains the most significant segment, underpinning the core functionality of modern enterprise communication. However, Video Content Management is experiencing rapid growth as organizations leverage video for training, marketing, and internal communications.
- Dominant Segment (Type): Video Conferencing.
- Fastest Growing Segment (Type): Video Content Management.
- Key Drivers for Video Content Management: Rise of corporate learning, demand for on-demand training, and video marketing initiatives.
In terms of components, Software solutions are increasingly dominating the market, offering greater flexibility, scalability, and integration capabilities compared to hardware.
- Dominant Component: Software.
- Key Drivers for Software Dominance: Cloud deployment, subscription-based models, ease of updates, and integration with existing enterprise systems.
Enterprise Video Industry Product Landscape
The enterprise video product landscape is characterized by a continuous stream of innovation, focusing on enhancing user experience, security, and analytical capabilities. Product innovations include AI-powered features like real-time transcription, automated meeting summarization, and intelligent noise cancellation. Advanced security protocols, end-to-end encryption, and robust access controls are becoming standard. Performance metrics are measured by video and audio quality, latency, uptime, and scalability. Unique selling propositions often revolve around seamless integration with other enterprise tools, customizable branding options, and comprehensive analytics dashboards that provide deep insights into user engagement and content performance. The development of metaverse-ready collaboration spaces and immersive virtual meeting experiences is also emerging as a key technological advancement.
Key Drivers, Barriers & Challenges in Enterprise Video Industry
Key Drivers: The primary forces propelling the Enterprise Video Industry include the escalating demand for remote and hybrid work solutions, the growing adoption of digital transformation initiatives across sectors, and the need for enhanced internal and external communication efficiency. Technological advancements in AI and cloud computing are enabling more sophisticated and user-friendly video platforms. Economic factors such as increased IT spending and a focus on productivity gains also contribute significantly.
Barriers & Challenges: Key challenges facing the industry include concerns around data security and privacy, particularly with sensitive corporate information being transmitted. Integration complexities with existing legacy systems can pose a significant hurdle for some organizations. The high cost of implementing and maintaining advanced video infrastructure can be a restraint, especially for smaller businesses. Furthermore, ensuring consistent and high-quality connectivity in diverse geographical locations and managing the vast amounts of data generated by video content present ongoing operational challenges. Competitive pressures from numerous vendors also drive continuous innovation but can make market navigation complex.
Emerging Opportunities in Enterprise Video Industry
Emerging opportunities in the Enterprise Video Industry lie in the expansion of AI-driven features, such as predictive analytics for meeting effectiveness and personalized learning pathways delivered via video. The growing demand for immersive collaboration experiences, including augmented and virtual reality integration for virtual meeting rooms, presents a significant untapped market. Furthermore, the increasing adoption of video for employee onboarding and training in a distributed workforce model offers substantial growth potential. The development of specialized video solutions tailored for niche industries, such as remote patient monitoring in healthcare or interactive virtual tours in retail, also represents an evolving opportunity.
Growth Accelerators in the Enterprise Video Industry Industry
Several growth accelerators are poised to propel the Enterprise Video Industry forward. Continuous technological breakthroughs, including advancements in 5G connectivity for enhanced mobile video experiences and the further integration of machine learning for intelligent content moderation and analysis, will be pivotal. Strategic partnerships between enterprise video providers and software vendors, as well as hardware manufacturers, will foster more comprehensive and integrated solutions. Market expansion strategies focusing on emerging economies and developing regions, where the adoption of advanced communication tools is rapidly increasing, will also be crucial growth catalysts. The increasing recognition of video's role in fostering company culture and employee engagement in hybrid work environments will also drive sustained investment.
Key Players Shaping the Enterprise Video Industry Market
- IBM Corporation
- Polycom Inc
- Cisco Systems Inc
- Microsoft Corporation
- Adobe Inc
- Kaltura Inc
- Avaya Inc
- Ooyala Inc
- Vbrick Systems Inc
- Mediaplatform Inc
- Brightcove Inc
- Vidyo Inc
Notable Milestones in Enterprise Video Industry Sector
- January 2022: BlueJeans by Verizon was selected as the video conferencing provider for the Canadian National Research and Education Network (NREN). This contract extends the capabilities to make the platform available to schools to engage students in interactive and collaborative educational experiences, impacting the education sector's adoption of advanced video tools.
- January 2022: StrikeForce Technologies announced an alternative approach to video conferencing security, addressing sensitive collaboration needs influenced by the COVID-19 pandemic. This development highlights the growing importance of robust security features in enterprise video solutions, particularly for government agencies and organizations handling proprietary information.
In-Depth Enterprise Video Industry Market Outlook
The Enterprise Video Industry is set for sustained and robust growth, driven by the ongoing digital transformation and the permanent integration of hybrid and remote work models. Future market potential is immense as organizations increasingly rely on video for all facets of their operations, from internal collaboration and training to external client interactions and marketing. Strategic opportunities abound in leveraging AI for personalized user experiences, developing immersive virtual collaboration environments, and expanding tailored solutions for specific industry verticals. The continued evolution of cloud infrastructure and connectivity will further enable the scalability and accessibility of enterprise video, cementing its position as an indispensable tool for modern businesses.
Enterprise Video Industry Segmentation
-
1. Type
- 1.1. Video Conferencing
- 1.2. Video Content Management
- 1.3. Webcasting
- 1.4. Other Types
-
2. Components
- 2.1. Hardware
- 2.2. Software
-
3. End-user Industry
- 3.1. Healthcare
- 3.2. BFSI
- 3.3. IT & Telecommunications
- 3.4. Retail
- 3.5. Other End-User Industries
Enterprise Video Industry Segmentation By Geography
-
1. North America
- 1.1. United States
- 1.2. Canada
-
2. Europe
- 2.1. United Kingdom
- 2.2. Germany
- 2.3. France
- 2.4. Rest of Europe
-
3. Asia Pacific
- 3.1. China
- 3.2. Japan
- 3.3. Australia
- 3.4. Rest of Asia Pacific
-
4. Latin America
- 4.1. Mexico
- 4.2. Brazil
- 4.3. Rest of Latin America
- 5. Middle East
-
6. United Arab Emirates
- 6.1. Saudi Arabia
- 6.2. Rest of Middle East
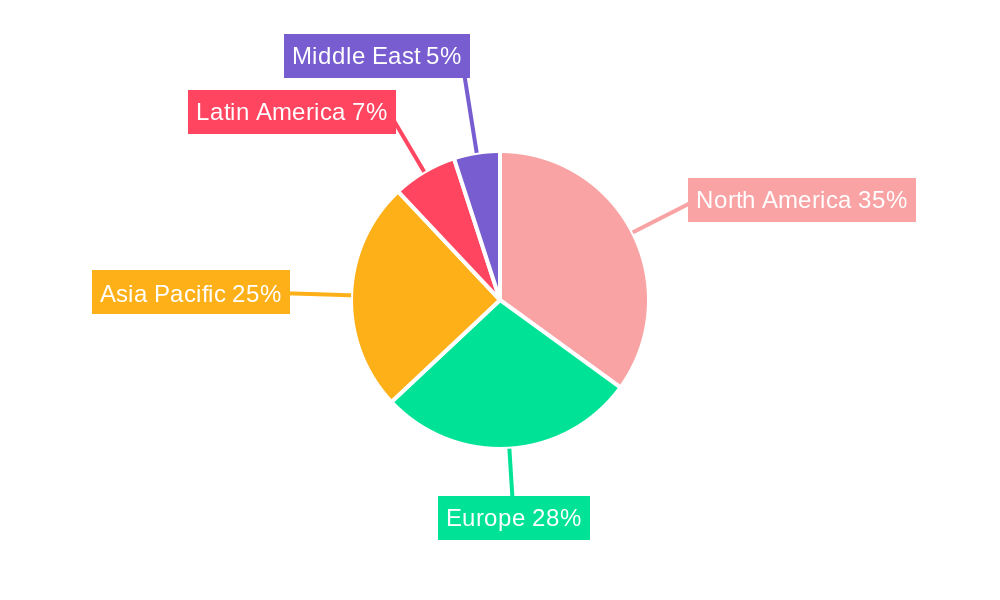
Enterprise Video Industry Regional Market Share
Geographic Coverage of Enterprise Video Industry
Enterprise Video Industry REPORT HIGHLIGHTS
| Aspects | Details |
|---|---|
| Study Period | 2020-2034 |
| Base Year | 2025 |
| Estimated Year | 2026 |
| Forecast Period | 2026-2034 |
| Historical Period | 2020-2025 |
| Growth Rate | CAGR of 17.2% from 2020-2034 |
| Segmentation |
|
Table of Contents
- 1. Introduction
- 1.1. Research Scope
- 1.2. Market Segmentation
- 1.3. Research Objective
- 1.4. Definitions and Assumptions
- 2. Executive Summary
- 2.1. Market Snapshot
- 3. Market Dynamics
- 3.1. Market Drivers
- 3.2. Market Restrains
- 3.3. Market Trends
- 3.4. Market Opportunities
- 4. Market Factor Analysis
- 4.1. Porters Five Forces
- 4.1.1. Bargaining Power of Suppliers
- 4.1.2. Bargaining Power of Buyers
- 4.1.3. Threat of New Entrants
- 4.1.4. Threat of Substitutes
- 4.1.5. Competitive Rivalry
- 4.2. PESTEL analysis
- 4.3. BCG Analysis
- 4.3.1. Stars (High Growth, High Market Share)
- 4.3.2. Cash Cows (Low Growth, High Market Share)
- 4.3.3. Question Mark (High Growth, Low Market Share)
- 4.3.4. Dogs (Low Growth, Low Market Share)
- 4.4. Ansoff Matrix Analysis
- 4.5. Supply Chain Analysis
- 4.6. Regulatory Landscape
- 4.7. Current Market Potential and Opportunity Assessment (TAM–SAM–SOM Framework)
- 4.8. IMR Analyst Note
- 4.1. Porters Five Forces
- 5. Market Analysis, Insights and Forecast 2021-2033
- 5.1. Market Analysis, Insights and Forecast - by Type
- 5.1.1. Video Conferencing
- 5.1.2. Video Content Management
- 5.1.3. Webcasting
- 5.1.4. Other Types
- 5.2. Market Analysis, Insights and Forecast - by Components
- 5.2.1. Hardware
- 5.2.2. Software
- 5.3. Market Analysis, Insights and Forecast - by End-user Industry
- 5.3.1. Healthcare
- 5.3.2. BFSI
- 5.3.3. IT & Telecommunications
- 5.3.4. Retail
- 5.3.5. Other End-User Industries
- 5.4. Market Analysis, Insights and Forecast - by Region
- 5.4.1. North America
- 5.4.2. Europe
- 5.4.3. Asia Pacific
- 5.4.4. Latin America
- 5.4.5. Middle East
- 5.4.6. United Arab Emirates
- 5.1. Market Analysis, Insights and Forecast - by Type
- 6. Global Enterprise Video Industry Analysis, Insights and Forecast, 2021-2033
- 6.1. Market Analysis, Insights and Forecast - by Type
- 6.1.1. Video Conferencing
- 6.1.2. Video Content Management
- 6.1.3. Webcasting
- 6.1.4. Other Types
- 6.2. Market Analysis, Insights and Forecast - by Components
- 6.2.1. Hardware
- 6.2.2. Software
- 6.3. Market Analysis, Insights and Forecast - by End-user Industry
- 6.3.1. Healthcare
- 6.3.2. BFSI
- 6.3.3. IT & Telecommunications
- 6.3.4. Retail
- 6.3.5. Other End-User Industries
- 6.1. Market Analysis, Insights and Forecast - by Type
- 7. North America Enterprise Video Industry Analysis, Insights and Forecast, 2020-2032
- 7.1. Market Analysis, Insights and Forecast - by Type
- 7.1.1. Video Conferencing
- 7.1.2. Video Content Management
- 7.1.3. Webcasting
- 7.1.4. Other Types
- 7.2. Market Analysis, Insights and Forecast - by Components
- 7.2.1. Hardware
- 7.2.2. Software
- 7.3. Market Analysis, Insights and Forecast - by End-user Industry
- 7.3.1. Healthcare
- 7.3.2. BFSI
- 7.3.3. IT & Telecommunications
- 7.3.4. Retail
- 7.3.5. Other End-User Industries
- 7.1. Market Analysis, Insights and Forecast - by Type
- 8. Europe Enterprise Video Industry Analysis, Insights and Forecast, 2020-2032
- 8.1. Market Analysis, Insights and Forecast - by Type
- 8.1.1. Video Conferencing
- 8.1.2. Video Content Management
- 8.1.3. Webcasting
- 8.1.4. Other Types
- 8.2. Market Analysis, Insights and Forecast - by Components
- 8.2.1. Hardware
- 8.2.2. Software
- 8.3. Market Analysis, Insights and Forecast - by End-user Industry
- 8.3.1. Healthcare
- 8.3.2. BFSI
- 8.3.3. IT & Telecommunications
- 8.3.4. Retail
- 8.3.5. Other End-User Industries
- 8.1. Market Analysis, Insights and Forecast - by Type
- 9. Asia Pacific Enterprise Video Industry Analysis, Insights and Forecast, 2020-2032
- 9.1. Market Analysis, Insights and Forecast - by Type
- 9.1.1. Video Conferencing
- 9.1.2. Video Content Management
- 9.1.3. Webcasting
- 9.1.4. Other Types
- 9.2. Market Analysis, Insights and Forecast - by Components
- 9.2.1. Hardware
- 9.2.2. Software
- 9.3. Market Analysis, Insights and Forecast - by End-user Industry
- 9.3.1. Healthcare
- 9.3.2. BFSI
- 9.3.3. IT & Telecommunications
- 9.3.4. Retail
- 9.3.5. Other End-User Industries
- 9.1. Market Analysis, Insights and Forecast - by Type
- 10. Latin America Enterprise Video Industry Analysis, Insights and Forecast, 2020-2032
- 10.1. Market Analysis, Insights and Forecast - by Type
- 10.1.1. Video Conferencing
- 10.1.2. Video Content Management
- 10.1.3. Webcasting
- 10.1.4. Other Types
- 10.2. Market Analysis, Insights and Forecast - by Components
- 10.2.1. Hardware
- 10.2.2. Software
- 10.3. Market Analysis, Insights and Forecast - by End-user Industry
- 10.3.1. Healthcare
- 10.3.2. BFSI
- 10.3.3. IT & Telecommunications
- 10.3.4. Retail
- 10.3.5. Other End-User Industries
- 10.1. Market Analysis, Insights and Forecast - by Type
- 11. Middle East Enterprise Video Industry Analysis, Insights and Forecast, 2020-2032
- 11.1. Market Analysis, Insights and Forecast - by Type
- 11.1.1. Video Conferencing
- 11.1.2. Video Content Management
- 11.1.3. Webcasting
- 11.1.4. Other Types
- 11.2. Market Analysis, Insights and Forecast - by Components
- 11.2.1. Hardware
- 11.2.2. Software
- 11.3. Market Analysis, Insights and Forecast - by End-user Industry
- 11.3.1. Healthcare
- 11.3.2. BFSI
- 11.3.3. IT & Telecommunications
- 11.3.4. Retail
- 11.3.5. Other End-User Industries
- 11.1. Market Analysis, Insights and Forecast - by Type
- 12. United Arab Emirates Enterprise Video Industry Analysis, Insights and Forecast, 2020-2032
- 12.1. Market Analysis, Insights and Forecast - by Type
- 12.1.1. Video Conferencing
- 12.1.2. Video Content Management
- 12.1.3. Webcasting
- 12.1.4. Other Types
- 12.2. Market Analysis, Insights and Forecast - by Components
- 12.2.1. Hardware
- 12.2.2. Software
- 12.3. Market Analysis, Insights and Forecast - by End-user Industry
- 12.3.1. Healthcare
- 12.3.2. BFSI
- 12.3.3. IT & Telecommunications
- 12.3.4. Retail
- 12.3.5. Other End-User Industries
- 12.1. Market Analysis, Insights and Forecast - by Type
- 13. Competitive Analysis
- 13.1. Company Profiles
- 13.1.1 IBM Corporation
- 13.1.1.1. Company Overview
- 13.1.1.2. Products
- 13.1.1.3. Company Financials
- 13.1.1.4. SWOT Analysis
- 13.1.2 Polycom Inc
- 13.1.2.1. Company Overview
- 13.1.2.2. Products
- 13.1.2.3. Company Financials
- 13.1.2.4. SWOT Analysis
- 13.1.3 Cisco Systems Inc
- 13.1.3.1. Company Overview
- 13.1.3.2. Products
- 13.1.3.3. Company Financials
- 13.1.3.4. SWOT Analysis
- 13.1.4 Microsoft Corporation
- 13.1.4.1. Company Overview
- 13.1.4.2. Products
- 13.1.4.3. Company Financials
- 13.1.4.4. SWOT Analysis
- 13.1.5 Adobe Inc
- 13.1.5.1. Company Overview
- 13.1.5.2. Products
- 13.1.5.3. Company Financials
- 13.1.5.4. SWOT Analysis
- 13.1.6 Kaltura Inc
- 13.1.6.1. Company Overview
- 13.1.6.2. Products
- 13.1.6.3. Company Financials
- 13.1.6.4. SWOT Analysis
- 13.1.7 Avaya Inc
- 13.1.7.1. Company Overview
- 13.1.7.2. Products
- 13.1.7.3. Company Financials
- 13.1.7.4. SWOT Analysis
- 13.1.8 Ooyala Inc
- 13.1.8.1. Company Overview
- 13.1.8.2. Products
- 13.1.8.3. Company Financials
- 13.1.8.4. SWOT Analysis
- 13.1.9 Vbrick Systems Inc
- 13.1.9.1. Company Overview
- 13.1.9.2. Products
- 13.1.9.3. Company Financials
- 13.1.9.4. SWOT Analysis
- 13.1.10 Mediaplatform Inc
- 13.1.10.1. Company Overview
- 13.1.10.2. Products
- 13.1.10.3. Company Financials
- 13.1.10.4. SWOT Analysis
- 13.1.11 Brightcove Inc
- 13.1.11.1. Company Overview
- 13.1.11.2. Products
- 13.1.11.3. Company Financials
- 13.1.11.4. SWOT Analysis
- 13.1.12 Vidyo Inc
- 13.1.12.1. Company Overview
- 13.1.12.2. Products
- 13.1.12.3. Company Financials
- 13.1.12.4. SWOT Analysis
- 13.1.1 IBM Corporation
- 13.2. Market Entropy
- 13.2.1 Company's Key Areas Served
- 13.2.2 Recent Developments
- 13.3. Company Market Share Analysis 2025
- 13.3.1 Top 5 Companies Market Share Analysis
- 13.3.2 Top 3 Companies Market Share Analysis
- 13.4. List of Potential Customers
- 14. Research Methodology
List of Figures
- Figure 1: Global Enterprise Video Industry Revenue Breakdown (billion, %) by Region 2025 & 2033
- Figure 2: Global Enterprise Video Industry Volume Breakdown (K Unit, %) by Region 2025 & 2033
- Figure 3: North America Enterprise Video Industry Revenue (billion), by Type 2025 & 2033
- Figure 4: North America Enterprise Video Industry Volume (K Unit), by Type 2025 & 2033
- Figure 5: North America Enterprise Video Industry Revenue Share (%), by Type 2025 & 2033
- Figure 6: North America Enterprise Video Industry Volume Share (%), by Type 2025 & 2033
- Figure 7: North America Enterprise Video Industry Revenue (billion), by Components 2025 & 2033
- Figure 8: North America Enterprise Video Industry Volume (K Unit), by Components 2025 & 2033
- Figure 9: North America Enterprise Video Industry Revenue Share (%), by Components 2025 & 2033
- Figure 10: North America Enterprise Video Industry Volume Share (%), by Components 2025 & 2033
- Figure 11: North America Enterprise Video Industry Revenue (billion), by End-user Industry 2025 & 2033
- Figure 12: North America Enterprise Video Industry Volume (K Unit), by End-user Industry 2025 & 2033
- Figure 13: North America Enterprise Video Industry Revenue Share (%), by End-user Industry 2025 & 2033
- Figure 14: North America Enterprise Video Industry Volume Share (%), by End-user Industry 2025 & 2033
- Figure 15: North America Enterprise Video Industry Revenue (billion), by Country 2025 & 2033
- Figure 16: North America Enterprise Video Industry Volume (K Unit), by Country 2025 & 2033
- Figure 17: North America Enterprise Video Industry Revenue Share (%), by Country 2025 & 2033
- Figure 18: North America Enterprise Video Industry Volume Share (%), by Country 2025 & 2033
- Figure 19: Europe Enterprise Video Industry Revenue (billion), by Type 2025 & 2033
- Figure 20: Europe Enterprise Video Industry Volume (K Unit), by Type 2025 & 2033
- Figure 21: Europe Enterprise Video Industry Revenue Share (%), by Type 2025 & 2033
- Figure 22: Europe Enterprise Video Industry Volume Share (%), by Type 2025 & 2033
- Figure 23: Europe Enterprise Video Industry Revenue (billion), by Components 2025 & 2033
- Figure 24: Europe Enterprise Video Industry Volume (K Unit), by Components 2025 & 2033
- Figure 25: Europe Enterprise Video Industry Revenue Share (%), by Components 2025 & 2033
- Figure 26: Europe Enterprise Video Industry Volume Share (%), by Components 2025 & 2033
- Figure 27: Europe Enterprise Video Industry Revenue (billion), by End-user Industry 2025 & 2033
- Figure 28: Europe Enterprise Video Industry Volume (K Unit), by End-user Industry 2025 & 2033
- Figure 29: Europe Enterprise Video Industry Revenue Share (%), by End-user Industry 2025 & 2033
- Figure 30: Europe Enterprise Video Industry Volume Share (%), by End-user Industry 2025 & 2033
- Figure 31: Europe Enterprise Video Industry Revenue (billion), by Country 2025 & 2033
- Figure 32: Europe Enterprise Video Industry Volume (K Unit), by Country 2025 & 2033
- Figure 33: Europe Enterprise Video Industry Revenue Share (%), by Country 2025 & 2033
- Figure 34: Europe Enterprise Video Industry Volume Share (%), by Country 2025 & 2033
- Figure 35: Asia Pacific Enterprise Video Industry Revenue (billion), by Type 2025 & 2033
- Figure 36: Asia Pacific Enterprise Video Industry Volume (K Unit), by Type 2025 & 2033
- Figure 37: Asia Pacific Enterprise Video Industry Revenue Share (%), by Type 2025 & 2033
- Figure 38: Asia Pacific Enterprise Video Industry Volume Share (%), by Type 2025 & 2033
- Figure 39: Asia Pacific Enterprise Video Industry Revenue (billion), by Components 2025 & 2033
- Figure 40: Asia Pacific Enterprise Video Industry Volume (K Unit), by Components 2025 & 2033
- Figure 41: Asia Pacific Enterprise Video Industry Revenue Share (%), by Components 2025 & 2033
- Figure 42: Asia Pacific Enterprise Video Industry Volume Share (%), by Components 2025 & 2033
- Figure 43: Asia Pacific Enterprise Video Industry Revenue (billion), by End-user Industry 2025 & 2033
- Figure 44: Asia Pacific Enterprise Video Industry Volume (K Unit), by End-user Industry 2025 & 2033
- Figure 45: Asia Pacific Enterprise Video Industry Revenue Share (%), by End-user Industry 2025 & 2033
- Figure 46: Asia Pacific Enterprise Video Industry Volume Share (%), by End-user Industry 2025 & 2033
- Figure 47: Asia Pacific Enterprise Video Industry Revenue (billion), by Country 2025 & 2033
- Figure 48: Asia Pacific Enterprise Video Industry Volume (K Unit), by Country 2025 & 2033
- Figure 49: Asia Pacific Enterprise Video Industry Revenue Share (%), by Country 2025 & 2033
- Figure 50: Asia Pacific Enterprise Video Industry Volume Share (%), by Country 2025 & 2033
- Figure 51: Latin America Enterprise Video Industry Revenue (billion), by Type 2025 & 2033
- Figure 52: Latin America Enterprise Video Industry Volume (K Unit), by Type 2025 & 2033
- Figure 53: Latin America Enterprise Video Industry Revenue Share (%), by Type 2025 & 2033
- Figure 54: Latin America Enterprise Video Industry Volume Share (%), by Type 2025 & 2033
- Figure 55: Latin America Enterprise Video Industry Revenue (billion), by Components 2025 & 2033
- Figure 56: Latin America Enterprise Video Industry Volume (K Unit), by Components 2025 & 2033
- Figure 57: Latin America Enterprise Video Industry Revenue Share (%), by Components 2025 & 2033
- Figure 58: Latin America Enterprise Video Industry Volume Share (%), by Components 2025 & 2033
- Figure 59: Latin America Enterprise Video Industry Revenue (billion), by End-user Industry 2025 & 2033
- Figure 60: Latin America Enterprise Video Industry Volume (K Unit), by End-user Industry 2025 & 2033
- Figure 61: Latin America Enterprise Video Industry Revenue Share (%), by End-user Industry 2025 & 2033
- Figure 62: Latin America Enterprise Video Industry Volume Share (%), by End-user Industry 2025 & 2033
- Figure 63: Latin America Enterprise Video Industry Revenue (billion), by Country 2025 & 2033
- Figure 64: Latin America Enterprise Video Industry Volume (K Unit), by Country 2025 & 2033
- Figure 65: Latin America Enterprise Video Industry Revenue Share (%), by Country 2025 & 2033
- Figure 66: Latin America Enterprise Video Industry Volume Share (%), by Country 2025 & 2033
- Figure 67: Middle East Enterprise Video Industry Revenue (billion), by Type 2025 & 2033
- Figure 68: Middle East Enterprise Video Industry Volume (K Unit), by Type 2025 & 2033
- Figure 69: Middle East Enterprise Video Industry Revenue Share (%), by Type 2025 & 2033
- Figure 70: Middle East Enterprise Video Industry Volume Share (%), by Type 2025 & 2033
- Figure 71: Middle East Enterprise Video Industry Revenue (billion), by Components 2025 & 2033
- Figure 72: Middle East Enterprise Video Industry Volume (K Unit), by Components 2025 & 2033
- Figure 73: Middle East Enterprise Video Industry Revenue Share (%), by Components 2025 & 2033
- Figure 74: Middle East Enterprise Video Industry Volume Share (%), by Components 2025 & 2033
- Figure 75: Middle East Enterprise Video Industry Revenue (billion), by End-user Industry 2025 & 2033
- Figure 76: Middle East Enterprise Video Industry Volume (K Unit), by End-user Industry 2025 & 2033
- Figure 77: Middle East Enterprise Video Industry Revenue Share (%), by End-user Industry 2025 & 2033
- Figure 78: Middle East Enterprise Video Industry Volume Share (%), by End-user Industry 2025 & 2033
- Figure 79: Middle East Enterprise Video Industry Revenue (billion), by Country 2025 & 2033
- Figure 80: Middle East Enterprise Video Industry Volume (K Unit), by Country 2025 & 2033
- Figure 81: Middle East Enterprise Video Industry Revenue Share (%), by Country 2025 & 2033
- Figure 82: Middle East Enterprise Video Industry Volume Share (%), by Country 2025 & 2033
- Figure 83: United Arab Emirates Enterprise Video Industry Revenue (billion), by Type 2025 & 2033
- Figure 84: United Arab Emirates Enterprise Video Industry Volume (K Unit), by Type 2025 & 2033
- Figure 85: United Arab Emirates Enterprise Video Industry Revenue Share (%), by Type 2025 & 2033
- Figure 86: United Arab Emirates Enterprise Video Industry Volume Share (%), by Type 2025 & 2033
- Figure 87: United Arab Emirates Enterprise Video Industry Revenue (billion), by Components 2025 & 2033
- Figure 88: United Arab Emirates Enterprise Video Industry Volume (K Unit), by Components 2025 & 2033
- Figure 89: United Arab Emirates Enterprise Video Industry Revenue Share (%), by Components 2025 & 2033
- Figure 90: United Arab Emirates Enterprise Video Industry Volume Share (%), by Components 2025 & 2033
- Figure 91: United Arab Emirates Enterprise Video Industry Revenue (billion), by End-user Industry 2025 & 2033
- Figure 92: United Arab Emirates Enterprise Video Industry Volume (K Unit), by End-user Industry 2025 & 2033
- Figure 93: United Arab Emirates Enterprise Video Industry Revenue Share (%), by End-user Industry 2025 & 2033
- Figure 94: United Arab Emirates Enterprise Video Industry Volume Share (%), by End-user Industry 2025 & 2033
- Figure 95: United Arab Emirates Enterprise Video Industry Revenue (billion), by Country 2025 & 2033
- Figure 96: United Arab Emirates Enterprise Video Industry Volume (K Unit), by Country 2025 & 2033
- Figure 97: United Arab Emirates Enterprise Video Industry Revenue Share (%), by Country 2025 & 2033
- Figure 98: United Arab Emirates Enterprise Video Industry Volume Share (%), by Country 2025 & 2033
List of Tables
- Table 1: Global Enterprise Video Industry Revenue billion Forecast, by Type 2020 & 2033
- Table 2: Global Enterprise Video Industry Volume K Unit Forecast, by Type 2020 & 2033
- Table 3: Global Enterprise Video Industry Revenue billion Forecast, by Components 2020 & 2033
- Table 4: Global Enterprise Video Industry Volume K Unit Forecast, by Components 2020 & 2033
- Table 5: Global Enterprise Video Industry Revenue billion Forecast, by End-user Industry 2020 & 2033
- Table 6: Global Enterprise Video Industry Volume K Unit Forecast, by End-user Industry 2020 & 2033
- Table 7: Global Enterprise Video Industry Revenue billion Forecast, by Region 2020 & 2033
- Table 8: Global Enterprise Video Industry Volume K Unit Forecast, by Region 2020 & 2033
- Table 9: Global Enterprise Video Industry Revenue billion Forecast, by Type 2020 & 2033
- Table 10: Global Enterprise Video Industry Volume K Unit Forecast, by Type 2020 & 2033
- Table 11: Global Enterprise Video Industry Revenue billion Forecast, by Components 2020 & 2033
- Table 12: Global Enterprise Video Industry Volume K Unit Forecast, by Components 2020 & 2033
- Table 13: Global Enterprise Video Industry Revenue billion Forecast, by End-user Industry 2020 & 2033
- Table 14: Global Enterprise Video Industry Volume K Unit Forecast, by End-user Industry 2020 & 2033
- Table 15: Global Enterprise Video Industry Revenue billion Forecast, by Country 2020 & 2033
- Table 16: Global Enterprise Video Industry Volume K Unit Forecast, by Country 2020 & 2033
- Table 17: United States Enterprise Video Industry Revenue (billion) Forecast, by Application 2020 & 2033
- Table 18: United States Enterprise Video Industry Volume (K Unit) Forecast, by Application 2020 & 2033
- Table 19: Canada Enterprise Video Industry Revenue (billion) Forecast, by Application 2020 & 2033
- Table 20: Canada Enterprise Video Industry Volume (K Unit) Forecast, by Application 2020 & 2033
- Table 21: Global Enterprise Video Industry Revenue billion Forecast, by Type 2020 & 2033
- Table 22: Global Enterprise Video Industry Volume K Unit Forecast, by Type 2020 & 2033
- Table 23: Global Enterprise Video Industry Revenue billion Forecast, by Components 2020 & 2033
- Table 24: Global Enterprise Video Industry Volume K Unit Forecast, by Components 2020 & 2033
- Table 25: Global Enterprise Video Industry Revenue billion Forecast, by End-user Industry 2020 & 2033
- Table 26: Global Enterprise Video Industry Volume K Unit Forecast, by End-user Industry 2020 & 2033
- Table 27: Global Enterprise Video Industry Revenue billion Forecast, by Country 2020 & 2033
- Table 28: Global Enterprise Video Industry Volume K Unit Forecast, by Country 2020 & 2033
- Table 29: United Kingdom Enterprise Video Industry Revenue (billion) Forecast, by Application 2020 & 2033
- Table 30: United Kingdom Enterprise Video Industry Volume (K Unit) Forecast, by Application 2020 & 2033
- Table 31: Germany Enterprise Video Industry Revenue (billion) Forecast, by Application 2020 & 2033
- Table 32: Germany Enterprise Video Industry Volume (K Unit) Forecast, by Application 2020 & 2033
- Table 33: France Enterprise Video Industry Revenue (billion) Forecast, by Application 2020 & 2033
- Table 34: France Enterprise Video Industry Volume (K Unit) Forecast, by Application 2020 & 2033
- Table 35: Rest of Europe Enterprise Video Industry Revenue (billion) Forecast, by Application 2020 & 2033
- Table 36: Rest of Europe Enterprise Video Industry Volume (K Unit) Forecast, by Application 2020 & 2033
- Table 37: Global Enterprise Video Industry Revenue billion Forecast, by Type 2020 & 2033
- Table 38: Global Enterprise Video Industry Volume K Unit Forecast, by Type 2020 & 2033
- Table 39: Global Enterprise Video Industry Revenue billion Forecast, by Components 2020 & 2033
- Table 40: Global Enterprise Video Industry Volume K Unit Forecast, by Components 2020 & 2033
- Table 41: Global Enterprise Video Industry Revenue billion Forecast, by End-user Industry 2020 & 2033
- Table 42: Global Enterprise Video Industry Volume K Unit Forecast, by End-user Industry 2020 & 2033
- Table 43: Global Enterprise Video Industry Revenue billion Forecast, by Country 2020 & 2033
- Table 44: Global Enterprise Video Industry Volume K Unit Forecast, by Country 2020 & 2033
- Table 45: China Enterprise Video Industry Revenue (billion) Forecast, by Application 2020 & 2033
- Table 46: China Enterprise Video Industry Volume (K Unit) Forecast, by Application 2020 & 2033
- Table 47: Japan Enterprise Video Industry Revenue (billion) Forecast, by Application 2020 & 2033
- Table 48: Japan Enterprise Video Industry Volume (K Unit) Forecast, by Application 2020 & 2033
- Table 49: Australia Enterprise Video Industry Revenue (billion) Forecast, by Application 2020 & 2033
- Table 50: Australia Enterprise Video Industry Volume (K Unit) Forecast, by Application 2020 & 2033
- Table 51: Rest of Asia Pacific Enterprise Video Industry Revenue (billion) Forecast, by Application 2020 & 2033
- Table 52: Rest of Asia Pacific Enterprise Video Industry Volume (K Unit) Forecast, by Application 2020 & 2033
- Table 53: Global Enterprise Video Industry Revenue billion Forecast, by Type 2020 & 2033
- Table 54: Global Enterprise Video Industry Volume K Unit Forecast, by Type 2020 & 2033
- Table 55: Global Enterprise Video Industry Revenue billion Forecast, by Components 2020 & 2033
- Table 56: Global Enterprise Video Industry Volume K Unit Forecast, by Components 2020 & 2033
- Table 57: Global Enterprise Video Industry Revenue billion Forecast, by End-user Industry 2020 & 2033
- Table 58: Global Enterprise Video Industry Volume K Unit Forecast, by End-user Industry 2020 & 2033
- Table 59: Global Enterprise Video Industry Revenue billion Forecast, by Country 2020 & 2033
- Table 60: Global Enterprise Video Industry Volume K Unit Forecast, by Country 2020 & 2033
- Table 61: Mexico Enterprise Video Industry Revenue (billion) Forecast, by Application 2020 & 2033
- Table 62: Mexico Enterprise Video Industry Volume (K Unit) Forecast, by Application 2020 & 2033
- Table 63: Brazil Enterprise Video Industry Revenue (billion) Forecast, by Application 2020 & 2033
- Table 64: Brazil Enterprise Video Industry Volume (K Unit) Forecast, by Application 2020 & 2033
- Table 65: Rest of Latin America Enterprise Video Industry Revenue (billion) Forecast, by Application 2020 & 2033
- Table 66: Rest of Latin America Enterprise Video Industry Volume (K Unit) Forecast, by Application 2020 & 2033
- Table 67: Global Enterprise Video Industry Revenue billion Forecast, by Type 2020 & 2033
- Table 68: Global Enterprise Video Industry Volume K Unit Forecast, by Type 2020 & 2033
- Table 69: Global Enterprise Video Industry Revenue billion Forecast, by Components 2020 & 2033
- Table 70: Global Enterprise Video Industry Volume K Unit Forecast, by Components 2020 & 2033
- Table 71: Global Enterprise Video Industry Revenue billion Forecast, by End-user Industry 2020 & 2033
- Table 72: Global Enterprise Video Industry Volume K Unit Forecast, by End-user Industry 2020 & 2033
- Table 73: Global Enterprise Video Industry Revenue billion Forecast, by Country 2020 & 2033
- Table 74: Global Enterprise Video Industry Volume K Unit Forecast, by Country 2020 & 2033
- Table 75: Global Enterprise Video Industry Revenue billion Forecast, by Type 2020 & 2033
- Table 76: Global Enterprise Video Industry Volume K Unit Forecast, by Type 2020 & 2033
- Table 77: Global Enterprise Video Industry Revenue billion Forecast, by Components 2020 & 2033
- Table 78: Global Enterprise Video Industry Volume K Unit Forecast, by Components 2020 & 2033
- Table 79: Global Enterprise Video Industry Revenue billion Forecast, by End-user Industry 2020 & 2033
- Table 80: Global Enterprise Video Industry Volume K Unit Forecast, by End-user Industry 2020 & 2033
- Table 81: Global Enterprise Video Industry Revenue billion Forecast, by Country 2020 & 2033
- Table 82: Global Enterprise Video Industry Volume K Unit Forecast, by Country 2020 & 2033
- Table 83: Saudi Arabia Enterprise Video Industry Revenue (billion) Forecast, by Application 2020 & 2033
- Table 84: Saudi Arabia Enterprise Video Industry Volume (K Unit) Forecast, by Application 2020 & 2033
- Table 85: Rest of Middle East Enterprise Video Industry Revenue (billion) Forecast, by Application 2020 & 2033
- Table 86: Rest of Middle East Enterprise Video Industry Volume (K Unit) Forecast, by Application 2020 & 2033
Frequently Asked Questions
1. What is the projected Compound Annual Growth Rate (CAGR) of the Enterprise Video Industry?
The projected CAGR is approximately 17.2%.
2. Which companies are prominent players in the Enterprise Video Industry?
Key companies in the market include IBM Corporation, Polycom Inc, Cisco Systems Inc, Microsoft Corporation, Adobe Inc, Kaltura Inc, Avaya Inc, Ooyala Inc, Vbrick Systems Inc, Mediaplatform Inc, Brightcove Inc, Vidyo Inc.
3. What are the main segments of the Enterprise Video Industry?
The market segments include Type, Components, End-user Industry.
4. Can you provide details about the market size?
The market size is estimated to be USD 25.11 billion as of 2022.
5. What are some drivers contributing to market growth?
Growing Size of Organizations; Increasing Need for Real Time Communication.
6. What are the notable trends driving market growth?
Healthcare to Hold a Significant Market Share during the Forecast Period.
7. Are there any restraints impacting market growth?
High Cost of Deployment.
8. Can you provide examples of recent developments in the market?
January 2022 - BlueJeans by Verizon was selected as the video conferencing provider for the Canadian National Research and Education Network (NREN). The research and education networks federation spans 13 provinces and territories, connecting over 750 universities, colleges, CÉGEPs, research hospitals, government research labs, school boards, business incubators, and accelerators to each other and their federal partner, CANARIE. The contract extends the capabilities to make the platform available to schools to engage students in interactive and collaborative educational experiences.
9. What pricing options are available for accessing the report?
Pricing options include single-user, multi-user, and enterprise licenses priced at USD 4750, USD 5250, and USD 8750 respectively.
10. Is the market size provided in terms of value or volume?
The market size is provided in terms of value, measured in billion and volume, measured in K Unit.
11. Are there any specific market keywords associated with the report?
Yes, the market keyword associated with the report is "Enterprise Video Industry," which aids in identifying and referencing the specific market segment covered.
12. How do I determine which pricing option suits my needs best?
The pricing options vary based on user requirements and access needs. Individual users may opt for single-user licenses, while businesses requiring broader access may choose multi-user or enterprise licenses for cost-effective access to the report.
13. Are there any additional resources or data provided in the Enterprise Video Industry report?
While the report offers comprehensive insights, it's advisable to review the specific contents or supplementary materials provided to ascertain if additional resources or data are available.
14. How can I stay updated on further developments or reports in the Enterprise Video Industry?
To stay informed about further developments, trends, and reports in the Enterprise Video Industry, consider subscribing to industry newsletters, following relevant companies and organizations, or regularly checking reputable industry news sources and publications.
Methodology
Step 1 - Identification of Relevant Samples Size from Population Database


Step 2 - Approaches for Defining Global Market Size (Value, Volume* & Price*)

Note*: In applicable scenarios
Step 3 - Data Sources
Primary Research
- Web Analytics
- Survey Reports
- Research Institute
- Latest Research Reports
- Opinion Leaders
Secondary Research
- Annual Reports
- White Paper
- Latest Press Release
- Industry Association
- Paid Database
- Investor Presentations

Step 4 - Data Triangulation
Involves using different sources of information in order to increase the validity of a study
These sources are likely to be stakeholders in a program - participants, other researchers, program staff, other community members, and so on.
Then we put all data in single framework & apply various statistical tools to find out the dynamic on the market.
During the analysis stage, feedback from the stakeholder groups would be compared to determine areas of agreement as well as areas of divergence