

Key Insights
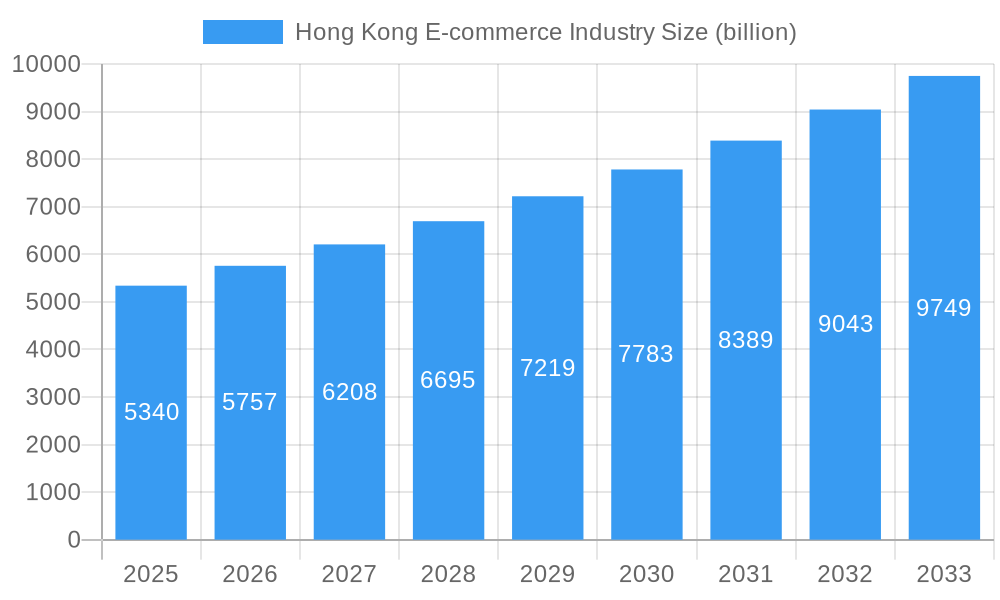
The Hong Kong E-commerce Industry is poised for significant expansion, projecting a market size of $5.34 billion in 2025 and demonstrating a robust CAGR of 7.87% throughout the forecast period. This growth is primarily fueled by evolving consumer preferences for convenience and wider product accessibility, alongside advancements in digital infrastructure and payment solutions within Hong Kong. The increasing adoption of smartphones and high-speed internet penetration further bolsters online shopping habits. Key drivers include the burgeoning B2C segment, which encompasses diverse applications like Beauty and Personal Care, Consumer Electronics, Fashion and Apparel, and Food and Beverage, all experiencing substantial year-on-year growth. The convenience and wider selection offered by online platforms continue to attract a growing number of consumers, making e-commerce an indispensable part of daily life. Furthermore, the B2B e-commerce sector is also witnessing steady growth as businesses increasingly leverage online channels for procurement and sales, enhancing operational efficiency and expanding market reach.
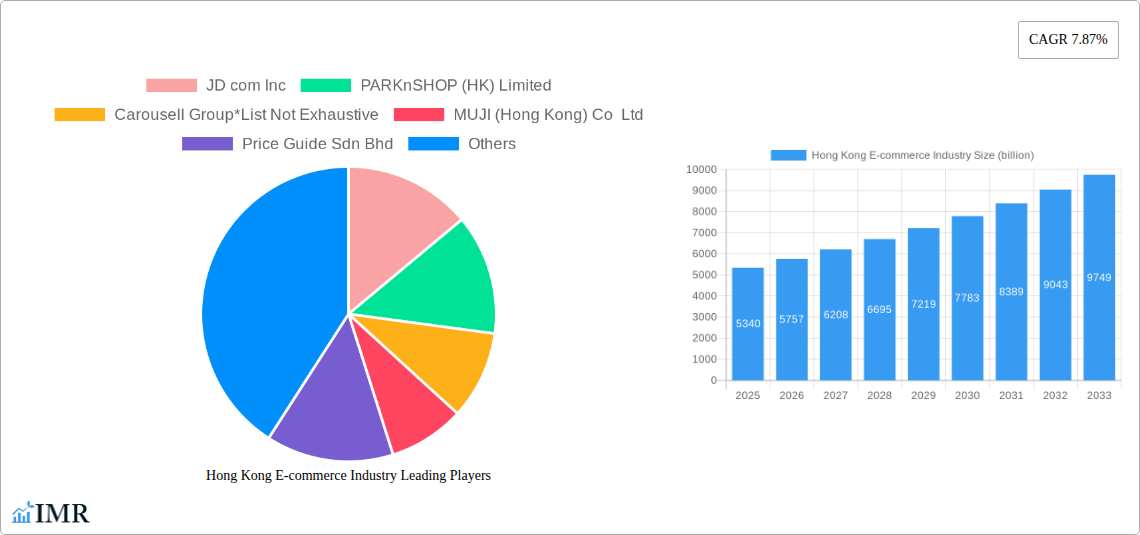
Hong Kong E-commerce Industry Market Size (In Billion)
The industry's trajectory is characterized by several prominent trends, including the rise of social commerce, the integration of AI for personalized shopping experiences, and the growing importance of seamless last-mile delivery solutions. While the market is propelled by these factors, it also faces certain restraints, such as evolving regulatory landscapes concerning data privacy and consumer protection, and the intense competition among established e-commerce giants and emerging players. However, the inherent dynamism of the Hong Kong market, coupled with strong governmental support for digital innovation, suggests these challenges will be navigated effectively. The market's segmentation reveals that Beauty and Personal Care and Fashion and Apparel are leading growth areas within the B2C segment, reflecting consumer demand for curated and readily available lifestyle products. This dynamic environment presents significant opportunities for businesses willing to adapt to evolving consumer behaviors and technological advancements.
Hong Kong E-commerce Industry Company Market Share
Dive deep into the pulsating Hong Kong e-commerce industry with this in-depth market analysis, meticulously designed to equip industry professionals with actionable insights. Spanning the historical period of 2019-2024 and projecting forward through a comprehensive forecast period of 2025-2033, this report leverages the base year of 2025 for critical estimations. Explore the immense growth potential of both the B2C e-commerce and B2B e-commerce sectors, identifying key players, emerging trends, and the strategic imperatives for success in this rapidly evolving digital marketplace.
Hong Kong E-commerce Industry Market Dynamics & Structure
The Hong Kong e-commerce market is characterized by a dynamic interplay of factors shaping its competitive landscape. Market concentration remains moderate, with a significant presence of both established global players and agile local businesses. Technological innovation is a primary driver, with advancements in AI, logistics automation, and payment gateways continuously redefining consumer and business experiences. The regulatory framework, while evolving, generally supports digital commerce, fostering a conducive environment for growth. Competitive product substitutes are abundant, intensifying the need for unique value propositions and superior customer service. End-user demographics are increasingly digitally savvy, demanding convenience, personalization, and seamless omnichannel experiences. Mergers and Acquisitions (M&A) trends are evident as larger entities seek to consolidate market share and acquire innovative technologies.
- Market Concentration: A mix of global giants and local specialists, with room for niche players.
- Technological Innovation Drivers: AI-powered personalization, advanced logistics, secure payment solutions.
- Regulatory Framework: Supportive policies encouraging digital transformation and consumer protection.
- Competitive Product Substitutes: Wide array of goods and services across all categories.
- End-User Demographics: Young, tech-literate consumers with high expectations for convenience and speed.
- M&A Trends: Strategic acquisitions to enhance capabilities and expand market reach.
Hong Kong E-commerce Industry Growth Trends & Insights
The Hong Kong e-commerce market is poised for significant expansion, driven by a confluence of technological advancements and shifting consumer behaviors. The B2C e-commerce market size is projected to witness robust growth, with an estimated Gross Merchandise Volume (GMV) for the period of 2017-2027 and beyond, indicating a sustained upward trajectory. This growth is fueled by increasing internet penetration, widespread smartphone adoption, and a growing comfort level with online transactions. Technological disruptions, such as the rise of mobile commerce and the integration of social media into shopping experiences, are reshaping how consumers discover and purchase products.
The B2B e-commerce market is also a critical component of this growth narrative, with its market size steadily increasing from 2017 through the projected 2027 and beyond. Businesses are increasingly recognizing the efficiency and cost-effectiveness of online procurement, supply chain management, and digital sales channels. This evolution is supported by ongoing investments in digital infrastructure and a growing acceptance of digital payment solutions.
Consumer behavior is a pivotal element in this growth story. Shoppers are increasingly valuing convenience, personalization, and personalized recommendations, driving businesses to invest in data analytics and customer relationship management. The adoption rate of various e-commerce platforms and services is on the rise, reflecting a broader societal shift towards digital consumption. Key metrics such as Compound Annual Growth Rate (CAGR) are expected to remain strong, underscoring the market's inherent vitality. Market penetration will continue to deepen as more traditional businesses embrace online channels and consumers become more accustomed to digital purchasing.
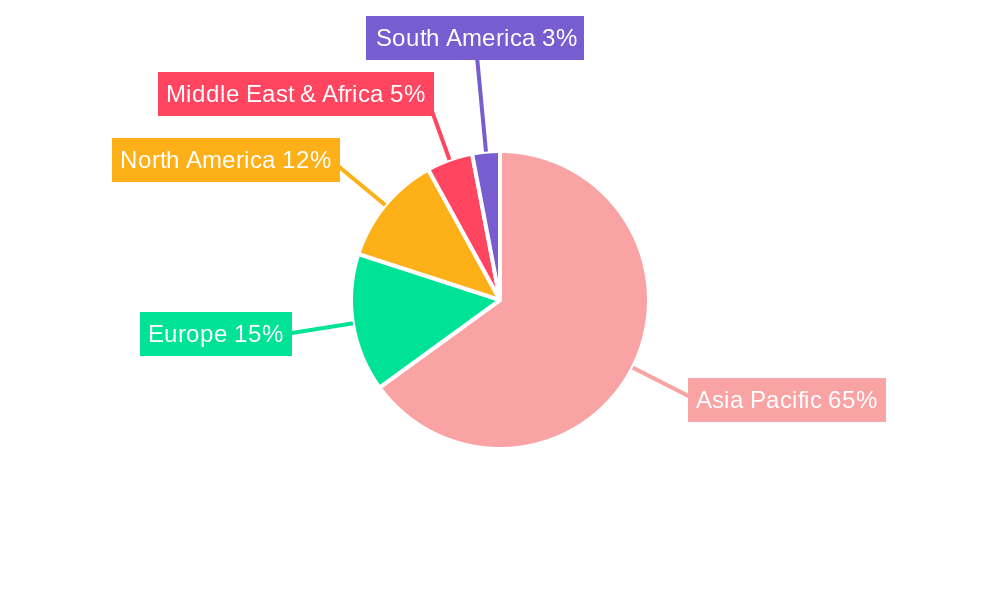
Dominant Regions, Countries, or Segments in Hong Kong E-commerce Industry
The Hong Kong e-commerce industry is predominantly shaped by the thriving B2C e-commerce segment, which consistently demonstrates substantial market size (GMV) across the projected period of 2017-2027 and beyond. Within this, the Fashion and Apparel segment has historically been a leading contributor, driven by the city's status as a global fashion hub and a discerning consumer base with a strong appetite for trends. However, the Consumer Electronics segment also holds significant sway, propelled by early adoption of new technologies and a high disposable income among its population.
The Food and Beverage and Beauty and Personal Care segments are experiencing accelerated growth, fueled by convenience-driven purchasing habits and a growing demand for premium and specialized products. The "Others" category, encompassing Toys, DIY, Media, and more, also represents a growing force, reflecting the diversification of online shopping habits. The B2B e-commerce market size, while distinct, complements the B2C landscape by facilitating business operations and supply chains, contributing to the overall digital economy.
Key drivers for this dominance include Hong Kong's robust digital infrastructure, its strategic location as a gateway to mainland China, and its high internet and smartphone penetration rates. Government initiatives promoting digital transformation and a well-developed logistics network further bolster growth. Market share within these dominant segments is contested by major players such as JD.com Inc, Carousell Group, and Alibaba Group, alongside established retailers adapting to the online sphere.
- Leading Segment: B2C E-commerce, with Fashion and Apparel, and Consumer Electronics as key contributors.
- Growth Accelerators: Increasing disposable income, demand for convenience, and rising digital literacy.
- Key Drivers: Advanced digital infrastructure, strategic location, supportive government policies.
- Market Share Contenders: JD.com Inc, Carousell Group, Alibaba Group, Amazon com Inc.
- Growth Potential: Significant opportunities in Food and Beverage and Beauty and Personal Care segments.
Hong Kong E-commerce Industry Product Landscape
The Hong Kong e-commerce industry is characterized by a diverse and rapidly evolving product landscape, driven by innovation and changing consumer demands. From the latest consumer electronics and cutting-edge fashion and apparel to everyday necessities in food and beverage and personal care items, online platforms offer an extensive range. The furniture and home category is also seeing increased traction, with online retailers providing convenient delivery and assembly services. Beauty and personal care products, often featuring personalized recommendations and subscription models, are particularly popular. Technological advancements are integrated into product offerings, such as smart home devices and sustainable fashion options.
Key Drivers, Barriers & Challenges in Hong Kong E-commerce Industry
Key Drivers: The Hong Kong e-commerce industry is propelled by several key drivers, including a digitally savvy population with high internet and smartphone penetration, a robust logistics infrastructure that ensures efficient delivery, and government support for digital economy initiatives. Growing disposable incomes and a desire for convenience further fuel online shopping. The increasing adoption of mobile payments and digital wallets simplifies transactions, making online purchasing more accessible.
Barriers & Challenges: Despite its growth, the industry faces challenges such as intense competition from both local and international players, leading to price wars and pressure on profit margins. Evolving data privacy regulations and the need for robust cybersecurity measures present ongoing hurdles. Supply chain disruptions, particularly in a globalized context, can impact product availability and delivery times. Maintaining customer loyalty in a crowded marketplace and managing the cost of customer acquisition are also significant challenges.
Emerging Opportunities in Hong Kong E-commerce Industry
Emerging opportunities in the Hong Kong e-commerce industry lie in the continued expansion of cross-border e-commerce, particularly leveraging Hong Kong's strategic position. The growing demand for sustainable and ethically sourced products presents a significant niche. Innovations in augmented reality (AR) and virtual reality (VR) for enhanced online shopping experiences, especially in fashion and home decor, are ripe for exploration. Furthermore, the untapped potential in personalized health and wellness e-commerce solutions and the increasing adoption of e-commerce by small and medium-sized enterprises (SMEs) offer substantial growth avenues.
Growth Accelerators in the Hong Kong E-commerce Industry Industry
Catalysts for sustained growth in the Hong Kong e-commerce industry include ongoing technological advancements in artificial intelligence for personalized customer journeys and predictive analytics, driving higher conversion rates and customer retention. Strategic partnerships between e-commerce platforms, logistics providers, and payment gateways are crucial for creating seamless omnichannel experiences. Market expansion strategies, such as entering new product categories or targeting underserved demographics, will further accelerate growth. The development of sophisticated supply chain management systems and the adoption of eco-friendly delivery solutions also contribute to long-term expansion.
Key Players Shaping the Hong Kong E-commerce Industry Market
- JD com Inc
- PARKnSHOP (HK) Limited
- Carousell Group
- MUJI (Hong Kong) Co Ltd
- Price Guide Sdn Bhd
- Amazon com Inc
- Alibaba Group
- Hong Kong TV Shopping Network Limited
- eBay Inc
- WeChat Pay Hong Kong Limited
Notable Milestones in Hong Kong E-commerce Industry Sector
- May 2022: YesAsia, a global online retailer, announced a partnership with Geek+, an autonomous robots company, to build YesAsia's first smart warehouse at Goodman Interlink, located in Tsing Yi, Hong Kong.
- April 2022: Beauty retailer Sa Sa International partnered with Foodpanda to provide on-demand delivery services in Hong Kong. This service was initially started as a pilot project with 20 stores offering approximately 700 products on Foodpanda Mall.
In-Depth Hong Kong E-commerce Industry Market Outlook
The Hong Kong e-commerce industry is poised for a future marked by sustained growth and innovation. Key opportunities lie in leveraging advanced technologies like AI for hyper-personalization and in expanding cross-border trade. Strategic collaborations will be instrumental in building robust ecosystems that enhance customer convenience and operational efficiency. The industry's outlook is further bolstered by evolving consumer preferences for sustainable and ethical consumption, alongside the continued digital transformation of businesses. The market is expected to see increased investment in logistics and payment infrastructure, ensuring a seamless and secure online shopping experience for all.
Hong Kong E-commerce Industry Segmentation
-
1. B2C ecommerce
- 1.1. Market size (GMV) for the period of 2017-2027
-
1.2. Market Segmentation - by Application
- 1.2.1. Beauty and Personal Care
- 1.2.2. Consumer Electronics
- 1.2.3. Fashion and Apparel
- 1.2.4. Food and Beverage
- 1.2.5. Furniture and Home
- 1.2.6. Others (Toys, DIY, Media, etc.)
- 2. Market size (GMV) for the period of 2017-2027
-
3. Application
- 3.1. Beauty and Personal Care
- 3.2. Consumer Electronics
- 3.3. Fashion and Apparel
- 3.4. Food and Beverage
- 3.5. Furniture and Home
- 3.6. Others (Toys, DIY, Media, etc.)
- 4. Beauty and Personal Care
- 5. Consumer Electronics
- 6. Fashion and Apparel
- 7. Food and Beverage
- 8. Furniture and Home
- 9. Others (Toys, DIY, Media, etc.)
-
10. B2B ecommerce
- 10.1. Market size for the period of 2017-2027
Hong Kong E-commerce Industry Segmentation By Geography
-
1. North America
- 1.1. United States
- 1.2. Canada
- 1.3. Mexico
-
2. South America
- 2.1. Brazil
- 2.2. Argentina
- 2.3. Rest of South America
-
3. Europe
- 3.1. United Kingdom
- 3.2. Germany
- 3.3. France
- 3.4. Italy
- 3.5. Spain
- 3.6. Russia
- 3.7. Benelux
- 3.8. Nordics
- 3.9. Rest of Europe
-
4. Middle East & Africa
- 4.1. Turkey
- 4.2. Israel
- 4.3. GCC
- 4.4. North Africa
- 4.5. South Africa
- 4.6. Rest of Middle East & Africa
-
5. Asia Pacific
- 5.1. China
- 5.2. India
- 5.3. Japan
- 5.4. South Korea
- 5.5. ASEAN
- 5.6. Oceania
- 5.7. Rest of Asia Pacific
Hong Kong E-commerce Industry Regional Market Share
Geographic Coverage of Hong Kong E-commerce Industry
Hong Kong E-commerce Industry REPORT HIGHLIGHTS
| Aspects | Details |
|---|---|
| Study Period | 2020-2034 |
| Base Year | 2025 |
| Estimated Year | 2026 |
| Forecast Period | 2026-2034 |
| Historical Period | 2020-2025 |
| Growth Rate | CAGR of 7.87% from 2020-2034 |
| Segmentation |
|
Table of Contents
- 1. Introduction
- 1.1. Research Scope
- 1.2. Market Segmentation
- 1.3. Research Objective
- 1.4. Definitions and Assumptions
- 2. Executive Summary
- 2.1. Market Snapshot
- 3. Market Dynamics
- 3.1. Market Drivers
- 3.2. Market Restrains
- 3.3. Market Trends
- 3.4. Market Opportunities
- 4. Market Factor Analysis
- 4.1. Porters Five Forces
- 4.1.1. Bargaining Power of Suppliers
- 4.1.2. Bargaining Power of Buyers
- 4.1.3. Threat of New Entrants
- 4.1.4. Threat of Substitutes
- 4.1.5. Competitive Rivalry
- 4.2. PESTEL analysis
- 4.3. BCG Analysis
- 4.3.1. Stars (High Growth, High Market Share)
- 4.3.2. Cash Cows (Low Growth, High Market Share)
- 4.3.3. Question Mark (High Growth, Low Market Share)
- 4.3.4. Dogs (Low Growth, Low Market Share)
- 4.4. Ansoff Matrix Analysis
- 4.5. Supply Chain Analysis
- 4.6. Regulatory Landscape
- 4.7. Current Market Potential and Opportunity Assessment (TAM–SAM–SOM Framework)
- 4.8. IMR Analyst Note
- 4.1. Porters Five Forces
- 5. Market Analysis, Insights and Forecast 2021-2033
- 5.1. Market Analysis, Insights and Forecast - by B2C ecommerce
- 5.1.1. Market size (GMV) for the period of 2017-2027
- 5.1.2. Market Segmentation - by Application
- 5.1.2.1. Beauty and Personal Care
- 5.1.2.2. Consumer Electronics
- 5.1.2.3. Fashion and Apparel
- 5.1.2.4. Food and Beverage
- 5.1.2.5. Furniture and Home
- 5.1.2.6. Others (Toys, DIY, Media, etc.)
- 5.2. Market Analysis, Insights and Forecast - by Market size (GMV) for the period of 2017-2027
- 5.3. Market Analysis, Insights and Forecast - by Application
- 5.3.1. Beauty and Personal Care
- 5.3.2. Consumer Electronics
- 5.3.3. Fashion and Apparel
- 5.3.4. Food and Beverage
- 5.3.5. Furniture and Home
- 5.3.6. Others (Toys, DIY, Media, etc.)
- 5.4. Market Analysis, Insights and Forecast - by Beauty and Personal Care
- 5.5. Market Analysis, Insights and Forecast - by Consumer Electronics
- 5.6. Market Analysis, Insights and Forecast - by Fashion and Apparel
- 5.7. Market Analysis, Insights and Forecast - by Food and Beverage
- 5.8. Market Analysis, Insights and Forecast - by Furniture and Home
- 5.9. Market Analysis, Insights and Forecast - by Others (Toys, DIY, Media, etc.)
- 5.10. Market Analysis, Insights and Forecast - by B2B ecommerce
- 5.10.1. Market size for the period of 2017-2027
- 5.11. Market Analysis, Insights and Forecast - by Region
- 5.11.1. North America
- 5.11.2. South America
- 5.11.3. Europe
- 5.11.4. Middle East & Africa
- 5.11.5. Asia Pacific
- 5.1. Market Analysis, Insights and Forecast - by B2C ecommerce
- 6. Global Hong Kong E-commerce Industry Analysis, Insights and Forecast, 2021-2033
- 6.1. Market Analysis, Insights and Forecast - by B2C ecommerce
- 6.1.1. Market size (GMV) for the period of 2017-2027
- 6.1.2. Market Segmentation - by Application
- 6.1.2.1. Beauty and Personal Care
- 6.1.2.2. Consumer Electronics
- 6.1.2.3. Fashion and Apparel
- 6.1.2.4. Food and Beverage
- 6.1.2.5. Furniture and Home
- 6.1.2.6. Others (Toys, DIY, Media, etc.)
- 6.2. Market Analysis, Insights and Forecast - by Market size (GMV) for the period of 2017-2027
- 6.3. Market Analysis, Insights and Forecast - by Application
- 6.3.1. Beauty and Personal Care
- 6.3.2. Consumer Electronics
- 6.3.3. Fashion and Apparel
- 6.3.4. Food and Beverage
- 6.3.5. Furniture and Home
- 6.3.6. Others (Toys, DIY, Media, etc.)
- 6.4. Market Analysis, Insights and Forecast - by Beauty and Personal Care
- 6.5. Market Analysis, Insights and Forecast - by Consumer Electronics
- 6.6. Market Analysis, Insights and Forecast - by Fashion and Apparel
- 6.7. Market Analysis, Insights and Forecast - by Food and Beverage
- 6.8. Market Analysis, Insights and Forecast - by Furniture and Home
- 6.9. Market Analysis, Insights and Forecast - by Others (Toys, DIY, Media, etc.)
- 6.10. Market Analysis, Insights and Forecast - by B2B ecommerce
- 6.10.1. Market size for the period of 2017-2027
- 6.1. Market Analysis, Insights and Forecast - by B2C ecommerce
- 7. North America Hong Kong E-commerce Industry Analysis, Insights and Forecast, 2020-2032
- 7.1. Market Analysis, Insights and Forecast - by B2C ecommerce
- 7.1.1. Market size (GMV) for the period of 2017-2027
- 7.1.2. Market Segmentation - by Application
- 7.1.2.1. Beauty and Personal Care
- 7.1.2.2. Consumer Electronics
- 7.1.2.3. Fashion and Apparel
- 7.1.2.4. Food and Beverage
- 7.1.2.5. Furniture and Home
- 7.1.2.6. Others (Toys, DIY, Media, etc.)
- 7.2. Market Analysis, Insights and Forecast - by Market size (GMV) for the period of 2017-2027
- 7.3. Market Analysis, Insights and Forecast - by Application
- 7.3.1. Beauty and Personal Care
- 7.3.2. Consumer Electronics
- 7.3.3. Fashion and Apparel
- 7.3.4. Food and Beverage
- 7.3.5. Furniture and Home
- 7.3.6. Others (Toys, DIY, Media, etc.)
- 7.4. Market Analysis, Insights and Forecast - by Beauty and Personal Care
- 7.5. Market Analysis, Insights and Forecast - by Consumer Electronics
- 7.6. Market Analysis, Insights and Forecast - by Fashion and Apparel
- 7.7. Market Analysis, Insights and Forecast - by Food and Beverage
- 7.8. Market Analysis, Insights and Forecast - by Furniture and Home
- 7.9. Market Analysis, Insights and Forecast - by Others (Toys, DIY, Media, etc.)
- 7.10. Market Analysis, Insights and Forecast - by B2B ecommerce
- 7.10.1. Market size for the period of 2017-2027
- 7.1. Market Analysis, Insights and Forecast - by B2C ecommerce
- 8. South America Hong Kong E-commerce Industry Analysis, Insights and Forecast, 2020-2032
- 8.1. Market Analysis, Insights and Forecast - by B2C ecommerce
- 8.1.1. Market size (GMV) for the period of 2017-2027
- 8.1.2. Market Segmentation - by Application
- 8.1.2.1. Beauty and Personal Care
- 8.1.2.2. Consumer Electronics
- 8.1.2.3. Fashion and Apparel
- 8.1.2.4. Food and Beverage
- 8.1.2.5. Furniture and Home
- 8.1.2.6. Others (Toys, DIY, Media, etc.)
- 8.2. Market Analysis, Insights and Forecast - by Market size (GMV) for the period of 2017-2027
- 8.3. Market Analysis, Insights and Forecast - by Application
- 8.3.1. Beauty and Personal Care
- 8.3.2. Consumer Electronics
- 8.3.3. Fashion and Apparel
- 8.3.4. Food and Beverage
- 8.3.5. Furniture and Home
- 8.3.6. Others (Toys, DIY, Media, etc.)
- 8.4. Market Analysis, Insights and Forecast - by Beauty and Personal Care
- 8.5. Market Analysis, Insights and Forecast - by Consumer Electronics
- 8.6. Market Analysis, Insights and Forecast - by Fashion and Apparel
- 8.7. Market Analysis, Insights and Forecast - by Food and Beverage
- 8.8. Market Analysis, Insights and Forecast - by Furniture and Home
- 8.9. Market Analysis, Insights and Forecast - by Others (Toys, DIY, Media, etc.)
- 8.10. Market Analysis, Insights and Forecast - by B2B ecommerce
- 8.10.1. Market size for the period of 2017-2027
- 8.1. Market Analysis, Insights and Forecast - by B2C ecommerce
- 9. Europe Hong Kong E-commerce Industry Analysis, Insights and Forecast, 2020-2032
- 9.1. Market Analysis, Insights and Forecast - by B2C ecommerce
- 9.1.1. Market size (GMV) for the period of 2017-2027
- 9.1.2. Market Segmentation - by Application
- 9.1.2.1. Beauty and Personal Care
- 9.1.2.2. Consumer Electronics
- 9.1.2.3. Fashion and Apparel
- 9.1.2.4. Food and Beverage
- 9.1.2.5. Furniture and Home
- 9.1.2.6. Others (Toys, DIY, Media, etc.)
- 9.2. Market Analysis, Insights and Forecast - by Market size (GMV) for the period of 2017-2027
- 9.3. Market Analysis, Insights and Forecast - by Application
- 9.3.1. Beauty and Personal Care
- 9.3.2. Consumer Electronics
- 9.3.3. Fashion and Apparel
- 9.3.4. Food and Beverage
- 9.3.5. Furniture and Home
- 9.3.6. Others (Toys, DIY, Media, etc.)
- 9.4. Market Analysis, Insights and Forecast - by Beauty and Personal Care
- 9.5. Market Analysis, Insights and Forecast - by Consumer Electronics
- 9.6. Market Analysis, Insights and Forecast - by Fashion and Apparel
- 9.7. Market Analysis, Insights and Forecast - by Food and Beverage
- 9.8. Market Analysis, Insights and Forecast - by Furniture and Home
- 9.9. Market Analysis, Insights and Forecast - by Others (Toys, DIY, Media, etc.)
- 9.10. Market Analysis, Insights and Forecast - by B2B ecommerce
- 9.10.1. Market size for the period of 2017-2027
- 9.1. Market Analysis, Insights and Forecast - by B2C ecommerce
- 10. Middle East & Africa Hong Kong E-commerce Industry Analysis, Insights and Forecast, 2020-2032
- 10.1. Market Analysis, Insights and Forecast - by B2C ecommerce
- 10.1.1. Market size (GMV) for the period of 2017-2027
- 10.1.2. Market Segmentation - by Application
- 10.1.2.1. Beauty and Personal Care
- 10.1.2.2. Consumer Electronics
- 10.1.2.3. Fashion and Apparel
- 10.1.2.4. Food and Beverage
- 10.1.2.5. Furniture and Home
- 10.1.2.6. Others (Toys, DIY, Media, etc.)
- 10.2. Market Analysis, Insights and Forecast - by Market size (GMV) for the period of 2017-2027
- 10.3. Market Analysis, Insights and Forecast - by Application
- 10.3.1. Beauty and Personal Care
- 10.3.2. Consumer Electronics
- 10.3.3. Fashion and Apparel
- 10.3.4. Food and Beverage
- 10.3.5. Furniture and Home
- 10.3.6. Others (Toys, DIY, Media, etc.)
- 10.4. Market Analysis, Insights and Forecast - by Beauty and Personal Care
- 10.5. Market Analysis, Insights and Forecast - by Consumer Electronics
- 10.6. Market Analysis, Insights and Forecast - by Fashion and Apparel
- 10.7. Market Analysis, Insights and Forecast - by Food and Beverage
- 10.8. Market Analysis, Insights and Forecast - by Furniture and Home
- 10.9. Market Analysis, Insights and Forecast - by Others (Toys, DIY, Media, etc.)
- 10.10. Market Analysis, Insights and Forecast - by B2B ecommerce
- 10.10.1. Market size for the period of 2017-2027
- 10.1. Market Analysis, Insights and Forecast - by B2C ecommerce
- 11. Asia Pacific Hong Kong E-commerce Industry Analysis, Insights and Forecast, 2020-2032
- 11.1. Market Analysis, Insights and Forecast - by B2C ecommerce
- 11.1.1. Market size (GMV) for the period of 2017-2027
- 11.1.2. Market Segmentation - by Application
- 11.1.2.1. Beauty and Personal Care
- 11.1.2.2. Consumer Electronics
- 11.1.2.3. Fashion and Apparel
- 11.1.2.4. Food and Beverage
- 11.1.2.5. Furniture and Home
- 11.1.2.6. Others (Toys, DIY, Media, etc.)
- 11.2. Market Analysis, Insights and Forecast - by Market size (GMV) for the period of 2017-2027
- 11.3. Market Analysis, Insights and Forecast - by Application
- 11.3.1. Beauty and Personal Care
- 11.3.2. Consumer Electronics
- 11.3.3. Fashion and Apparel
- 11.3.4. Food and Beverage
- 11.3.5. Furniture and Home
- 11.3.6. Others (Toys, DIY, Media, etc.)
- 11.4. Market Analysis, Insights and Forecast - by Beauty and Personal Care
- 11.5. Market Analysis, Insights and Forecast - by Consumer Electronics
- 11.6. Market Analysis, Insights and Forecast - by Fashion and Apparel
- 11.7. Market Analysis, Insights and Forecast - by Food and Beverage
- 11.8. Market Analysis, Insights and Forecast - by Furniture and Home
- 11.9. Market Analysis, Insights and Forecast - by Others (Toys, DIY, Media, etc.)
- 11.10. Market Analysis, Insights and Forecast - by B2B ecommerce
- 11.10.1. Market size for the period of 2017-2027
- 11.1. Market Analysis, Insights and Forecast - by B2C ecommerce
- 12. Competitive Analysis
- 12.1. Company Profiles
- 12.1.1 JD com Inc
- 12.1.1.1. Company Overview
- 12.1.1.2. Products
- 12.1.1.3. Company Financials
- 12.1.1.4. SWOT Analysis
- 12.1.2 PARKnSHOP (HK) Limited
- 12.1.2.1. Company Overview
- 12.1.2.2. Products
- 12.1.2.3. Company Financials
- 12.1.2.4. SWOT Analysis
- 12.1.3 Carousell Group*List Not Exhaustive
- 12.1.3.1. Company Overview
- 12.1.3.2. Products
- 12.1.3.3. Company Financials
- 12.1.3.4. SWOT Analysis
- 12.1.4 MUJI (Hong Kong) Co Ltd
- 12.1.4.1. Company Overview
- 12.1.4.2. Products
- 12.1.4.3. Company Financials
- 12.1.4.4. SWOT Analysis
- 12.1.5 Price Guide Sdn Bhd
- 12.1.5.1. Company Overview
- 12.1.5.2. Products
- 12.1.5.3. Company Financials
- 12.1.5.4. SWOT Analysis
- 12.1.6 Amazon com Inc
- 12.1.6.1. Company Overview
- 12.1.6.2. Products
- 12.1.6.3. Company Financials
- 12.1.6.4. SWOT Analysis
- 12.1.7 Alibaba Group
- 12.1.7.1. Company Overview
- 12.1.7.2. Products
- 12.1.7.3. Company Financials
- 12.1.7.4. SWOT Analysis
- 12.1.8 Hong Kong TV Shopping Network Limited
- 12.1.8.1. Company Overview
- 12.1.8.2. Products
- 12.1.8.3. Company Financials
- 12.1.8.4. SWOT Analysis
- 12.1.9 eBay Inc
- 12.1.9.1. Company Overview
- 12.1.9.2. Products
- 12.1.9.3. Company Financials
- 12.1.9.4. SWOT Analysis
- 12.1.10 WeChat Pay Hong Kong Limited
- 12.1.10.1. Company Overview
- 12.1.10.2. Products
- 12.1.10.3. Company Financials
- 12.1.10.4. SWOT Analysis
- 12.1.1 JD com Inc
- 12.2. Market Entropy
- 12.2.1 Company's Key Areas Served
- 12.2.2 Recent Developments
- 12.3. Company Market Share Analysis 2025
- 12.3.1 Top 5 Companies Market Share Analysis
- 12.3.2 Top 3 Companies Market Share Analysis
- 12.4. List of Potential Customers
- 13. Research Methodology
List of Figures
- Figure 1: Global Hong Kong E-commerce Industry Revenue Breakdown (billion, %) by Region 2025 & 2033
- Figure 2: North America Hong Kong E-commerce Industry Revenue (billion), by B2C ecommerce 2025 & 2033
- Figure 3: North America Hong Kong E-commerce Industry Revenue Share (%), by B2C ecommerce 2025 & 2033
- Figure 4: North America Hong Kong E-commerce Industry Revenue (billion), by Market size (GMV) for the period of 2017-2027 2025 & 2033
- Figure 5: North America Hong Kong E-commerce Industry Revenue Share (%), by Market size (GMV) for the period of 2017-2027 2025 & 2033
- Figure 6: North America Hong Kong E-commerce Industry Revenue (billion), by Application 2025 & 2033
- Figure 7: North America Hong Kong E-commerce Industry Revenue Share (%), by Application 2025 & 2033
- Figure 8: North America Hong Kong E-commerce Industry Revenue (billion), by Beauty and Personal Care 2025 & 2033
- Figure 9: North America Hong Kong E-commerce Industry Revenue Share (%), by Beauty and Personal Care 2025 & 2033
- Figure 10: North America Hong Kong E-commerce Industry Revenue (billion), by Consumer Electronics 2025 & 2033
- Figure 11: North America Hong Kong E-commerce Industry Revenue Share (%), by Consumer Electronics 2025 & 2033
- Figure 12: North America Hong Kong E-commerce Industry Revenue (billion), by Fashion and Apparel 2025 & 2033
- Figure 13: North America Hong Kong E-commerce Industry Revenue Share (%), by Fashion and Apparel 2025 & 2033
- Figure 14: North America Hong Kong E-commerce Industry Revenue (billion), by Food and Beverage 2025 & 2033
- Figure 15: North America Hong Kong E-commerce Industry Revenue Share (%), by Food and Beverage 2025 & 2033
- Figure 16: North America Hong Kong E-commerce Industry Revenue (billion), by Furniture and Home 2025 & 2033
- Figure 17: North America Hong Kong E-commerce Industry Revenue Share (%), by Furniture and Home 2025 & 2033
- Figure 18: North America Hong Kong E-commerce Industry Revenue (billion), by Others (Toys, DIY, Media, etc.) 2025 & 2033
- Figure 19: North America Hong Kong E-commerce Industry Revenue Share (%), by Others (Toys, DIY, Media, etc.) 2025 & 2033
- Figure 20: North America Hong Kong E-commerce Industry Revenue (billion), by B2B ecommerce 2025 & 2033
- Figure 21: North America Hong Kong E-commerce Industry Revenue Share (%), by B2B ecommerce 2025 & 2033
- Figure 22: North America Hong Kong E-commerce Industry Revenue (billion), by Country 2025 & 2033
- Figure 23: North America Hong Kong E-commerce Industry Revenue Share (%), by Country 2025 & 2033
- Figure 24: South America Hong Kong E-commerce Industry Revenue (billion), by B2C ecommerce 2025 & 2033
- Figure 25: South America Hong Kong E-commerce Industry Revenue Share (%), by B2C ecommerce 2025 & 2033
- Figure 26: South America Hong Kong E-commerce Industry Revenue (billion), by Market size (GMV) for the period of 2017-2027 2025 & 2033
- Figure 27: South America Hong Kong E-commerce Industry Revenue Share (%), by Market size (GMV) for the period of 2017-2027 2025 & 2033
- Figure 28: South America Hong Kong E-commerce Industry Revenue (billion), by Application 2025 & 2033
- Figure 29: South America Hong Kong E-commerce Industry Revenue Share (%), by Application 2025 & 2033
- Figure 30: South America Hong Kong E-commerce Industry Revenue (billion), by Beauty and Personal Care 2025 & 2033
- Figure 31: South America Hong Kong E-commerce Industry Revenue Share (%), by Beauty and Personal Care 2025 & 2033
- Figure 32: South America Hong Kong E-commerce Industry Revenue (billion), by Consumer Electronics 2025 & 2033
- Figure 33: South America Hong Kong E-commerce Industry Revenue Share (%), by Consumer Electronics 2025 & 2033
- Figure 34: South America Hong Kong E-commerce Industry Revenue (billion), by Fashion and Apparel 2025 & 2033
- Figure 35: South America Hong Kong E-commerce Industry Revenue Share (%), by Fashion and Apparel 2025 & 2033
- Figure 36: South America Hong Kong E-commerce Industry Revenue (billion), by Food and Beverage 2025 & 2033
- Figure 37: South America Hong Kong E-commerce Industry Revenue Share (%), by Food and Beverage 2025 & 2033
- Figure 38: South America Hong Kong E-commerce Industry Revenue (billion), by Furniture and Home 2025 & 2033
- Figure 39: South America Hong Kong E-commerce Industry Revenue Share (%), by Furniture and Home 2025 & 2033
- Figure 40: South America Hong Kong E-commerce Industry Revenue (billion), by Others (Toys, DIY, Media, etc.) 2025 & 2033
- Figure 41: South America Hong Kong E-commerce Industry Revenue Share (%), by Others (Toys, DIY, Media, etc.) 2025 & 2033
- Figure 42: South America Hong Kong E-commerce Industry Revenue (billion), by B2B ecommerce 2025 & 2033
- Figure 43: South America Hong Kong E-commerce Industry Revenue Share (%), by B2B ecommerce 2025 & 2033
- Figure 44: South America Hong Kong E-commerce Industry Revenue (billion), by Country 2025 & 2033
- Figure 45: South America Hong Kong E-commerce Industry Revenue Share (%), by Country 2025 & 2033
- Figure 46: Europe Hong Kong E-commerce Industry Revenue (billion), by B2C ecommerce 2025 & 2033
- Figure 47: Europe Hong Kong E-commerce Industry Revenue Share (%), by B2C ecommerce 2025 & 2033
- Figure 48: Europe Hong Kong E-commerce Industry Revenue (billion), by Market size (GMV) for the period of 2017-2027 2025 & 2033
- Figure 49: Europe Hong Kong E-commerce Industry Revenue Share (%), by Market size (GMV) for the period of 2017-2027 2025 & 2033
- Figure 50: Europe Hong Kong E-commerce Industry Revenue (billion), by Application 2025 & 2033
- Figure 51: Europe Hong Kong E-commerce Industry Revenue Share (%), by Application 2025 & 2033
- Figure 52: Europe Hong Kong E-commerce Industry Revenue (billion), by Beauty and Personal Care 2025 & 2033
- Figure 53: Europe Hong Kong E-commerce Industry Revenue Share (%), by Beauty and Personal Care 2025 & 2033
- Figure 54: Europe Hong Kong E-commerce Industry Revenue (billion), by Consumer Electronics 2025 & 2033
- Figure 55: Europe Hong Kong E-commerce Industry Revenue Share (%), by Consumer Electronics 2025 & 2033
- Figure 56: Europe Hong Kong E-commerce Industry Revenue (billion), by Fashion and Apparel 2025 & 2033
- Figure 57: Europe Hong Kong E-commerce Industry Revenue Share (%), by Fashion and Apparel 2025 & 2033
- Figure 58: Europe Hong Kong E-commerce Industry Revenue (billion), by Food and Beverage 2025 & 2033
- Figure 59: Europe Hong Kong E-commerce Industry Revenue Share (%), by Food and Beverage 2025 & 2033
- Figure 60: Europe Hong Kong E-commerce Industry Revenue (billion), by Furniture and Home 2025 & 2033
- Figure 61: Europe Hong Kong E-commerce Industry Revenue Share (%), by Furniture and Home 2025 & 2033
- Figure 62: Europe Hong Kong E-commerce Industry Revenue (billion), by Others (Toys, DIY, Media, etc.) 2025 & 2033
- Figure 63: Europe Hong Kong E-commerce Industry Revenue Share (%), by Others (Toys, DIY, Media, etc.) 2025 & 2033
- Figure 64: Europe Hong Kong E-commerce Industry Revenue (billion), by B2B ecommerce 2025 & 2033
- Figure 65: Europe Hong Kong E-commerce Industry Revenue Share (%), by B2B ecommerce 2025 & 2033
- Figure 66: Europe Hong Kong E-commerce Industry Revenue (billion), by Country 2025 & 2033
- Figure 67: Europe Hong Kong E-commerce Industry Revenue Share (%), by Country 2025 & 2033
- Figure 68: Middle East & Africa Hong Kong E-commerce Industry Revenue (billion), by B2C ecommerce 2025 & 2033
- Figure 69: Middle East & Africa Hong Kong E-commerce Industry Revenue Share (%), by B2C ecommerce 2025 & 2033
- Figure 70: Middle East & Africa Hong Kong E-commerce Industry Revenue (billion), by Market size (GMV) for the period of 2017-2027 2025 & 2033
- Figure 71: Middle East & Africa Hong Kong E-commerce Industry Revenue Share (%), by Market size (GMV) for the period of 2017-2027 2025 & 2033
- Figure 72: Middle East & Africa Hong Kong E-commerce Industry Revenue (billion), by Application 2025 & 2033
- Figure 73: Middle East & Africa Hong Kong E-commerce Industry Revenue Share (%), by Application 2025 & 2033
- Figure 74: Middle East & Africa Hong Kong E-commerce Industry Revenue (billion), by Beauty and Personal Care 2025 & 2033
- Figure 75: Middle East & Africa Hong Kong E-commerce Industry Revenue Share (%), by Beauty and Personal Care 2025 & 2033
- Figure 76: Middle East & Africa Hong Kong E-commerce Industry Revenue (billion), by Consumer Electronics 2025 & 2033
- Figure 77: Middle East & Africa Hong Kong E-commerce Industry Revenue Share (%), by Consumer Electronics 2025 & 2033
- Figure 78: Middle East & Africa Hong Kong E-commerce Industry Revenue (billion), by Fashion and Apparel 2025 & 2033
- Figure 79: Middle East & Africa Hong Kong E-commerce Industry Revenue Share (%), by Fashion and Apparel 2025 & 2033
- Figure 80: Middle East & Africa Hong Kong E-commerce Industry Revenue (billion), by Food and Beverage 2025 & 2033
- Figure 81: Middle East & Africa Hong Kong E-commerce Industry Revenue Share (%), by Food and Beverage 2025 & 2033
- Figure 82: Middle East & Africa Hong Kong E-commerce Industry Revenue (billion), by Furniture and Home 2025 & 2033
- Figure 83: Middle East & Africa Hong Kong E-commerce Industry Revenue Share (%), by Furniture and Home 2025 & 2033
- Figure 84: Middle East & Africa Hong Kong E-commerce Industry Revenue (billion), by Others (Toys, DIY, Media, etc.) 2025 & 2033
- Figure 85: Middle East & Africa Hong Kong E-commerce Industry Revenue Share (%), by Others (Toys, DIY, Media, etc.) 2025 & 2033
- Figure 86: Middle East & Africa Hong Kong E-commerce Industry Revenue (billion), by B2B ecommerce 2025 & 2033
- Figure 87: Middle East & Africa Hong Kong E-commerce Industry Revenue Share (%), by B2B ecommerce 2025 & 2033
- Figure 88: Middle East & Africa Hong Kong E-commerce Industry Revenue (billion), by Country 2025 & 2033
- Figure 89: Middle East & Africa Hong Kong E-commerce Industry Revenue Share (%), by Country 2025 & 2033
- Figure 90: Asia Pacific Hong Kong E-commerce Industry Revenue (billion), by B2C ecommerce 2025 & 2033
- Figure 91: Asia Pacific Hong Kong E-commerce Industry Revenue Share (%), by B2C ecommerce 2025 & 2033
- Figure 92: Asia Pacific Hong Kong E-commerce Industry Revenue (billion), by Market size (GMV) for the period of 2017-2027 2025 & 2033
- Figure 93: Asia Pacific Hong Kong E-commerce Industry Revenue Share (%), by Market size (GMV) for the period of 2017-2027 2025 & 2033
- Figure 94: Asia Pacific Hong Kong E-commerce Industry Revenue (billion), by Application 2025 & 2033
- Figure 95: Asia Pacific Hong Kong E-commerce Industry Revenue Share (%), by Application 2025 & 2033
- Figure 96: Asia Pacific Hong Kong E-commerce Industry Revenue (billion), by Beauty and Personal Care 2025 & 2033
- Figure 97: Asia Pacific Hong Kong E-commerce Industry Revenue Share (%), by Beauty and Personal Care 2025 & 2033
- Figure 98: Asia Pacific Hong Kong E-commerce Industry Revenue (billion), by Consumer Electronics 2025 & 2033
- Figure 99: Asia Pacific Hong Kong E-commerce Industry Revenue Share (%), by Consumer Electronics 2025 & 2033
- Figure 100: Asia Pacific Hong Kong E-commerce Industry Revenue (billion), by Fashion and Apparel 2025 & 2033
- Figure 101: Asia Pacific Hong Kong E-commerce Industry Revenue Share (%), by Fashion and Apparel 2025 & 2033
- Figure 102: Asia Pacific Hong Kong E-commerce Industry Revenue (billion), by Food and Beverage 2025 & 2033
- Figure 103: Asia Pacific Hong Kong E-commerce Industry Revenue Share (%), by Food and Beverage 2025 & 2033
- Figure 104: Asia Pacific Hong Kong E-commerce Industry Revenue (billion), by Furniture and Home 2025 & 2033
- Figure 105: Asia Pacific Hong Kong E-commerce Industry Revenue Share (%), by Furniture and Home 2025 & 2033
- Figure 106: Asia Pacific Hong Kong E-commerce Industry Revenue (billion), by Others (Toys, DIY, Media, etc.) 2025 & 2033
- Figure 107: Asia Pacific Hong Kong E-commerce Industry Revenue Share (%), by Others (Toys, DIY, Media, etc.) 2025 & 2033
- Figure 108: Asia Pacific Hong Kong E-commerce Industry Revenue (billion), by B2B ecommerce 2025 & 2033
- Figure 109: Asia Pacific Hong Kong E-commerce Industry Revenue Share (%), by B2B ecommerce 2025 & 2033
- Figure 110: Asia Pacific Hong Kong E-commerce Industry Revenue (billion), by Country 2025 & 2033
- Figure 111: Asia Pacific Hong Kong E-commerce Industry Revenue Share (%), by Country 2025 & 2033
List of Tables
- Table 1: Global Hong Kong E-commerce Industry Revenue billion Forecast, by B2C ecommerce 2020 & 2033
- Table 2: Global Hong Kong E-commerce Industry Revenue billion Forecast, by Market size (GMV) for the period of 2017-2027 2020 & 2033
- Table 3: Global Hong Kong E-commerce Industry Revenue billion Forecast, by Application 2020 & 2033
- Table 4: Global Hong Kong E-commerce Industry Revenue billion Forecast, by Beauty and Personal Care 2020 & 2033
- Table 5: Global Hong Kong E-commerce Industry Revenue billion Forecast, by Consumer Electronics 2020 & 2033
- Table 6: Global Hong Kong E-commerce Industry Revenue billion Forecast, by Fashion and Apparel 2020 & 2033
- Table 7: Global Hong Kong E-commerce Industry Revenue billion Forecast, by Food and Beverage 2020 & 2033
- Table 8: Global Hong Kong E-commerce Industry Revenue billion Forecast, by Furniture and Home 2020 & 2033
- Table 9: Global Hong Kong E-commerce Industry Revenue billion Forecast, by Others (Toys, DIY, Media, etc.) 2020 & 2033
- Table 10: Global Hong Kong E-commerce Industry Revenue billion Forecast, by B2B ecommerce 2020 & 2033
- Table 11: Global Hong Kong E-commerce Industry Revenue billion Forecast, by Region 2020 & 2033
- Table 12: Global Hong Kong E-commerce Industry Revenue billion Forecast, by B2C ecommerce 2020 & 2033
- Table 13: Global Hong Kong E-commerce Industry Revenue billion Forecast, by Market size (GMV) for the period of 2017-2027 2020 & 2033
- Table 14: Global Hong Kong E-commerce Industry Revenue billion Forecast, by Application 2020 & 2033
- Table 15: Global Hong Kong E-commerce Industry Revenue billion Forecast, by Beauty and Personal Care 2020 & 2033
- Table 16: Global Hong Kong E-commerce Industry Revenue billion Forecast, by Consumer Electronics 2020 & 2033
- Table 17: Global Hong Kong E-commerce Industry Revenue billion Forecast, by Fashion and Apparel 2020 & 2033
- Table 18: Global Hong Kong E-commerce Industry Revenue billion Forecast, by Food and Beverage 2020 & 2033
- Table 19: Global Hong Kong E-commerce Industry Revenue billion Forecast, by Furniture and Home 2020 & 2033
- Table 20: Global Hong Kong E-commerce Industry Revenue billion Forecast, by Others (Toys, DIY, Media, etc.) 2020 & 2033
- Table 21: Global Hong Kong E-commerce Industry Revenue billion Forecast, by B2B ecommerce 2020 & 2033
- Table 22: Global Hong Kong E-commerce Industry Revenue billion Forecast, by Country 2020 & 2033
- Table 23: United States Hong Kong E-commerce Industry Revenue (billion) Forecast, by Application 2020 & 2033
- Table 24: Canada Hong Kong E-commerce Industry Revenue (billion) Forecast, by Application 2020 & 2033
- Table 25: Mexico Hong Kong E-commerce Industry Revenue (billion) Forecast, by Application 2020 & 2033
- Table 26: Global Hong Kong E-commerce Industry Revenue billion Forecast, by B2C ecommerce 2020 & 2033
- Table 27: Global Hong Kong E-commerce Industry Revenue billion Forecast, by Market size (GMV) for the period of 2017-2027 2020 & 2033
- Table 28: Global Hong Kong E-commerce Industry Revenue billion Forecast, by Application 2020 & 2033
- Table 29: Global Hong Kong E-commerce Industry Revenue billion Forecast, by Beauty and Personal Care 2020 & 2033
- Table 30: Global Hong Kong E-commerce Industry Revenue billion Forecast, by Consumer Electronics 2020 & 2033
- Table 31: Global Hong Kong E-commerce Industry Revenue billion Forecast, by Fashion and Apparel 2020 & 2033
- Table 32: Global Hong Kong E-commerce Industry Revenue billion Forecast, by Food and Beverage 2020 & 2033
- Table 33: Global Hong Kong E-commerce Industry Revenue billion Forecast, by Furniture and Home 2020 & 2033
- Table 34: Global Hong Kong E-commerce Industry Revenue billion Forecast, by Others (Toys, DIY, Media, etc.) 2020 & 2033
- Table 35: Global Hong Kong E-commerce Industry Revenue billion Forecast, by B2B ecommerce 2020 & 2033
- Table 36: Global Hong Kong E-commerce Industry Revenue billion Forecast, by Country 2020 & 2033
- Table 37: Brazil Hong Kong E-commerce Industry Revenue (billion) Forecast, by Application 2020 & 2033
- Table 38: Argentina Hong Kong E-commerce Industry Revenue (billion) Forecast, by Application 2020 & 2033
- Table 39: Rest of South America Hong Kong E-commerce Industry Revenue (billion) Forecast, by Application 2020 & 2033
- Table 40: Global Hong Kong E-commerce Industry Revenue billion Forecast, by B2C ecommerce 2020 & 2033
- Table 41: Global Hong Kong E-commerce Industry Revenue billion Forecast, by Market size (GMV) for the period of 2017-2027 2020 & 2033
- Table 42: Global Hong Kong E-commerce Industry Revenue billion Forecast, by Application 2020 & 2033
- Table 43: Global Hong Kong E-commerce Industry Revenue billion Forecast, by Beauty and Personal Care 2020 & 2033
- Table 44: Global Hong Kong E-commerce Industry Revenue billion Forecast, by Consumer Electronics 2020 & 2033
- Table 45: Global Hong Kong E-commerce Industry Revenue billion Forecast, by Fashion and Apparel 2020 & 2033
- Table 46: Global Hong Kong E-commerce Industry Revenue billion Forecast, by Food and Beverage 2020 & 2033
- Table 47: Global Hong Kong E-commerce Industry Revenue billion Forecast, by Furniture and Home 2020 & 2033
- Table 48: Global Hong Kong E-commerce Industry Revenue billion Forecast, by Others (Toys, DIY, Media, etc.) 2020 & 2033
- Table 49: Global Hong Kong E-commerce Industry Revenue billion Forecast, by B2B ecommerce 2020 & 2033
- Table 50: Global Hong Kong E-commerce Industry Revenue billion Forecast, by Country 2020 & 2033
- Table 51: United Kingdom Hong Kong E-commerce Industry Revenue (billion) Forecast, by Application 2020 & 2033
- Table 52: Germany Hong Kong E-commerce Industry Revenue (billion) Forecast, by Application 2020 & 2033
- Table 53: France Hong Kong E-commerce Industry Revenue (billion) Forecast, by Application 2020 & 2033
- Table 54: Italy Hong Kong E-commerce Industry Revenue (billion) Forecast, by Application 2020 & 2033
- Table 55: Spain Hong Kong E-commerce Industry Revenue (billion) Forecast, by Application 2020 & 2033
- Table 56: Russia Hong Kong E-commerce Industry Revenue (billion) Forecast, by Application 2020 & 2033
- Table 57: Benelux Hong Kong E-commerce Industry Revenue (billion) Forecast, by Application 2020 & 2033
- Table 58: Nordics Hong Kong E-commerce Industry Revenue (billion) Forecast, by Application 2020 & 2033
- Table 59: Rest of Europe Hong Kong E-commerce Industry Revenue (billion) Forecast, by Application 2020 & 2033
- Table 60: Global Hong Kong E-commerce Industry Revenue billion Forecast, by B2C ecommerce 2020 & 2033
- Table 61: Global Hong Kong E-commerce Industry Revenue billion Forecast, by Market size (GMV) for the period of 2017-2027 2020 & 2033
- Table 62: Global Hong Kong E-commerce Industry Revenue billion Forecast, by Application 2020 & 2033
- Table 63: Global Hong Kong E-commerce Industry Revenue billion Forecast, by Beauty and Personal Care 2020 & 2033
- Table 64: Global Hong Kong E-commerce Industry Revenue billion Forecast, by Consumer Electronics 2020 & 2033
- Table 65: Global Hong Kong E-commerce Industry Revenue billion Forecast, by Fashion and Apparel 2020 & 2033
- Table 66: Global Hong Kong E-commerce Industry Revenue billion Forecast, by Food and Beverage 2020 & 2033
- Table 67: Global Hong Kong E-commerce Industry Revenue billion Forecast, by Furniture and Home 2020 & 2033
- Table 68: Global Hong Kong E-commerce Industry Revenue billion Forecast, by Others (Toys, DIY, Media, etc.) 2020 & 2033
- Table 69: Global Hong Kong E-commerce Industry Revenue billion Forecast, by B2B ecommerce 2020 & 2033
- Table 70: Global Hong Kong E-commerce Industry Revenue billion Forecast, by Country 2020 & 2033
- Table 71: Turkey Hong Kong E-commerce Industry Revenue (billion) Forecast, by Application 2020 & 2033
- Table 72: Israel Hong Kong E-commerce Industry Revenue (billion) Forecast, by Application 2020 & 2033
- Table 73: GCC Hong Kong E-commerce Industry Revenue (billion) Forecast, by Application 2020 & 2033
- Table 74: North Africa Hong Kong E-commerce Industry Revenue (billion) Forecast, by Application 2020 & 2033
- Table 75: South Africa Hong Kong E-commerce Industry Revenue (billion) Forecast, by Application 2020 & 2033
- Table 76: Rest of Middle East & Africa Hong Kong E-commerce Industry Revenue (billion) Forecast, by Application 2020 & 2033
- Table 77: Global Hong Kong E-commerce Industry Revenue billion Forecast, by B2C ecommerce 2020 & 2033
- Table 78: Global Hong Kong E-commerce Industry Revenue billion Forecast, by Market size (GMV) for the period of 2017-2027 2020 & 2033
- Table 79: Global Hong Kong E-commerce Industry Revenue billion Forecast, by Application 2020 & 2033
- Table 80: Global Hong Kong E-commerce Industry Revenue billion Forecast, by Beauty and Personal Care 2020 & 2033
- Table 81: Global Hong Kong E-commerce Industry Revenue billion Forecast, by Consumer Electronics 2020 & 2033
- Table 82: Global Hong Kong E-commerce Industry Revenue billion Forecast, by Fashion and Apparel 2020 & 2033
- Table 83: Global Hong Kong E-commerce Industry Revenue billion Forecast, by Food and Beverage 2020 & 2033
- Table 84: Global Hong Kong E-commerce Industry Revenue billion Forecast, by Furniture and Home 2020 & 2033
- Table 85: Global Hong Kong E-commerce Industry Revenue billion Forecast, by Others (Toys, DIY, Media, etc.) 2020 & 2033
- Table 86: Global Hong Kong E-commerce Industry Revenue billion Forecast, by B2B ecommerce 2020 & 2033
- Table 87: Global Hong Kong E-commerce Industry Revenue billion Forecast, by Country 2020 & 2033
- Table 88: China Hong Kong E-commerce Industry Revenue (billion) Forecast, by Application 2020 & 2033
- Table 89: India Hong Kong E-commerce Industry Revenue (billion) Forecast, by Application 2020 & 2033
- Table 90: Japan Hong Kong E-commerce Industry Revenue (billion) Forecast, by Application 2020 & 2033
- Table 91: South Korea Hong Kong E-commerce Industry Revenue (billion) Forecast, by Application 2020 & 2033
- Table 92: ASEAN Hong Kong E-commerce Industry Revenue (billion) Forecast, by Application 2020 & 2033
- Table 93: Oceania Hong Kong E-commerce Industry Revenue (billion) Forecast, by Application 2020 & 2033
- Table 94: Rest of Asia Pacific Hong Kong E-commerce Industry Revenue (billion) Forecast, by Application 2020 & 2033
Frequently Asked Questions
1. What is the projected Compound Annual Growth Rate (CAGR) of the Hong Kong E-commerce Industry?
The projected CAGR is approximately 7.87%.
2. Which companies are prominent players in the Hong Kong E-commerce Industry?
Key companies in the market include JD com Inc, PARKnSHOP (HK) Limited, Carousell Group*List Not Exhaustive, MUJI (Hong Kong) Co Ltd, Price Guide Sdn Bhd, Amazon com Inc, Alibaba Group, Hong Kong TV Shopping Network Limited, eBay Inc, WeChat Pay Hong Kong Limited.
3. What are the main segments of the Hong Kong E-commerce Industry?
The market segments include B2C ecommerce, Market size (GMV) for the period of 2017-2027, Application, Beauty and Personal Care, Consumer Electronics, Fashion and Apparel, Food and Beverage, Furniture and Home, Others (Toys, DIY, Media, etc.), B2B ecommerce.
4. Can you provide details about the market size?
The market size is estimated to be USD 5.34 billion as of 2022.
5. What are some drivers contributing to market growth?
Increase in adoption of digitalization; Adoption of Omnichannel Innovative Solutions.
6. What are the notable trends driving market growth?
Increase in Internet Penetration Across the Country is Fueling the Growth of the Market.
7. Are there any restraints impacting market growth?
High Initial Cost of Installation.
8. Can you provide examples of recent developments in the market?
May 2022 - YesAsia, a global online retailer, announced a partnership with Geek+, an autonomous robots company, to build YesAsia's first smart warehouse at Goodman Interlink, located in Tsing Yi, Hong Kong.
9. What pricing options are available for accessing the report?
Pricing options include single-user, multi-user, and enterprise licenses priced at USD 3800, USD 4500, and USD 5800 respectively.
10. Is the market size provided in terms of value or volume?
The market size is provided in terms of value, measured in billion.
11. Are there any specific market keywords associated with the report?
Yes, the market keyword associated with the report is "Hong Kong E-commerce Industry," which aids in identifying and referencing the specific market segment covered.
12. How do I determine which pricing option suits my needs best?
The pricing options vary based on user requirements and access needs. Individual users may opt for single-user licenses, while businesses requiring broader access may choose multi-user or enterprise licenses for cost-effective access to the report.
13. Are there any additional resources or data provided in the Hong Kong E-commerce Industry report?
While the report offers comprehensive insights, it's advisable to review the specific contents or supplementary materials provided to ascertain if additional resources or data are available.
14. How can I stay updated on further developments or reports in the Hong Kong E-commerce Industry?
To stay informed about further developments, trends, and reports in the Hong Kong E-commerce Industry, consider subscribing to industry newsletters, following relevant companies and organizations, or regularly checking reputable industry news sources and publications.
Methodology
Step 1 - Identification of Relevant Samples Size from Population Database


Step 2 - Approaches for Defining Global Market Size (Value, Volume* & Price*)

Note*: In applicable scenarios
Step 3 - Data Sources
Primary Research
- Web Analytics
- Survey Reports
- Research Institute
- Latest Research Reports
- Opinion Leaders
Secondary Research
- Annual Reports
- White Paper
- Latest Press Release
- Industry Association
- Paid Database
- Investor Presentations

Step 4 - Data Triangulation
Involves using different sources of information in order to increase the validity of a study
These sources are likely to be stakeholders in a program - participants, other researchers, program staff, other community members, and so on.
Then we put all data in single framework & apply various statistical tools to find out the dynamic on the market.
During the analysis stage, feedback from the stakeholder groups would be compared to determine areas of agreement as well as areas of divergence