

Key Insights
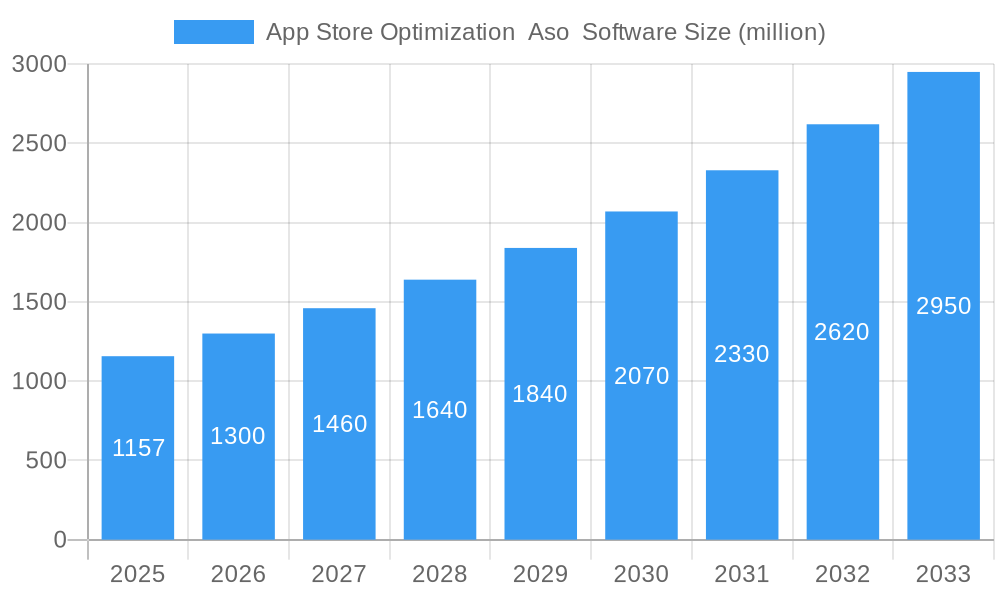
The App Store Optimization (ASO) software market is experiencing robust growth, projected to reach $1157 million in 2025 and maintain a Compound Annual Growth Rate (CAGR) of 12.5% from 2025 to 2033. This expansion is driven by the increasing importance of mobile app discovery and the escalating competition within app stores. Businesses are increasingly recognizing the need for sophisticated ASO strategies to improve app visibility, rankings, and ultimately, downloads. Key drivers include the rising adoption of mobile devices globally, the expanding mobile app economy, and the increasing sophistication of ASO techniques. Furthermore, the market is witnessing a trend toward AI-powered ASO tools, which offer enhanced keyword research, competitor analysis, and performance tracking capabilities. While data on specific restraints is unavailable, potential challenges include the need for ongoing investment in ASO expertise and the ever-evolving algorithms of app stores. The market is segmented by software features (keyword tracking, A/B testing, competitor analysis, etc.), pricing models (subscription-based, one-time purchases), and target app categories (games, productivity, etc.). Leading players like AppFollow, AppTweak, and Sensor Tower are driving innovation and market consolidation through continuous product development and strategic partnerships.
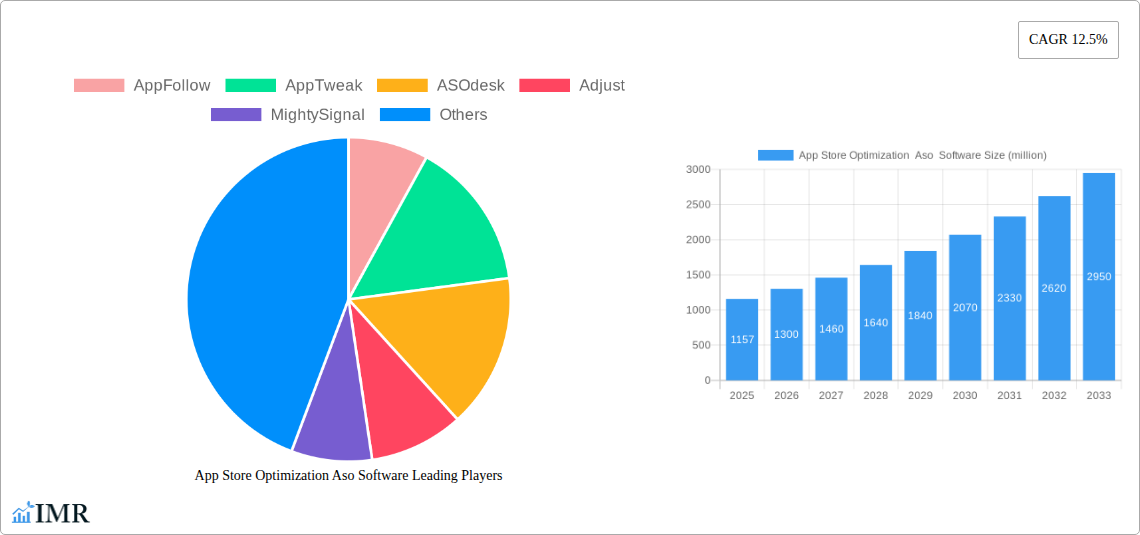
App Store Optimization Aso Software Market Size (In Billion)
The forecast period of 2025-2033 suggests significant opportunities for both established players and emerging startups in the ASO software market. As the mobile app market continues its rapid expansion, the demand for effective ASO tools will only intensify. The market’s competitive landscape is dynamic, encouraging innovation in areas such as AI integration, automation, and data analytics. The future of ASO software is likely to be characterized by more sophisticated, data-driven solutions that enable app developers and publishers to optimize their app store presence and maximize their return on investment (ROI). Continued investment in research and development will be critical for companies to maintain a competitive edge.
App Store Optimization Aso Software Company Market Share
App Store Optimization (ASO) Software Market Report: 2019-2033
This comprehensive report provides a detailed analysis of the App Store Optimization (ASO) software market, covering market dynamics, growth trends, regional dominance, product landscapes, key players, and future outlooks. The study period spans from 2019 to 2033, with 2025 as the base and estimated year, and a forecast period of 2025-2033. This report is invaluable for industry professionals, investors, and businesses seeking to understand and navigate this rapidly evolving market. The market is expected to reach xx million units by 2033.
App Store Optimization ASO Software Market Dynamics & Structure
The ASO software market is characterized by moderate concentration, with a few dominant players and a growing number of smaller, specialized firms. Technological innovation, particularly in AI-powered keyword research and A/B testing, is a key driver. Regulatory frameworks concerning data privacy (like GDPR and CCPA) significantly impact the market, shaping data handling practices and features offered by ASO tools. Competitive substitutes include in-house ASO teams and less sophisticated, free alternatives. The end-user demographic primarily comprises app developers, marketers, and businesses seeking to improve app store rankings and visibility. M&A activity has been relatively low in recent years (xx deals in 2024), but consolidation is anticipated as larger players seek to expand their market share.
- Market Concentration: Moderately concentrated, with the top 5 players holding approximately xx% market share in 2024.
- Technological Innovation: AI-driven keyword research, A/B testing, and performance analytics are driving growth.
- Regulatory Frameworks: GDPR and CCPA influence data handling and transparency requirements.
- Competitive Substitutes: In-house teams and free tools pose competition, particularly to smaller businesses.
- End-User Demographics: App developers, marketers, and businesses of varying sizes.
- M&A Trends: Low activity recently (xx deals in 2024), but potential for increased consolidation.
App Store Optimization ASO Software Growth Trends & Insights
The ASO software market has experienced substantial growth over the past five years (2019-2024), exhibiting a CAGR of xx%. This growth is driven by the increasing importance of app store optimization for app discovery and user acquisition. The market size reached xx million units in 2024 and is projected to reach xx million units by 2033, indicating a strong trajectory. Technological disruptions, such as the rise of AI and machine learning, have revolutionized ASO strategies, leading to more data-driven and efficient approaches. Shifts in consumer behavior, towards more mobile-first lifestyles and app usage, further fuel demand for robust ASO tools. Adoption rates are steadily increasing, particularly among larger app developers and businesses with significant app portfolios. Market penetration remains relatively low (xx% in 2024), suggesting substantial untapped potential.
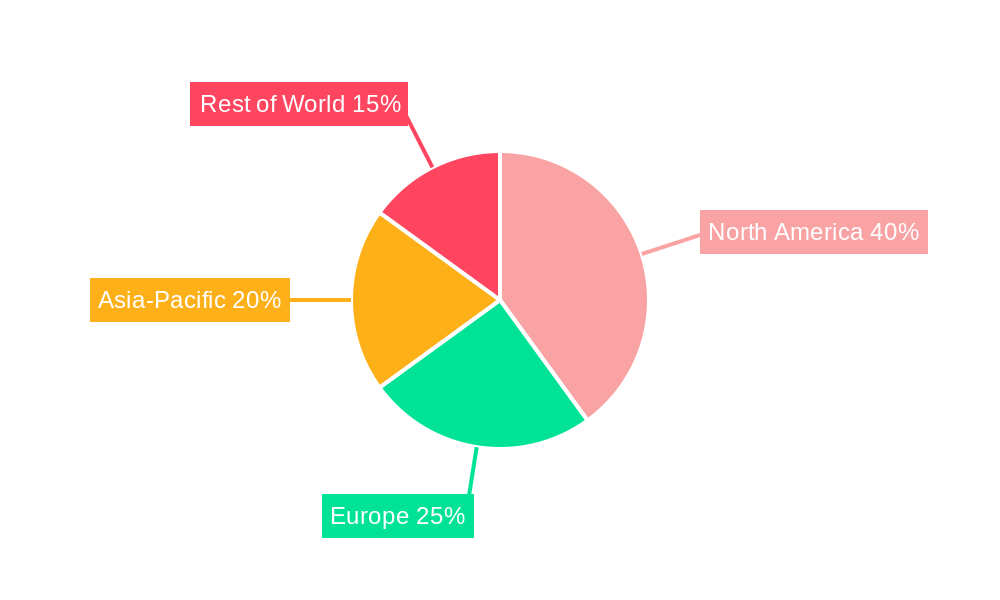
Dominant Regions, Countries, or Segments in App Store Optimization ASO Software
North America currently dominates the ASO software market, accounting for xx% of the global market share in 2024, driven by a high concentration of app developers, significant investments in mobile technology, and a strong entrepreneurial ecosystem. However, regions like Asia-Pacific are exhibiting rapid growth, fueled by a burgeoning app economy and increasing smartphone penetration. Specific countries within North America (like the US) and Asia (like China and India) represent major market segments.
- Key Drivers in North America: Strong app developer base, high mobile technology investment, established tech infrastructure.
- Key Drivers in Asia-Pacific: Rapidly growing app economy, high smartphone penetration, increasing internet access.
- Market Share: North America holds xx% market share (2024), while Asia-Pacific is projected to reach xx% by 2033.
- Growth Potential: Asia-Pacific exhibits the highest growth potential due to its expanding mobile market.
App Store Optimization ASO Software Product Landscape
ASO software solutions range from basic keyword tracking tools to sophisticated platforms incorporating AI-powered analytics, A/B testing capabilities, and competitor analysis features. Many offerings integrate with other marketing tools, enabling seamless workflow and data integration. Unique selling propositions often involve proprietary algorithms, extensive data sets, or specialized features catering to niche markets (e.g., gaming apps). Continuous technological advancements focus on improving accuracy, efficiency, and user experience. The market sees a rise in solutions integrating with app performance tracking and analytics platforms for better decision making.
Key Drivers, Barriers & Challenges in App Store Optimization ASO Software
Key Drivers: The increasing importance of app store visibility, the rise of mobile-first strategies, and the growing complexity of app store algorithms propel market growth. Technological advancements such as AI-powered analytics further accelerate adoption. Government initiatives promoting digital economy and app development in certain regions also contribute positively.
Key Barriers and Challenges: High initial investment costs for sophisticated tools can limit accessibility for smaller developers. The evolving nature of app store algorithms requires constant adaptation and upgrades, incurring continuous costs. Competition from free or basic tools also presents a challenge. Data security and privacy regulations further increase compliance complexities. Supply chain disruptions related to software development and deployment can negatively impact product availability and timelines. These factors could cumulatively affect market growth by approximately xx% by 2033.
Emerging Opportunities in App Store Optimization ASO Software
Untapped markets in emerging economies present significant opportunities. Integration with other marketing platforms and offering comprehensive solutions will increase adoption. Focus on niche market solutions, like those tailored for specific app categories or languages, is promising. Personalized ASO recommendations based on individual app characteristics and target audiences will drive growth. The increasing demand for automation and AI-driven solutions provides further opportunities.
Growth Accelerators in the App Store Optimization Aso Software Industry
Technological breakthroughs in AI and machine learning are key growth catalysts. Strategic partnerships between ASO software providers and other marketing platforms will expand market reach. Market expansion into emerging economies and underserved app categories will drive substantial growth. The adoption of advanced analytics and data-driven decision-making methodologies within the app development community provides further impetus.
Key Players Shaping the App Store Optimization ASO Software Market
- AppFollow
- AppTweak
- ASOdesk
- Adjust
- MightySignal
- App Radar
- Kumulos
- Appfigures
- Sensor Tower
- ASOMobile
- Mobile Action
- TheTool
- Airnow
- SplitMetrics
- SearchMan
- MobileAction
- Gummicube
Notable Milestones in App Store Optimization ASO Software Sector
- 2020, Q3: AppFollow launches its AI-powered keyword research tool.
- 2021, Q1: AppTweak integrates with Google Ads.
- 2022, Q2: Sensor Tower acquires a smaller ASO competitor.
- 2023, Q4: Significant advancements in AI-driven A/B testing capabilities across multiple platforms.
In-Depth App Store Optimization ASO Software Market Outlook
The future of the ASO software market is bright, driven by ongoing technological advancements, increasing app store competition, and the expansion of the mobile app economy globally. Strategic opportunities lie in focusing on AI-powered solutions, expanding into emerging markets, and forging strategic partnerships to offer comprehensive marketing solutions. The market is poised for continued growth, with significant potential for innovation and market consolidation. The market is projected to reach xx million units by 2033, exceeding expectations due to several market trends.
App Store Optimization Aso Software Segmentation
-
1. Application
- 1.1. SMEs
- 1.2. Large Enterprises
-
2. Type
- 2.1. Cloud Based
- 2.2. On-premises
App Store Optimization Aso Software Segmentation By Geography
-
1. North America
- 1.1. United States
- 1.2. Canada
- 1.3. Mexico
-
2. South America
- 2.1. Brazil
- 2.2. Argentina
- 2.3. Rest of South America
-
3. Europe
- 3.1. United Kingdom
- 3.2. Germany
- 3.3. France
- 3.4. Italy
- 3.5. Spain
- 3.6. Russia
- 3.7. Benelux
- 3.8. Nordics
- 3.9. Rest of Europe
-
4. Middle East & Africa
- 4.1. Turkey
- 4.2. Israel
- 4.3. GCC
- 4.4. North Africa
- 4.5. South Africa
- 4.6. Rest of Middle East & Africa
-
5. Asia Pacific
- 5.1. China
- 5.2. India
- 5.3. Japan
- 5.4. South Korea
- 5.5. ASEAN
- 5.6. Oceania
- 5.7. Rest of Asia Pacific
App Store Optimization Aso Software Regional Market Share
Geographic Coverage of App Store Optimization Aso Software
App Store Optimization Aso Software REPORT HIGHLIGHTS
| Aspects | Details |
|---|---|
| Study Period | 2020-2034 |
| Base Year | 2025 |
| Estimated Year | 2026 |
| Forecast Period | 2026-2034 |
| Historical Period | 2020-2025 |
| Growth Rate | CAGR of 12.5% from 2020-2034 |
| Segmentation |
|
Table of Contents
- 1. Introduction
- 1.1. Research Scope
- 1.2. Market Segmentation
- 1.3. Research Objective
- 1.4. Definitions and Assumptions
- 2. Executive Summary
- 2.1. Market Snapshot
- 3. Market Dynamics
- 3.1. Market Drivers
- 3.2. Market Restrains
- 3.3. Market Trends
- 3.4. Market Opportunities
- 4. Market Factor Analysis
- 4.1. Porters Five Forces
- 4.1.1. Bargaining Power of Suppliers
- 4.1.2. Bargaining Power of Buyers
- 4.1.3. Threat of New Entrants
- 4.1.4. Threat of Substitutes
- 4.1.5. Competitive Rivalry
- 4.2. PESTEL analysis
- 4.3. BCG Analysis
- 4.3.1. Stars (High Growth, High Market Share)
- 4.3.2. Cash Cows (Low Growth, High Market Share)
- 4.3.3. Question Mark (High Growth, Low Market Share)
- 4.3.4. Dogs (Low Growth, Low Market Share)
- 4.4. Ansoff Matrix Analysis
- 4.5. Supply Chain Analysis
- 4.6. Regulatory Landscape
- 4.7. Current Market Potential and Opportunity Assessment (TAM–SAM–SOM Framework)
- 4.8. IMR Analyst Note
- 4.1. Porters Five Forces
- 5. Market Analysis, Insights and Forecast 2021-2033
- 5.1. Market Analysis, Insights and Forecast - by Application
- 5.1.1. SMEs
- 5.1.2. Large Enterprises
- 5.2. Market Analysis, Insights and Forecast - by Type
- 5.2.1. Cloud Based
- 5.2.2. On-premises
- 5.3. Market Analysis, Insights and Forecast - by Region
- 5.3.1. North America
- 5.3.2. South America
- 5.3.3. Europe
- 5.3.4. Middle East & Africa
- 5.3.5. Asia Pacific
- 5.1. Market Analysis, Insights and Forecast - by Application
- 6. Global App Store Optimization Aso Software Analysis, Insights and Forecast, 2021-2033
- 6.1. Market Analysis, Insights and Forecast - by Application
- 6.1.1. SMEs
- 6.1.2. Large Enterprises
- 6.2. Market Analysis, Insights and Forecast - by Type
- 6.2.1. Cloud Based
- 6.2.2. On-premises
- 6.1. Market Analysis, Insights and Forecast - by Application
- 7. North America App Store Optimization Aso Software Analysis, Insights and Forecast, 2020-2032
- 7.1. Market Analysis, Insights and Forecast - by Application
- 7.1.1. SMEs
- 7.1.2. Large Enterprises
- 7.2. Market Analysis, Insights and Forecast - by Type
- 7.2.1. Cloud Based
- 7.2.2. On-premises
- 7.1. Market Analysis, Insights and Forecast - by Application
- 8. South America App Store Optimization Aso Software Analysis, Insights and Forecast, 2020-2032
- 8.1. Market Analysis, Insights and Forecast - by Application
- 8.1.1. SMEs
- 8.1.2. Large Enterprises
- 8.2. Market Analysis, Insights and Forecast - by Type
- 8.2.1. Cloud Based
- 8.2.2. On-premises
- 8.1. Market Analysis, Insights and Forecast - by Application
- 9. Europe App Store Optimization Aso Software Analysis, Insights and Forecast, 2020-2032
- 9.1. Market Analysis, Insights and Forecast - by Application
- 9.1.1. SMEs
- 9.1.2. Large Enterprises
- 9.2. Market Analysis, Insights and Forecast - by Type
- 9.2.1. Cloud Based
- 9.2.2. On-premises
- 9.1. Market Analysis, Insights and Forecast - by Application
- 10. Middle East & Africa App Store Optimization Aso Software Analysis, Insights and Forecast, 2020-2032
- 10.1. Market Analysis, Insights and Forecast - by Application
- 10.1.1. SMEs
- 10.1.2. Large Enterprises
- 10.2. Market Analysis, Insights and Forecast - by Type
- 10.2.1. Cloud Based
- 10.2.2. On-premises
- 10.1. Market Analysis, Insights and Forecast - by Application
- 11. Asia Pacific App Store Optimization Aso Software Analysis, Insights and Forecast, 2020-2032
- 11.1. Market Analysis, Insights and Forecast - by Application
- 11.1.1. SMEs
- 11.1.2. Large Enterprises
- 11.2. Market Analysis, Insights and Forecast - by Type
- 11.2.1. Cloud Based
- 11.2.2. On-premises
- 11.1. Market Analysis, Insights and Forecast - by Application
- 12. Competitive Analysis
- 12.1. Company Profiles
- 12.1.1 AppFollow
- 12.1.1.1. Company Overview
- 12.1.1.2. Products
- 12.1.1.3. Company Financials
- 12.1.1.4. SWOT Analysis
- 12.1.2 AppTweak
- 12.1.2.1. Company Overview
- 12.1.2.2. Products
- 12.1.2.3. Company Financials
- 12.1.2.4. SWOT Analysis
- 12.1.3 ASOdesk
- 12.1.3.1. Company Overview
- 12.1.3.2. Products
- 12.1.3.3. Company Financials
- 12.1.3.4. SWOT Analysis
- 12.1.4 Adjust
- 12.1.4.1. Company Overview
- 12.1.4.2. Products
- 12.1.4.3. Company Financials
- 12.1.4.4. SWOT Analysis
- 12.1.5 MightySignal
- 12.1.5.1. Company Overview
- 12.1.5.2. Products
- 12.1.5.3. Company Financials
- 12.1.5.4. SWOT Analysis
- 12.1.6 App Radar
- 12.1.6.1. Company Overview
- 12.1.6.2. Products
- 12.1.6.3. Company Financials
- 12.1.6.4. SWOT Analysis
- 12.1.7 Kumulos
- 12.1.7.1. Company Overview
- 12.1.7.2. Products
- 12.1.7.3. Company Financials
- 12.1.7.4. SWOT Analysis
- 12.1.8 Appfigures
- 12.1.8.1. Company Overview
- 12.1.8.2. Products
- 12.1.8.3. Company Financials
- 12.1.8.4. SWOT Analysis
- 12.1.9 Sensor Tower
- 12.1.9.1. Company Overview
- 12.1.9.2. Products
- 12.1.9.3. Company Financials
- 12.1.9.4. SWOT Analysis
- 12.1.10 ASOMobile
- 12.1.10.1. Company Overview
- 12.1.10.2. Products
- 12.1.10.3. Company Financials
- 12.1.10.4. SWOT Analysis
- 12.1.11 Mobile Action
- 12.1.11.1. Company Overview
- 12.1.11.2. Products
- 12.1.11.3. Company Financials
- 12.1.11.4. SWOT Analysis
- 12.1.12 TheTool
- 12.1.12.1. Company Overview
- 12.1.12.2. Products
- 12.1.12.3. Company Financials
- 12.1.12.4. SWOT Analysis
- 12.1.13 Airnow
- 12.1.13.1. Company Overview
- 12.1.13.2. Products
- 12.1.13.3. Company Financials
- 12.1.13.4. SWOT Analysis
- 12.1.14 SplitMetrics
- 12.1.14.1. Company Overview
- 12.1.14.2. Products
- 12.1.14.3. Company Financials
- 12.1.14.4. SWOT Analysis
- 12.1.15 SearchMan
- 12.1.15.1. Company Overview
- 12.1.15.2. Products
- 12.1.15.3. Company Financials
- 12.1.15.4. SWOT Analysis
- 12.1.16 MobileAction
- 12.1.16.1. Company Overview
- 12.1.16.2. Products
- 12.1.16.3. Company Financials
- 12.1.16.4. SWOT Analysis
- 12.1.17 Gummicube
- 12.1.17.1. Company Overview
- 12.1.17.2. Products
- 12.1.17.3. Company Financials
- 12.1.17.4. SWOT Analysis
- 12.1.1 AppFollow
- 12.2. Market Entropy
- 12.2.1 Company's Key Areas Served
- 12.2.2 Recent Developments
- 12.3. Company Market Share Analysis 2025
- 12.3.1 Top 5 Companies Market Share Analysis
- 12.3.2 Top 3 Companies Market Share Analysis
- 12.4. List of Potential Customers
- 13. Research Methodology
List of Figures
- Figure 1: Global App Store Optimization Aso Software Revenue Breakdown (million, %) by Region 2025 & 2033
- Figure 2: North America App Store Optimization Aso Software Revenue (million), by Application 2025 & 2033
- Figure 3: North America App Store Optimization Aso Software Revenue Share (%), by Application 2025 & 2033
- Figure 4: North America App Store Optimization Aso Software Revenue (million), by Type 2025 & 2033
- Figure 5: North America App Store Optimization Aso Software Revenue Share (%), by Type 2025 & 2033
- Figure 6: North America App Store Optimization Aso Software Revenue (million), by Country 2025 & 2033
- Figure 7: North America App Store Optimization Aso Software Revenue Share (%), by Country 2025 & 2033
- Figure 8: South America App Store Optimization Aso Software Revenue (million), by Application 2025 & 2033
- Figure 9: South America App Store Optimization Aso Software Revenue Share (%), by Application 2025 & 2033
- Figure 10: South America App Store Optimization Aso Software Revenue (million), by Type 2025 & 2033
- Figure 11: South America App Store Optimization Aso Software Revenue Share (%), by Type 2025 & 2033
- Figure 12: South America App Store Optimization Aso Software Revenue (million), by Country 2025 & 2033
- Figure 13: South America App Store Optimization Aso Software Revenue Share (%), by Country 2025 & 2033
- Figure 14: Europe App Store Optimization Aso Software Revenue (million), by Application 2025 & 2033
- Figure 15: Europe App Store Optimization Aso Software Revenue Share (%), by Application 2025 & 2033
- Figure 16: Europe App Store Optimization Aso Software Revenue (million), by Type 2025 & 2033
- Figure 17: Europe App Store Optimization Aso Software Revenue Share (%), by Type 2025 & 2033
- Figure 18: Europe App Store Optimization Aso Software Revenue (million), by Country 2025 & 2033
- Figure 19: Europe App Store Optimization Aso Software Revenue Share (%), by Country 2025 & 2033
- Figure 20: Middle East & Africa App Store Optimization Aso Software Revenue (million), by Application 2025 & 2033
- Figure 21: Middle East & Africa App Store Optimization Aso Software Revenue Share (%), by Application 2025 & 2033
- Figure 22: Middle East & Africa App Store Optimization Aso Software Revenue (million), by Type 2025 & 2033
- Figure 23: Middle East & Africa App Store Optimization Aso Software Revenue Share (%), by Type 2025 & 2033
- Figure 24: Middle East & Africa App Store Optimization Aso Software Revenue (million), by Country 2025 & 2033
- Figure 25: Middle East & Africa App Store Optimization Aso Software Revenue Share (%), by Country 2025 & 2033
- Figure 26: Asia Pacific App Store Optimization Aso Software Revenue (million), by Application 2025 & 2033
- Figure 27: Asia Pacific App Store Optimization Aso Software Revenue Share (%), by Application 2025 & 2033
- Figure 28: Asia Pacific App Store Optimization Aso Software Revenue (million), by Type 2025 & 2033
- Figure 29: Asia Pacific App Store Optimization Aso Software Revenue Share (%), by Type 2025 & 2033
- Figure 30: Asia Pacific App Store Optimization Aso Software Revenue (million), by Country 2025 & 2033
- Figure 31: Asia Pacific App Store Optimization Aso Software Revenue Share (%), by Country 2025 & 2033
List of Tables
- Table 1: Global App Store Optimization Aso Software Revenue million Forecast, by Application 2020 & 2033
- Table 2: Global App Store Optimization Aso Software Revenue million Forecast, by Type 2020 & 2033
- Table 3: Global App Store Optimization Aso Software Revenue million Forecast, by Region 2020 & 2033
- Table 4: Global App Store Optimization Aso Software Revenue million Forecast, by Application 2020 & 2033
- Table 5: Global App Store Optimization Aso Software Revenue million Forecast, by Type 2020 & 2033
- Table 6: Global App Store Optimization Aso Software Revenue million Forecast, by Country 2020 & 2033
- Table 7: United States App Store Optimization Aso Software Revenue (million) Forecast, by Application 2020 & 2033
- Table 8: Canada App Store Optimization Aso Software Revenue (million) Forecast, by Application 2020 & 2033
- Table 9: Mexico App Store Optimization Aso Software Revenue (million) Forecast, by Application 2020 & 2033
- Table 10: Global App Store Optimization Aso Software Revenue million Forecast, by Application 2020 & 2033
- Table 11: Global App Store Optimization Aso Software Revenue million Forecast, by Type 2020 & 2033
- Table 12: Global App Store Optimization Aso Software Revenue million Forecast, by Country 2020 & 2033
- Table 13: Brazil App Store Optimization Aso Software Revenue (million) Forecast, by Application 2020 & 2033
- Table 14: Argentina App Store Optimization Aso Software Revenue (million) Forecast, by Application 2020 & 2033
- Table 15: Rest of South America App Store Optimization Aso Software Revenue (million) Forecast, by Application 2020 & 2033
- Table 16: Global App Store Optimization Aso Software Revenue million Forecast, by Application 2020 & 2033
- Table 17: Global App Store Optimization Aso Software Revenue million Forecast, by Type 2020 & 2033
- Table 18: Global App Store Optimization Aso Software Revenue million Forecast, by Country 2020 & 2033
- Table 19: United Kingdom App Store Optimization Aso Software Revenue (million) Forecast, by Application 2020 & 2033
- Table 20: Germany App Store Optimization Aso Software Revenue (million) Forecast, by Application 2020 & 2033
- Table 21: France App Store Optimization Aso Software Revenue (million) Forecast, by Application 2020 & 2033
- Table 22: Italy App Store Optimization Aso Software Revenue (million) Forecast, by Application 2020 & 2033
- Table 23: Spain App Store Optimization Aso Software Revenue (million) Forecast, by Application 2020 & 2033
- Table 24: Russia App Store Optimization Aso Software Revenue (million) Forecast, by Application 2020 & 2033
- Table 25: Benelux App Store Optimization Aso Software Revenue (million) Forecast, by Application 2020 & 2033
- Table 26: Nordics App Store Optimization Aso Software Revenue (million) Forecast, by Application 2020 & 2033
- Table 27: Rest of Europe App Store Optimization Aso Software Revenue (million) Forecast, by Application 2020 & 2033
- Table 28: Global App Store Optimization Aso Software Revenue million Forecast, by Application 2020 & 2033
- Table 29: Global App Store Optimization Aso Software Revenue million Forecast, by Type 2020 & 2033
- Table 30: Global App Store Optimization Aso Software Revenue million Forecast, by Country 2020 & 2033
- Table 31: Turkey App Store Optimization Aso Software Revenue (million) Forecast, by Application 2020 & 2033
- Table 32: Israel App Store Optimization Aso Software Revenue (million) Forecast, by Application 2020 & 2033
- Table 33: GCC App Store Optimization Aso Software Revenue (million) Forecast, by Application 2020 & 2033
- Table 34: North Africa App Store Optimization Aso Software Revenue (million) Forecast, by Application 2020 & 2033
- Table 35: South Africa App Store Optimization Aso Software Revenue (million) Forecast, by Application 2020 & 2033
- Table 36: Rest of Middle East & Africa App Store Optimization Aso Software Revenue (million) Forecast, by Application 2020 & 2033
- Table 37: Global App Store Optimization Aso Software Revenue million Forecast, by Application 2020 & 2033
- Table 38: Global App Store Optimization Aso Software Revenue million Forecast, by Type 2020 & 2033
- Table 39: Global App Store Optimization Aso Software Revenue million Forecast, by Country 2020 & 2033
- Table 40: China App Store Optimization Aso Software Revenue (million) Forecast, by Application 2020 & 2033
- Table 41: India App Store Optimization Aso Software Revenue (million) Forecast, by Application 2020 & 2033
- Table 42: Japan App Store Optimization Aso Software Revenue (million) Forecast, by Application 2020 & 2033
- Table 43: South Korea App Store Optimization Aso Software Revenue (million) Forecast, by Application 2020 & 2033
- Table 44: ASEAN App Store Optimization Aso Software Revenue (million) Forecast, by Application 2020 & 2033
- Table 45: Oceania App Store Optimization Aso Software Revenue (million) Forecast, by Application 2020 & 2033
- Table 46: Rest of Asia Pacific App Store Optimization Aso Software Revenue (million) Forecast, by Application 2020 & 2033
Frequently Asked Questions
1. What is the projected Compound Annual Growth Rate (CAGR) of the App Store Optimization Aso Software?
The projected CAGR is approximately 12.5%.
2. Which companies are prominent players in the App Store Optimization Aso Software?
Key companies in the market include AppFollow, AppTweak, ASOdesk, Adjust, MightySignal, App Radar, Kumulos, Appfigures, Sensor Tower, ASOMobile, Mobile Action, TheTool, Airnow, SplitMetrics, SearchMan, MobileAction, Gummicube.
3. What are the main segments of the App Store Optimization Aso Software?
The market segments include Application, Type.
4. Can you provide details about the market size?
The market size is estimated to be USD 1157 million as of 2022.
5. What are some drivers contributing to market growth?
N/A
6. What are the notable trends driving market growth?
N/A
7. Are there any restraints impacting market growth?
N/A
8. Can you provide examples of recent developments in the market?
N/A
9. What pricing options are available for accessing the report?
Pricing options include single-user, multi-user, and enterprise licenses priced at USD 4250.00, USD 6375.00, and USD 8500.00 respectively.
10. Is the market size provided in terms of value or volume?
The market size is provided in terms of value, measured in million.
11. Are there any specific market keywords associated with the report?
Yes, the market keyword associated with the report is "App Store Optimization Aso Software," which aids in identifying and referencing the specific market segment covered.
12. How do I determine which pricing option suits my needs best?
The pricing options vary based on user requirements and access needs. Individual users may opt for single-user licenses, while businesses requiring broader access may choose multi-user or enterprise licenses for cost-effective access to the report.
13. Are there any additional resources or data provided in the App Store Optimization Aso Software report?
While the report offers comprehensive insights, it's advisable to review the specific contents or supplementary materials provided to ascertain if additional resources or data are available.
14. How can I stay updated on further developments or reports in the App Store Optimization Aso Software?
To stay informed about further developments, trends, and reports in the App Store Optimization Aso Software, consider subscribing to industry newsletters, following relevant companies and organizations, or regularly checking reputable industry news sources and publications.
Methodology
Step 1 - Identification of Relevant Samples Size from Population Database


Step 2 - Approaches for Defining Global Market Size (Value, Volume* & Price*)

Note*: In applicable scenarios
Step 3 - Data Sources
Primary Research
- Web Analytics
- Survey Reports
- Research Institute
- Latest Research Reports
- Opinion Leaders
Secondary Research
- Annual Reports
- White Paper
- Latest Press Release
- Industry Association
- Paid Database
- Investor Presentations

Step 4 - Data Triangulation
Involves using different sources of information in order to increase the validity of a study
These sources are likely to be stakeholders in a program - participants, other researchers, program staff, other community members, and so on.
Then we put all data in single framework & apply various statistical tools to find out the dynamic on the market.
During the analysis stage, feedback from the stakeholder groups would be compared to determine areas of agreement as well as areas of divergence