

Key Insights
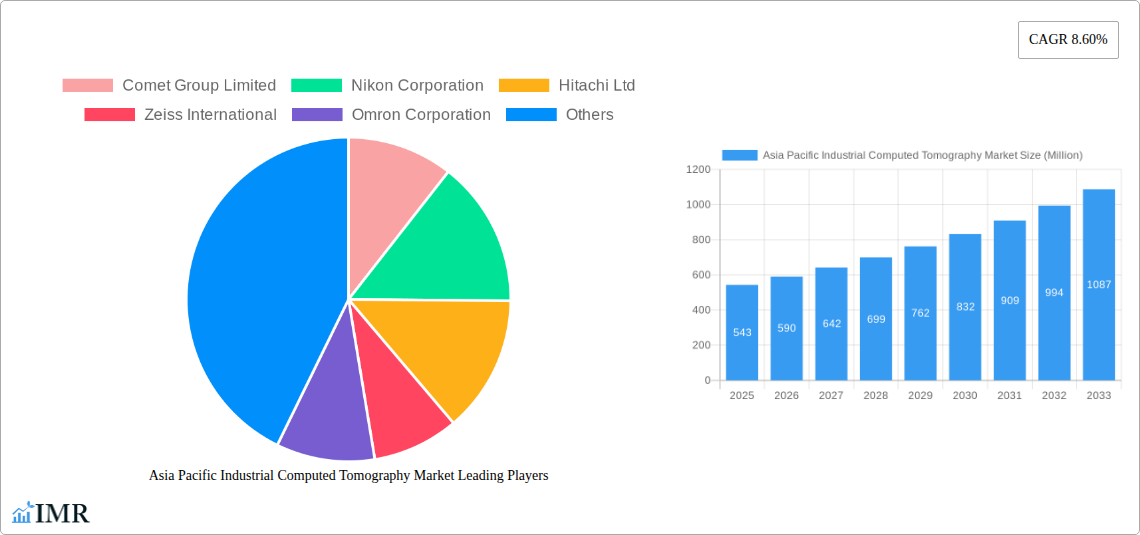
The Asia Pacific Industrial Computed Tomography (ICT) market is demonstrating substantial growth, propelled by its increasing adoption across key sectors including aerospace, automotive, and electronics. This expansion is primarily driven by the region's robust manufacturing base and the escalating demand for sophisticated non-destructive testing (NDT) methods, essential for quality control and process optimization. With a projected Compound Annual Growth Rate (CAGR) of **19.04%** from a base year of 2025, the market is poised for significant advancement. Key applications fueling this demand include flaw detection and inspection, which are critical for ensuring product safety and reliability, as well as failure and assembly analysis, vital for enhancing manufacturing processes and mitigating product recalls. The estimated market size for 2025 is **536 million**. China, Japan, South Korea, and India are leading this growth, reflecting their advanced manufacturing capabilities. The competitive landscape, featuring prominent players like Nikon, Hitachi, and Zeiss, fosters technological innovation and market penetration. However, challenges such as high equipment costs and the requirement for skilled personnel may present adoption hurdles for smaller enterprises.
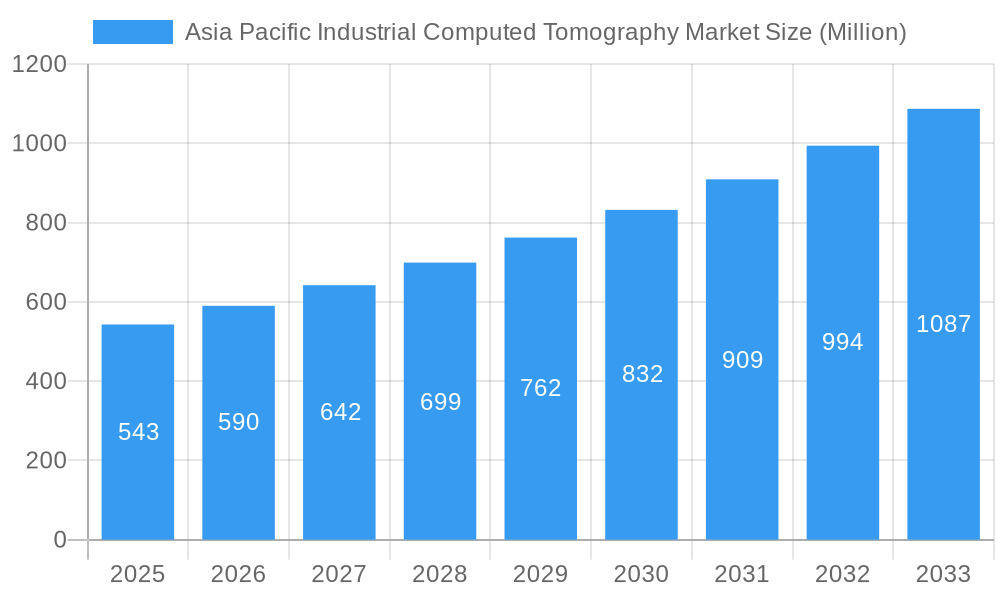
Asia Pacific Industrial Computed Tomography Market Market Size (In Million)
The sustained expansion of the Asia Pacific ICT market is contingent upon several factors. Technological advancements in ICT, promising higher resolution imaging and accelerated scanning speeds, are anticipated to boost adoption. The integration of ICT with emerging manufacturing technologies like AI and automation will further enhance efficiency and analytical capabilities. Increased awareness of ICT's benefits for quality assurance and defect reduction, coupled with stringent industry regulations, will contribute to market growth. Competitive pricing strategies from key market participants will also play a crucial role in broadening ICT adoption across diverse industries and geographies within the Asia Pacific. Despite existing restraints, such as the need for specialized expertise and significant initial investment, the market outlook remains highly optimistic, forecasting continued expansion and considerable market opportunities throughout the forecast period.
Asia Pacific Industrial Computed Tomography Market Company Market Share
Asia Pacific Industrial Computed Tomography Market: A Comprehensive Report (2019-2033)
This in-depth report provides a comprehensive analysis of the Asia Pacific Industrial Computed Tomography (CT) market, covering market dynamics, growth trends, key players, and future outlook. The report segments the market by application (Flaw Detection and Inspection, Failure Analysis, Assembly Analysis, Other Applications) and end-user industry (Aerospace, Automotive, Electronics, Oil and Gas, Other End-User Industries), offering granular insights for strategic decision-making. The study period spans 2019-2033, with 2025 as the base and estimated year. The market size is presented in million units.
Asia Pacific Industrial Computed Tomography Market Dynamics & Structure
The Asia Pacific industrial computed tomography market is characterized by moderate concentration, with key players like Comet Group Limited, Nikon Corporation, Hitachi Ltd, Zeiss International, Omron Corporation, Thermo Fischer Scientific Inc, Shimadzu Corporation, Waygate Technologies (Baker Hughes Digital Solutions GmbH), Bruker Corporation, and Shimadzu Corporation competing for market share. The market is driven by technological advancements leading to higher resolution imaging and faster scan times, coupled with increasing demand for quality control and non-destructive testing across diverse industries.
- Market Concentration: Moderately concentrated, with top 10 players holding approximately xx% market share in 2024.
- Technological Innovation: Significant investments in AI-powered image analysis and miniaturization of CT systems are key drivers.
- Regulatory Frameworks: Stringent quality control regulations across various industries, particularly aerospace and automotive, are boosting adoption.
- Competitive Substitutes: Traditional inspection methods like X-ray radiography pose some competition, but CT offers superior 3D visualization.
- End-User Demographics: Growth is fueled by expanding manufacturing sectors, particularly electronics and automotive in countries like China, South Korea, and Japan.
- M&A Trends: A moderate number of mergers and acquisitions (xx deals in the last 5 years) have been observed, primarily focused on expanding product portfolios and geographical reach.
Asia Pacific Industrial Computed Tomography Market Growth Trends & Insights
The Asia Pacific industrial computed tomography market witnessed robust growth during the historical period (2019-2024), expanding at a CAGR of xx%. This growth is expected to continue during the forecast period (2025-2033), driven by increasing adoption across various end-user industries, particularly in the electronics and automotive sectors. The market is projected to reach xx million units by 2033, exhibiting a CAGR of xx% during the forecast period. Technological disruptions, such as the introduction of faster and more compact systems, are accelerating market penetration. Consumer behavior shifts toward higher quality and more efficient inspection methods are further fueling demand. Market penetration in key segments like aerospace and automotive remains relatively low, indicating significant untapped potential. The growing focus on Industry 4.0 and the need for real-time quality control further contributes to the market's growth trajectory.
Dominant Regions, Countries, or Segments in Asia Pacific Industrial Computed Tomography Market
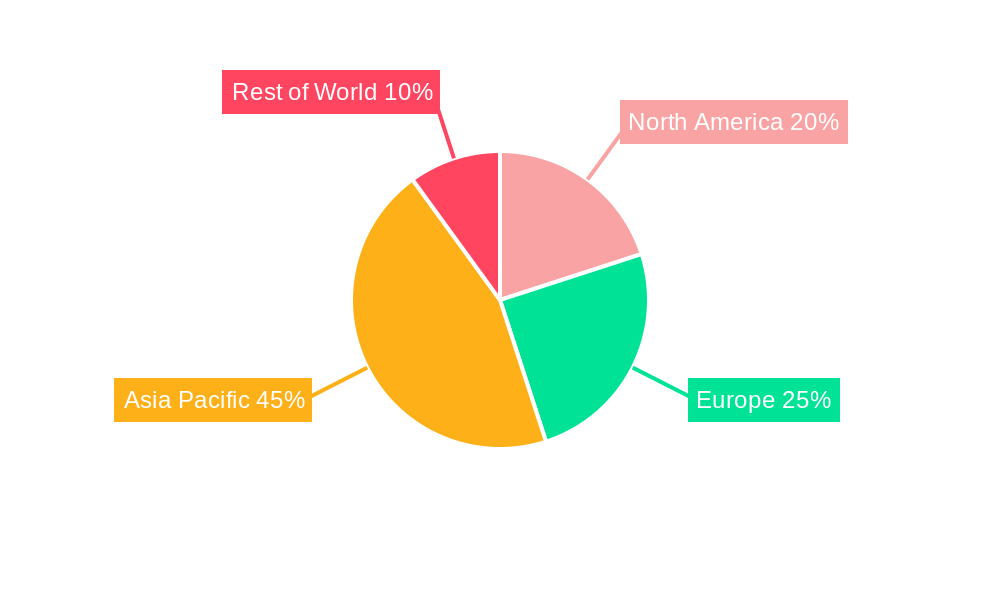
China is the dominant region in the Asia Pacific industrial computed tomography market, followed by Japan and South Korea. The strong manufacturing base and rapid technological advancements in these countries fuel demand. The Flaw Detection and Inspection segment holds the largest market share among applications, driven by the critical need for ensuring product quality and safety across diverse industries. Within end-user industries, the electronics and automotive sectors are the key contributors to market growth due to their high production volumes and stringent quality standards.
- Key Drivers in China: Strong government support for manufacturing, substantial investments in infrastructure, and a large pool of skilled labor.
- Key Drivers in Japan: Advanced technological capabilities, strong R&D activities, and high adoption rates in industries such as automotive and electronics.
- Key Drivers in South Korea: Focus on high-precision manufacturing, a robust electronics industry, and increasing automation in manufacturing processes.
- Segment Dominance: Flaw detection and inspection segment accounts for approximately xx% of the market, driven by the critical need for quality control.
Asia Pacific Industrial Computed Tomography Market Product Landscape
Recent product innovations have focused on improving image resolution, scan speed, and ease of use. Systems are becoming more compact and user-friendly, leading to wider adoption across various industries. Key technological advancements include AI-powered image analysis for automated flaw detection and cloud-based data management for improved efficiency. Unique selling propositions focus on speed, accuracy, and ease of integration into existing manufacturing workflows.
Key Drivers, Barriers & Challenges in Asia Pacific Industrial Computed Tomography Market
Key Drivers:
- Increasing demand for quality control and non-destructive testing across various industries.
- Technological advancements leading to higher resolution imaging and faster scan times.
- Stringent regulatory frameworks requiring thorough product inspection.
Key Challenges:
- High initial investment cost for CT systems.
- Need for skilled personnel to operate and interpret the data.
- Competition from traditional inspection methods, impacting market penetration in certain segments. The overall impact of these factors on market growth is estimated at approximately xx% reduction in the CAGR by 2033.
Emerging Opportunities in Asia Pacific Industrial Computed Tomography Market
- Growing adoption in emerging industries like renewable energy and medical device manufacturing.
- Development of portable and handheld CT systems for on-site inspections.
- Increased demand for AI-powered image analysis for improved accuracy and efficiency.
- Growing focus on predictive maintenance using CT data.
Growth Accelerators in the Asia Pacific Industrial Computed Tomography Market Industry
Technological breakthroughs in X-ray source technology, detector technology, and image processing algorithms are expected to drive significant growth. Strategic partnerships between CT manufacturers and end-user industries can help to accelerate adoption. Market expansion strategies focusing on emerging markets and untapped applications can also significantly contribute to market expansion.
Key Players Shaping the Asia Pacific Industrial Computed Tomography Market Market
- Comet Group Limited
- Nikon Corporation
- Hitachi Ltd
- Zeiss International
- Omron Corporation
- Thermo Fischer Scientific Inc
- Shimadzu Corporation
- Waygate Technologies (Baker Hughes Digital Solutions GmbH)
- Bruker Corporation
- Shimadzu Corporation
Notable Milestones in Asia Pacific Industrial Computed Tomography Market Sector
- May 2022: Shimadzu Corporation launched the XSeeker 8000, a compact and lightweight X-ray CT system, expanding market accessibility.
- November 2021: Omron Corporation unveiled the VT-X750-V3, a high-speed CT-type X-ray inspection device, improving efficiency in electronics manufacturing.
In-Depth Asia Pacific Industrial Computed Tomography Market Outlook
The Asia Pacific industrial computed tomography market is poised for significant growth in the coming years, driven by continuous technological advancements, increasing demand across diverse industries, and expanding market penetration in emerging economies. Strategic investments in R&D, focused on miniaturization, AI integration, and enhanced user experience, will shape future market dynamics. Opportunities abound for companies that can offer innovative solutions addressing the specific needs of different end-user industries. The market's long-term growth trajectory is extremely positive, promising significant returns for companies positioned to capitalize on these trends.
Asia Pacific Industrial Computed Tomography Market Segmentation
-
1. Application
- 1.1. Flaw Detection and Inspection
- 1.2. Failure Analysis
- 1.3. Assembly Analysis
- 1.4. Other Applications
-
2. End-User Industry
- 2.1. Aerospace
- 2.2. Automotive
- 2.3. Electronics
- 2.4. Oil and Gas
- 2.5. Other End-User Industries
Asia Pacific Industrial Computed Tomography Market Segmentation By Geography
-
1. Asia Pacific
- 1.1. China
- 1.2. Japan
- 1.3. South Korea
- 1.4. India
- 1.5. Australia
- 1.6. New Zealand
- 1.7. Indonesia
- 1.8. Malaysia
- 1.9. Singapore
- 1.10. Thailand
- 1.11. Vietnam
- 1.12. Philippines
Asia Pacific Industrial Computed Tomography Market Regional Market Share
Geographic Coverage of Asia Pacific Industrial Computed Tomography Market
Asia Pacific Industrial Computed Tomography Market REPORT HIGHLIGHTS
| Aspects | Details |
|---|---|
| Study Period | 2020-2034 |
| Base Year | 2025 |
| Estimated Year | 2026 |
| Forecast Period | 2026-2034 |
| Historical Period | 2020-2025 |
| Growth Rate | CAGR of 19.04% from 2020-2034 |
| Segmentation |
|
Table of Contents
- 1. Introduction
- 1.1. Research Scope
- 1.2. Market Segmentation
- 1.3. Research Objective
- 1.4. Definitions and Assumptions
- 2. Executive Summary
- 2.1. Market Snapshot
- 3. Market Dynamics
- 3.1. Market Drivers
- 3.2. Market Restrains
- 3.3. Market Trends
- 3.4. Market Opportunities
- 4. Market Factor Analysis
- 4.1. Porters Five Forces
- 4.1.1. Bargaining Power of Suppliers
- 4.1.2. Bargaining Power of Buyers
- 4.1.3. Threat of New Entrants
- 4.1.4. Threat of Substitutes
- 4.1.5. Competitive Rivalry
- 4.2. PESTEL analysis
- 4.3. BCG Analysis
- 4.3.1. Stars (High Growth, High Market Share)
- 4.3.2. Cash Cows (Low Growth, High Market Share)
- 4.3.3. Question Mark (High Growth, Low Market Share)
- 4.3.4. Dogs (Low Growth, Low Market Share)
- 4.4. Ansoff Matrix Analysis
- 4.5. Supply Chain Analysis
- 4.6. Regulatory Landscape
- 4.7. Current Market Potential and Opportunity Assessment (TAM–SAM–SOM Framework)
- 4.8. IMR Analyst Note
- 4.1. Porters Five Forces
- 5. Market Analysis, Insights and Forecast 2021-2033
- 5.1. Market Analysis, Insights and Forecast - by Application
- 5.1.1. Flaw Detection and Inspection
- 5.1.2. Failure Analysis
- 5.1.3. Assembly Analysis
- 5.1.4. Other Applications
- 5.2. Market Analysis, Insights and Forecast - by End-User Industry
- 5.2.1. Aerospace
- 5.2.2. Automotive
- 5.2.3. Electronics
- 5.2.4. Oil and Gas
- 5.2.5. Other End-User Industries
- 5.3. Market Analysis, Insights and Forecast - by Region
- 5.3.1. Asia Pacific
- 5.1. Market Analysis, Insights and Forecast - by Application
- 6. Asia Pacific Industrial Computed Tomography Market Analysis, Insights and Forecast, 2021-2033
- 6.1. Market Analysis, Insights and Forecast - by Application
- 6.1.1. Flaw Detection and Inspection
- 6.1.2. Failure Analysis
- 6.1.3. Assembly Analysis
- 6.1.4. Other Applications
- 6.2. Market Analysis, Insights and Forecast - by End-User Industry
- 6.2.1. Aerospace
- 6.2.2. Automotive
- 6.2.3. Electronics
- 6.2.4. Oil and Gas
- 6.2.5. Other End-User Industries
- 6.1. Market Analysis, Insights and Forecast - by Application
- 7. Competitive Analysis
- 7.1. Company Profiles
- 7.1.1 Comet Group Limited
- 7.1.1.1. Company Overview
- 7.1.1.2. Products
- 7.1.1.3. Company Financials
- 7.1.1.4. SWOT Analysis
- 7.1.2 Nikon Corporation
- 7.1.2.1. Company Overview
- 7.1.2.2. Products
- 7.1.2.3. Company Financials
- 7.1.2.4. SWOT Analysis
- 7.1.3 Hitachi Ltd
- 7.1.3.1. Company Overview
- 7.1.3.2. Products
- 7.1.3.3. Company Financials
- 7.1.3.4. SWOT Analysis
- 7.1.4 Zeiss International
- 7.1.4.1. Company Overview
- 7.1.4.2. Products
- 7.1.4.3. Company Financials
- 7.1.4.4. SWOT Analysis
- 7.1.5 Omron Corporation
- 7.1.5.1. Company Overview
- 7.1.5.2. Products
- 7.1.5.3. Company Financials
- 7.1.5.4. SWOT Analysis
- 7.1.6 Thermo Fischer Scientific Inc
- 7.1.6.1. Company Overview
- 7.1.6.2. Products
- 7.1.6.3. Company Financials
- 7.1.6.4. SWOT Analysis
- 7.1.7 Shimadzu Corporation
- 7.1.7.1. Company Overview
- 7.1.7.2. Products
- 7.1.7.3. Company Financials
- 7.1.7.4. SWOT Analysis
- 7.1.8 Waygate Technologies (Baker Hughes Digital Solutions GmbH)
- 7.1.8.1. Company Overview
- 7.1.8.2. Products
- 7.1.8.3. Company Financials
- 7.1.8.4. SWOT Analysis
- 7.1.9 Bruker Corporation
- 7.1.9.1. Company Overview
- 7.1.9.2. Products
- 7.1.9.3. Company Financials
- 7.1.9.4. SWOT Analysis
- 7.1.10 Shimadzu Corporation
- 7.1.10.1. Company Overview
- 7.1.10.2. Products
- 7.1.10.3. Company Financials
- 7.1.10.4. SWOT Analysis
- 7.1.1 Comet Group Limited
- 7.2. Market Entropy
- 7.2.1 Company's Key Areas Served
- 7.2.2 Recent Developments
- 7.3. Company Market Share Analysis 2025
- 7.3.1 Top 5 Companies Market Share Analysis
- 7.3.2 Top 3 Companies Market Share Analysis
- 7.4. List of Potential Customers
- 8. Research Methodology
List of Figures
- Figure 1: Asia Pacific Industrial Computed Tomography Market Revenue Breakdown (million, %) by Product 2025 & 2033
- Figure 2: Asia Pacific Industrial Computed Tomography Market Share (%) by Company 2025
List of Tables
- Table 1: Asia Pacific Industrial Computed Tomography Market Revenue million Forecast, by Application 2020 & 2033
- Table 2: Asia Pacific Industrial Computed Tomography Market Revenue million Forecast, by End-User Industry 2020 & 2033
- Table 3: Asia Pacific Industrial Computed Tomography Market Revenue million Forecast, by Region 2020 & 2033
- Table 4: Asia Pacific Industrial Computed Tomography Market Revenue million Forecast, by Application 2020 & 2033
- Table 5: Asia Pacific Industrial Computed Tomography Market Revenue million Forecast, by End-User Industry 2020 & 2033
- Table 6: Asia Pacific Industrial Computed Tomography Market Revenue million Forecast, by Country 2020 & 2033
- Table 7: China Asia Pacific Industrial Computed Tomography Market Revenue (million) Forecast, by Application 2020 & 2033
- Table 8: Japan Asia Pacific Industrial Computed Tomography Market Revenue (million) Forecast, by Application 2020 & 2033
- Table 9: South Korea Asia Pacific Industrial Computed Tomography Market Revenue (million) Forecast, by Application 2020 & 2033
- Table 10: India Asia Pacific Industrial Computed Tomography Market Revenue (million) Forecast, by Application 2020 & 2033
- Table 11: Australia Asia Pacific Industrial Computed Tomography Market Revenue (million) Forecast, by Application 2020 & 2033
- Table 12: New Zealand Asia Pacific Industrial Computed Tomography Market Revenue (million) Forecast, by Application 2020 & 2033
- Table 13: Indonesia Asia Pacific Industrial Computed Tomography Market Revenue (million) Forecast, by Application 2020 & 2033
- Table 14: Malaysia Asia Pacific Industrial Computed Tomography Market Revenue (million) Forecast, by Application 2020 & 2033
- Table 15: Singapore Asia Pacific Industrial Computed Tomography Market Revenue (million) Forecast, by Application 2020 & 2033
- Table 16: Thailand Asia Pacific Industrial Computed Tomography Market Revenue (million) Forecast, by Application 2020 & 2033
- Table 17: Vietnam Asia Pacific Industrial Computed Tomography Market Revenue (million) Forecast, by Application 2020 & 2033
- Table 18: Philippines Asia Pacific Industrial Computed Tomography Market Revenue (million) Forecast, by Application 2020 & 2033
Frequently Asked Questions
1. What is the projected Compound Annual Growth Rate (CAGR) of the Asia Pacific Industrial Computed Tomography Market?
The projected CAGR is approximately 19.04%.
2. Which companies are prominent players in the Asia Pacific Industrial Computed Tomography Market?
Key companies in the market include Comet Group Limited, Nikon Corporation, Hitachi Ltd, Zeiss International, Omron Corporation, Thermo Fischer Scientific Inc, Shimadzu Corporation, Waygate Technologies (Baker Hughes Digital Solutions GmbH), Bruker Corporation, Shimadzu Corporation.
3. What are the main segments of the Asia Pacific Industrial Computed Tomography Market?
The market segments include Application, End-User Industry.
4. Can you provide details about the market size?
The market size is estimated to be USD 536 million as of 2022.
5. What are some drivers contributing to market growth?
Rising Demand for Portable Radiography Equipment; Technology Advancements in Resolution and Image Processing.
6. What are the notable trends driving market growth?
Automotive to Gain Significant Growth in the Region.
7. Are there any restraints impacting market growth?
High Installation Cost and Longer ROI Period; Longer Replacement Cycle of Water Meters.
8. Can you provide examples of recent developments in the market?
May 2022 - Shimadzu Corporation announced the release of the XSeeker 8000 bench-top X-ray CT system. It is considered to be the smallest and lightest X-ray system. It offers clear images of a variety of samples, from resin molded parts to aluminum die cast and other metallic elements.
9. What pricing options are available for accessing the report?
Pricing options include single-user, multi-user, and enterprise licenses priced at USD 4750, USD 5250, and USD 8750 respectively.
10. Is the market size provided in terms of value or volume?
The market size is provided in terms of value, measured in million.
11. Are there any specific market keywords associated with the report?
Yes, the market keyword associated with the report is "Asia Pacific Industrial Computed Tomography Market," which aids in identifying and referencing the specific market segment covered.
12. How do I determine which pricing option suits my needs best?
The pricing options vary based on user requirements and access needs. Individual users may opt for single-user licenses, while businesses requiring broader access may choose multi-user or enterprise licenses for cost-effective access to the report.
13. Are there any additional resources or data provided in the Asia Pacific Industrial Computed Tomography Market report?
While the report offers comprehensive insights, it's advisable to review the specific contents or supplementary materials provided to ascertain if additional resources or data are available.
14. How can I stay updated on further developments or reports in the Asia Pacific Industrial Computed Tomography Market?
To stay informed about further developments, trends, and reports in the Asia Pacific Industrial Computed Tomography Market, consider subscribing to industry newsletters, following relevant companies and organizations, or regularly checking reputable industry news sources and publications.
Methodology
Step 1 - Identification of Relevant Samples Size from Population Database


Step 2 - Approaches for Defining Global Market Size (Value, Volume* & Price*)

Note*: In applicable scenarios
Step 3 - Data Sources
Primary Research
- Web Analytics
- Survey Reports
- Research Institute
- Latest Research Reports
- Opinion Leaders
Secondary Research
- Annual Reports
- White Paper
- Latest Press Release
- Industry Association
- Paid Database
- Investor Presentations

Step 4 - Data Triangulation
Involves using different sources of information in order to increase the validity of a study
These sources are likely to be stakeholders in a program - participants, other researchers, program staff, other community members, and so on.
Then we put all data in single framework & apply various statistical tools to find out the dynamic on the market.
During the analysis stage, feedback from the stakeholder groups would be compared to determine areas of agreement as well as areas of divergence