

Key Insights
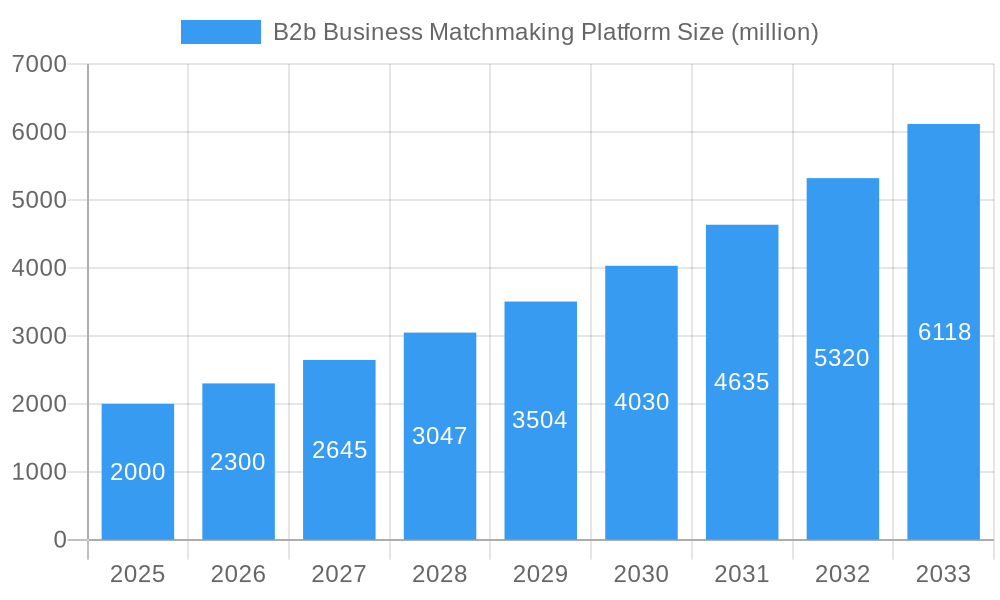
The B2B business matchmaking platform market is experiencing robust growth, driven by the increasing need for efficient networking and lead generation among businesses globally. The market's expansion is fueled by several key factors, including the rising adoption of digital technologies, the increasing demand for personalized networking experiences, and the growing preference for virtual and hybrid events. Businesses are increasingly recognizing the value of targeted matchmaking solutions to connect with potential partners, investors, and clients more effectively, leading to accelerated deal closures and improved business outcomes. This shift towards digital platforms offers significant advantages over traditional networking methods, such as cost-effectiveness, scalability, and data-driven insights. We estimate the market size to be around $2 billion in 2025, with a compound annual growth rate (CAGR) of 15% projected over the forecast period of 2025-2033. This growth trajectory is underpinned by the continuous innovation within the platform features, including AI-powered matching algorithms and sophisticated analytics that enhance user experience and improve matchmaking accuracy. While market restraints include security concerns related to data privacy and the need for continuous platform upgrades, the overall market outlook remains positive, with a significant increase in market penetration expected in the coming years.
B2b Business Matchmaking Platform Market Size (In Billion)
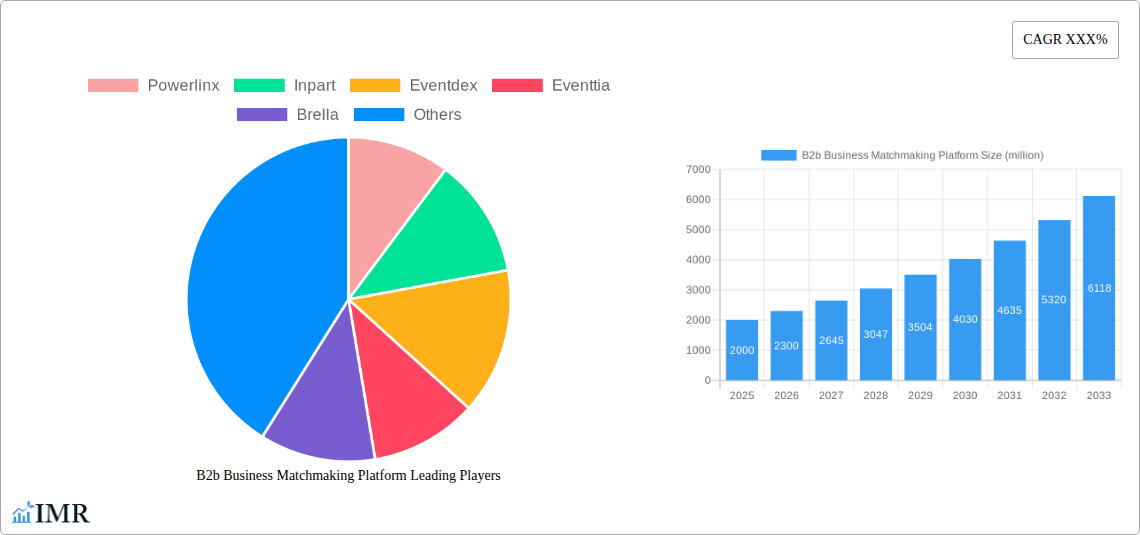
The competitive landscape is dynamic, featuring a mix of established players and emerging startups. Established companies like Powerlinx and Eventdex are leveraging their extensive networks and experience to maintain their market share, while newer players are entering the market with innovative features and business models. The market is witnessing a trend towards specialization, with some platforms focusing on specific industries or niches. Geographic expansion is another key trend, with platforms increasingly targeting emerging markets with high growth potential. The success of these platforms hinges on their ability to deliver a seamless and effective user experience, integrate with other business tools, and provide robust data analytics to track and measure the return on investment for their users. Strategic partnerships and mergers and acquisitions are also expected to reshape the competitive landscape further.
B2b Business Matchmaking Platform Company Market Share
B2B Business Matchmaking Platform Market Report: 2019-2033
This comprehensive report provides an in-depth analysis of the B2B business matchmaking platform market, encompassing market dynamics, growth trends, regional segmentation, product landscape, key players, and future outlook. The study period covers 2019-2033, with 2025 as the base and estimated year. The forecast period spans 2025-2033, and the historical period includes 2019-2024. This report is crucial for businesses operating in the parent market of Business Networking Platforms and the child market of Online Event Management Software.
B2b Business Matchmaking Platform Market Dynamics & Structure
The B2B business matchmaking platform market exhibits moderate concentration, with key players vying for market share. Technological innovation, particularly in AI-driven matchmaking and virtual event capabilities, is a major driver. Regulatory frameworks related to data privacy and security significantly influence market operations. The emergence of alternative networking methods and the rise of social media platforms present competitive substitutes. The end-user demographic primarily comprises SMEs and large enterprises across diverse industries. Mergers and acquisitions (M&A) activity is expected to remain steady, with larger players seeking to expand their market reach and product portfolios.
- Market Concentration: Moderately concentrated, with top 5 players holding approximately 40% market share in 2025 (estimated).
- Technological Innovation: AI-powered matchmaking algorithms, virtual event integration, and enhanced data analytics are key drivers.
- Regulatory Frameworks: GDPR and CCPA compliance are paramount, impacting data handling practices.
- Competitive Substitutes: Social media platforms, industry-specific networking events, and traditional business directories pose challenges.
- M&A Trends: An estimated xx M&A deals in the B2B matchmaking platform sector are predicted between 2025-2033, primarily driven by consolidation and expansion.
- Innovation Barriers: High development costs, integration complexities, and securing data privacy compliance represent significant hurdles.
B2b Business Matchmaking Platform Growth Trends & Insights
The global B2B business matchmaking platform market is experiencing robust growth, driven by the increasing adoption of digital networking solutions and the need for efficient business collaborations. Market size witnessed a Compound Annual Growth Rate (CAGR) of xx% during the historical period (2019-2024). This growth is projected to continue at a CAGR of xx% during the forecast period (2025-2033), reaching an estimated market value of $xx billion by 2033. This expansion is fueled by the rising popularity of virtual events, the increasing demand for targeted lead generation, and the evolution of sophisticated matchmaking algorithms that improve connection quality and facilitate more effective networking. Market penetration among SMEs is particularly high. The increasing preference for personalized experiences contributes to the growth of more specialized, niche-based platforms.
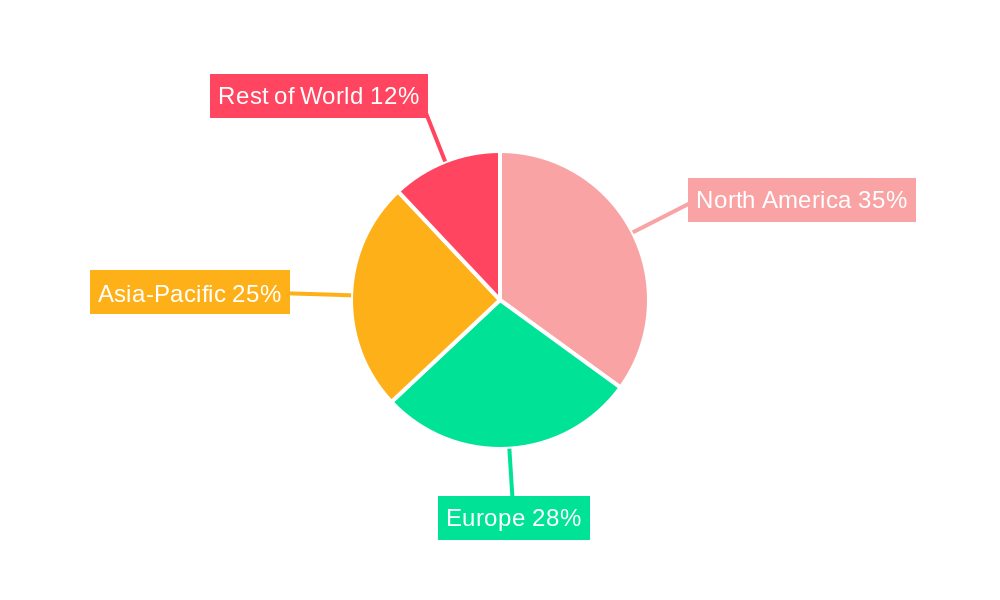
Dominant Regions, Countries, or Segments in B2b Business Matchmaking Platform
North America currently dominates the B2B business matchmaking platform market, driven by the high adoption of technology and a robust entrepreneurial ecosystem. This region holds approximately 45% market share. Europe and Asia-Pacific are also showing significant growth potential, although at a slower rate than North America. The strong presence of established tech companies and supportive regulatory frameworks in North America contribute to its dominant position.
- Key Drivers in North America: Strong technological infrastructure, high internet penetration, and a large base of SMEs actively seeking networking solutions.
- Growth Potential in Asia-Pacific: Rapid economic expansion, increasing smartphone usage, and a burgeoning start-up ecosystem.
- Market Share: North America (45%), Europe (30%), Asia-Pacific (20%), Rest of the World (5%) (2025 estimated).
B2b Business Matchmaking Platform Product Landscape
The product landscape is characterized by diverse offerings ranging from basic matchmaking platforms to advanced solutions integrating AI-powered algorithms, virtual event capabilities, and robust data analytics dashboards. Key product innovations include personalized matchmaking, AI-driven lead scoring, and seamless integration with CRM systems. These platforms offer unique selling propositions such as improved lead qualification, increased networking efficiency, and enhanced data-driven insights to optimize business development strategies. Performance metrics commonly tracked include connection success rates, lead generation effectiveness, and user engagement levels.
Key Drivers, Barriers & Challenges in B2b Business Matchmaking Platform
Key Drivers:
- Increasing demand for efficient networking solutions amongst businesses.
- Rising adoption of digital technologies and virtual events.
- Growing need for targeted lead generation and business development.
Challenges and Restraints:
- Data security and privacy concerns.
- Competition from established networking platforms and social media.
- High development and maintenance costs.
- Integration complexities with existing CRM and other business systems. The impact of these challenges is estimated to slow down growth by approximately 5% by 2033.
Emerging Opportunities in B2b Business Matchmaking Platform
Emerging opportunities lie in expanding into untapped niche markets, such as specific industry verticals, integrating blockchain technology for secure data management, and enhancing platform personalization through AI-powered user profiles and preferences. The development of specialized matchmaking solutions for specific industry events and the integration of virtual reality (VR) for immersive networking experiences represent exciting growth areas.
Growth Accelerators in the B2b Business Matchmaking Platform Industry
Strategic partnerships between matchmaking platforms and industry associations or trade shows can significantly accelerate market growth. Furthermore, investments in AI and machine learning to improve matchmaking algorithms will enhance platform effectiveness and user experience. Expansion into new geographical markets and the development of mobile-first applications to increase accessibility are crucial growth drivers.
Key Players Shaping the B2b Business Matchmaking Platform Market
Notable Milestones in B2b Business Matchmaking Platform Sector
- 2020: Increased adoption of virtual matchmaking platforms due to the COVID-19 pandemic.
- 2021: Significant investment in AI-driven matchmaking technologies.
- 2022: Launch of several new platforms integrating virtual and hybrid event capabilities.
- 2023: Several M&A activities among major players.
- 2024: Increased focus on data privacy and security regulations.
In-Depth B2b Business Matchmaking Platform Market Outlook
The future of the B2B business matchmaking platform market is bright, driven by continuous technological innovation and the increasing demand for effective networking solutions. Strategic partnerships, expansion into new markets, and the ongoing development of AI-powered features will ensure sustained growth. The market is poised for further consolidation, with larger players likely acquiring smaller niche platforms. The focus on personalized experiences and seamless integrations with other business tools will continue to drive market expansion in the coming years.
B2b Business Matchmaking Platform Segmentation
-
1. Application
- 1.1. Manufacturing
- 1.2. Technology
- 1.3. Healthcare
- 1.4. Agriculture
- 1.5. Energy
- 1.6. Others
-
2. Type
- 2.1. Online Matchmaking
- 2.2. Offline Matchmaking
- 2.3. Others
B2b Business Matchmaking Platform Segmentation By Geography
-
1. North America
- 1.1. United States
- 1.2. Canada
- 1.3. Mexico
-
2. South America
- 2.1. Brazil
- 2.2. Argentina
- 2.3. Rest of South America
-
3. Europe
- 3.1. United Kingdom
- 3.2. Germany
- 3.3. France
- 3.4. Italy
- 3.5. Spain
- 3.6. Russia
- 3.7. Benelux
- 3.8. Nordics
- 3.9. Rest of Europe
-
4. Middle East & Africa
- 4.1. Turkey
- 4.2. Israel
- 4.3. GCC
- 4.4. North Africa
- 4.5. South Africa
- 4.6. Rest of Middle East & Africa
-
5. Asia Pacific
- 5.1. China
- 5.2. India
- 5.3. Japan
- 5.4. South Korea
- 5.5. ASEAN
- 5.6. Oceania
- 5.7. Rest of Asia Pacific
B2b Business Matchmaking Platform Regional Market Share
Geographic Coverage of B2b Business Matchmaking Platform
B2b Business Matchmaking Platform REPORT HIGHLIGHTS
| Aspects | Details |
|---|---|
| Study Period | 2020-2034 |
| Base Year | 2025 |
| Estimated Year | 2026 |
| Forecast Period | 2026-2034 |
| Historical Period | 2020-2025 |
| Growth Rate | CAGR of XXX% from 2020-2034 |
| Segmentation |
|
Table of Contents
- 1. Introduction
- 1.1. Research Scope
- 1.2. Market Segmentation
- 1.3. Research Methodology
- 1.4. Definitions and Assumptions
- 2. Executive Summary
- 2.1. Introduction
- 3. Market Dynamics
- 3.1. Introduction
- 3.2. Market Drivers
- 3.3. Market Restrains
- 3.4. Market Trends
- 4. Market Factor Analysis
- 4.1. Porters Five Forces
- 4.2. Supply/Value Chain
- 4.3. PESTEL analysis
- 4.4. Market Entropy
- 4.5. Patent/Trademark Analysis
- 5. Global B2b Business Matchmaking Platform Analysis, Insights and Forecast, 2020-2032
- 5.1. Market Analysis, Insights and Forecast - by Application
- 5.1.1. Manufacturing
- 5.1.2. Technology
- 5.1.3. Healthcare
- 5.1.4. Agriculture
- 5.1.5. Energy
- 5.1.6. Others
- 5.2. Market Analysis, Insights and Forecast - by Type
- 5.2.1. Online Matchmaking
- 5.2.2. Offline Matchmaking
- 5.2.3. Others
- 5.3. Market Analysis, Insights and Forecast - by Region
- 5.3.1. North America
- 5.3.2. South America
- 5.3.3. Europe
- 5.3.4. Middle East & Africa
- 5.3.5. Asia Pacific
- 5.1. Market Analysis, Insights and Forecast - by Application
- 6. North America B2b Business Matchmaking Platform Analysis, Insights and Forecast, 2020-2032
- 6.1. Market Analysis, Insights and Forecast - by Application
- 6.1.1. Manufacturing
- 6.1.2. Technology
- 6.1.3. Healthcare
- 6.1.4. Agriculture
- 6.1.5. Energy
- 6.1.6. Others
- 6.2. Market Analysis, Insights and Forecast - by Type
- 6.2.1. Online Matchmaking
- 6.2.2. Offline Matchmaking
- 6.2.3. Others
- 6.1. Market Analysis, Insights and Forecast - by Application
- 7. South America B2b Business Matchmaking Platform Analysis, Insights and Forecast, 2020-2032
- 7.1. Market Analysis, Insights and Forecast - by Application
- 7.1.1. Manufacturing
- 7.1.2. Technology
- 7.1.3. Healthcare
- 7.1.4. Agriculture
- 7.1.5. Energy
- 7.1.6. Others
- 7.2. Market Analysis, Insights and Forecast - by Type
- 7.2.1. Online Matchmaking
- 7.2.2. Offline Matchmaking
- 7.2.3. Others
- 7.1. Market Analysis, Insights and Forecast - by Application
- 8. Europe B2b Business Matchmaking Platform Analysis, Insights and Forecast, 2020-2032
- 8.1. Market Analysis, Insights and Forecast - by Application
- 8.1.1. Manufacturing
- 8.1.2. Technology
- 8.1.3. Healthcare
- 8.1.4. Agriculture
- 8.1.5. Energy
- 8.1.6. Others
- 8.2. Market Analysis, Insights and Forecast - by Type
- 8.2.1. Online Matchmaking
- 8.2.2. Offline Matchmaking
- 8.2.3. Others
- 8.1. Market Analysis, Insights and Forecast - by Application
- 9. Middle East & Africa B2b Business Matchmaking Platform Analysis, Insights and Forecast, 2020-2032
- 9.1. Market Analysis, Insights and Forecast - by Application
- 9.1.1. Manufacturing
- 9.1.2. Technology
- 9.1.3. Healthcare
- 9.1.4. Agriculture
- 9.1.5. Energy
- 9.1.6. Others
- 9.2. Market Analysis, Insights and Forecast - by Type
- 9.2.1. Online Matchmaking
- 9.2.2. Offline Matchmaking
- 9.2.3. Others
- 9.1. Market Analysis, Insights and Forecast - by Application
- 10. Asia Pacific B2b Business Matchmaking Platform Analysis, Insights and Forecast, 2020-2032
- 10.1. Market Analysis, Insights and Forecast - by Application
- 10.1.1. Manufacturing
- 10.1.2. Technology
- 10.1.3. Healthcare
- 10.1.4. Agriculture
- 10.1.5. Energy
- 10.1.6. Others
- 10.2. Market Analysis, Insights and Forecast - by Type
- 10.2.1. Online Matchmaking
- 10.2.2. Offline Matchmaking
- 10.2.3. Others
- 10.1. Market Analysis, Insights and Forecast - by Application
- 11. Competitive Analysis
- 11.1. Global Market Share Analysis 2025
- 11.2. Company Profiles
- 11.2.1 Powerlinx
- 11.2.1.1. Overview
- 11.2.1.2. Products
- 11.2.1.3. SWOT Analysis
- 11.2.1.4. Recent Developments
- 11.2.1.5. Financials (Based on Availability)
- 11.2.2 Inpart
- 11.2.2.1. Overview
- 11.2.2.2. Products
- 11.2.2.3. SWOT Analysis
- 11.2.2.4. Recent Developments
- 11.2.2.5. Financials (Based on Availability)
- 11.2.3 Eventdex
- 11.2.3.1. Overview
- 11.2.3.2. Products
- 11.2.3.3. SWOT Analysis
- 11.2.3.4. Recent Developments
- 11.2.3.5. Financials (Based on Availability)
- 11.2.4 Eventtia
- 11.2.4.1. Overview
- 11.2.4.2. Products
- 11.2.4.3. SWOT Analysis
- 11.2.4.4. Recent Developments
- 11.2.4.5. Financials (Based on Availability)
- 11.2.5 Brella
- 11.2.5.1. Overview
- 11.2.5.2. Products
- 11.2.5.3. SWOT Analysis
- 11.2.5.4. Recent Developments
- 11.2.5.5. Financials (Based on Availability)
- 11.2.6 MeetMatch
- 11.2.6.1. Overview
- 11.2.6.2. Products
- 11.2.6.3. SWOT Analysis
- 11.2.6.4. Recent Developments
- 11.2.6.5. Financials (Based on Availability)
- 11.2.7 B2match
- 11.2.7.1. Overview
- 11.2.7.2. Products
- 11.2.7.3. SWOT Analysis
- 11.2.7.4. Recent Developments
- 11.2.7.5. Financials (Based on Availability)
- 11.2.8 Aladdin
- 11.2.8.1. Overview
- 11.2.8.2. Products
- 11.2.8.3. SWOT Analysis
- 11.2.8.4. Recent Developments
- 11.2.8.5. Financials (Based on Availability)
- 11.2.9 SkaDate
- 11.2.9.1. Overview
- 11.2.9.2. Products
- 11.2.9.3. SWOT Analysis
- 11.2.9.4. Recent Developments
- 11.2.9.5. Financials (Based on Availability)
- 11.2.10 Grip
- 11.2.10.1. Overview
- 11.2.10.2. Products
- 11.2.10.3. SWOT Analysis
- 11.2.10.4. Recent Developments
- 11.2.10.5. Financials (Based on Availability)
- 11.2.11 Connect Space
- 11.2.11.1. Overview
- 11.2.11.2. Products
- 11.2.11.3. SWOT Analysis
- 11.2.11.4. Recent Developments
- 11.2.11.5. Financials (Based on Availability)
- 11.2.12 ABAMobile
- 11.2.12.1. Overview
- 11.2.12.2. Products
- 11.2.12.3. SWOT Analysis
- 11.2.12.4. Recent Developments
- 11.2.12.5. Financials (Based on Availability)
- 11.2.13 PairConnex
- 11.2.13.1. Overview
- 11.2.13.2. Products
- 11.2.13.3. SWOT Analysis
- 11.2.13.4. Recent Developments
- 11.2.13.5. Financials (Based on Availability)
- 11.2.14 BizVibe
- 11.2.14.1. Overview
- 11.2.14.2. Products
- 11.2.14.3. SWOT Analysis
- 11.2.14.4. Recent Developments
- 11.2.14.5. Financials (Based on Availability)
- 11.2.15 My Business Matches
- 11.2.15.1. Overview
- 11.2.15.2. Products
- 11.2.15.3. SWOT Analysis
- 11.2.15.4. Recent Developments
- 11.2.15.5. Financials (Based on Availability)
- 11.2.16 Meetmaps
- 11.2.16.1. Overview
- 11.2.16.2. Products
- 11.2.16.3. SWOT Analysis
- 11.2.16.4. Recent Developments
- 11.2.16.5. Financials (Based on Availability)
- 11.2.17 Aimax Provider
- 11.2.17.1. Overview
- 11.2.17.2. Products
- 11.2.17.3. SWOT Analysis
- 11.2.17.4. Recent Developments
- 11.2.17.5. Financials (Based on Availability)
- 11.2.18 Converve
- 11.2.18.1. Overview
- 11.2.18.2. Products
- 11.2.18.3. SWOT Analysis
- 11.2.18.4. Recent Developments
- 11.2.18.5. Financials (Based on Availability)
- 11.2.19 B2B/2GO
- 11.2.19.1. Overview
- 11.2.19.2. Products
- 11.2.19.3. SWOT Analysis
- 11.2.19.4. Recent Developments
- 11.2.19.5. Financials (Based on Availability)
- 11.2.20 Aeromart Toulouse
- 11.2.20.1. Overview
- 11.2.20.2. Products
- 11.2.20.3. SWOT Analysis
- 11.2.20.4. Recent Developments
- 11.2.20.5. Financials (Based on Availability)
- 11.2.21 Innovation Match
- 11.2.21.1. Overview
- 11.2.21.2. Products
- 11.2.21.3. SWOT Analysis
- 11.2.21.4. Recent Developments
- 11.2.21.5. Financials (Based on Availability)
- 11.2.22 Happenn
- 11.2.22.1. Overview
- 11.2.22.2. Products
- 11.2.22.3. SWOT Analysis
- 11.2.22.4. Recent Developments
- 11.2.22.5. Financials (Based on Availability)
- 11.2.23 Appsaya
- 11.2.23.1. Overview
- 11.2.23.2. Products
- 11.2.23.3. SWOT Analysis
- 11.2.23.4. Recent Developments
- 11.2.23.5. Financials (Based on Availability)
- 11.2.1 Powerlinx
List of Figures
- Figure 1: Global B2b Business Matchmaking Platform Revenue Breakdown (million, %) by Region 2025 & 2033
- Figure 2: North America B2b Business Matchmaking Platform Revenue (million), by Application 2025 & 2033
- Figure 3: North America B2b Business Matchmaking Platform Revenue Share (%), by Application 2025 & 2033
- Figure 4: North America B2b Business Matchmaking Platform Revenue (million), by Type 2025 & 2033
- Figure 5: North America B2b Business Matchmaking Platform Revenue Share (%), by Type 2025 & 2033
- Figure 6: North America B2b Business Matchmaking Platform Revenue (million), by Country 2025 & 2033
- Figure 7: North America B2b Business Matchmaking Platform Revenue Share (%), by Country 2025 & 2033
- Figure 8: South America B2b Business Matchmaking Platform Revenue (million), by Application 2025 & 2033
- Figure 9: South America B2b Business Matchmaking Platform Revenue Share (%), by Application 2025 & 2033
- Figure 10: South America B2b Business Matchmaking Platform Revenue (million), by Type 2025 & 2033
- Figure 11: South America B2b Business Matchmaking Platform Revenue Share (%), by Type 2025 & 2033
- Figure 12: South America B2b Business Matchmaking Platform Revenue (million), by Country 2025 & 2033
- Figure 13: South America B2b Business Matchmaking Platform Revenue Share (%), by Country 2025 & 2033
- Figure 14: Europe B2b Business Matchmaking Platform Revenue (million), by Application 2025 & 2033
- Figure 15: Europe B2b Business Matchmaking Platform Revenue Share (%), by Application 2025 & 2033
- Figure 16: Europe B2b Business Matchmaking Platform Revenue (million), by Type 2025 & 2033
- Figure 17: Europe B2b Business Matchmaking Platform Revenue Share (%), by Type 2025 & 2033
- Figure 18: Europe B2b Business Matchmaking Platform Revenue (million), by Country 2025 & 2033
- Figure 19: Europe B2b Business Matchmaking Platform Revenue Share (%), by Country 2025 & 2033
- Figure 20: Middle East & Africa B2b Business Matchmaking Platform Revenue (million), by Application 2025 & 2033
- Figure 21: Middle East & Africa B2b Business Matchmaking Platform Revenue Share (%), by Application 2025 & 2033
- Figure 22: Middle East & Africa B2b Business Matchmaking Platform Revenue (million), by Type 2025 & 2033
- Figure 23: Middle East & Africa B2b Business Matchmaking Platform Revenue Share (%), by Type 2025 & 2033
- Figure 24: Middle East & Africa B2b Business Matchmaking Platform Revenue (million), by Country 2025 & 2033
- Figure 25: Middle East & Africa B2b Business Matchmaking Platform Revenue Share (%), by Country 2025 & 2033
- Figure 26: Asia Pacific B2b Business Matchmaking Platform Revenue (million), by Application 2025 & 2033
- Figure 27: Asia Pacific B2b Business Matchmaking Platform Revenue Share (%), by Application 2025 & 2033
- Figure 28: Asia Pacific B2b Business Matchmaking Platform Revenue (million), by Type 2025 & 2033
- Figure 29: Asia Pacific B2b Business Matchmaking Platform Revenue Share (%), by Type 2025 & 2033
- Figure 30: Asia Pacific B2b Business Matchmaking Platform Revenue (million), by Country 2025 & 2033
- Figure 31: Asia Pacific B2b Business Matchmaking Platform Revenue Share (%), by Country 2025 & 2033
List of Tables
- Table 1: Global B2b Business Matchmaking Platform Revenue million Forecast, by Application 2020 & 2033
- Table 2: Global B2b Business Matchmaking Platform Revenue million Forecast, by Type 2020 & 2033
- Table 3: Global B2b Business Matchmaking Platform Revenue million Forecast, by Region 2020 & 2033
- Table 4: Global B2b Business Matchmaking Platform Revenue million Forecast, by Application 2020 & 2033
- Table 5: Global B2b Business Matchmaking Platform Revenue million Forecast, by Type 2020 & 2033
- Table 6: Global B2b Business Matchmaking Platform Revenue million Forecast, by Country 2020 & 2033
- Table 7: United States B2b Business Matchmaking Platform Revenue (million) Forecast, by Application 2020 & 2033
- Table 8: Canada B2b Business Matchmaking Platform Revenue (million) Forecast, by Application 2020 & 2033
- Table 9: Mexico B2b Business Matchmaking Platform Revenue (million) Forecast, by Application 2020 & 2033
- Table 10: Global B2b Business Matchmaking Platform Revenue million Forecast, by Application 2020 & 2033
- Table 11: Global B2b Business Matchmaking Platform Revenue million Forecast, by Type 2020 & 2033
- Table 12: Global B2b Business Matchmaking Platform Revenue million Forecast, by Country 2020 & 2033
- Table 13: Brazil B2b Business Matchmaking Platform Revenue (million) Forecast, by Application 2020 & 2033
- Table 14: Argentina B2b Business Matchmaking Platform Revenue (million) Forecast, by Application 2020 & 2033
- Table 15: Rest of South America B2b Business Matchmaking Platform Revenue (million) Forecast, by Application 2020 & 2033
- Table 16: Global B2b Business Matchmaking Platform Revenue million Forecast, by Application 2020 & 2033
- Table 17: Global B2b Business Matchmaking Platform Revenue million Forecast, by Type 2020 & 2033
- Table 18: Global B2b Business Matchmaking Platform Revenue million Forecast, by Country 2020 & 2033
- Table 19: United Kingdom B2b Business Matchmaking Platform Revenue (million) Forecast, by Application 2020 & 2033
- Table 20: Germany B2b Business Matchmaking Platform Revenue (million) Forecast, by Application 2020 & 2033
- Table 21: France B2b Business Matchmaking Platform Revenue (million) Forecast, by Application 2020 & 2033
- Table 22: Italy B2b Business Matchmaking Platform Revenue (million) Forecast, by Application 2020 & 2033
- Table 23: Spain B2b Business Matchmaking Platform Revenue (million) Forecast, by Application 2020 & 2033
- Table 24: Russia B2b Business Matchmaking Platform Revenue (million) Forecast, by Application 2020 & 2033
- Table 25: Benelux B2b Business Matchmaking Platform Revenue (million) Forecast, by Application 2020 & 2033
- Table 26: Nordics B2b Business Matchmaking Platform Revenue (million) Forecast, by Application 2020 & 2033
- Table 27: Rest of Europe B2b Business Matchmaking Platform Revenue (million) Forecast, by Application 2020 & 2033
- Table 28: Global B2b Business Matchmaking Platform Revenue million Forecast, by Application 2020 & 2033
- Table 29: Global B2b Business Matchmaking Platform Revenue million Forecast, by Type 2020 & 2033
- Table 30: Global B2b Business Matchmaking Platform Revenue million Forecast, by Country 2020 & 2033
- Table 31: Turkey B2b Business Matchmaking Platform Revenue (million) Forecast, by Application 2020 & 2033
- Table 32: Israel B2b Business Matchmaking Platform Revenue (million) Forecast, by Application 2020 & 2033
- Table 33: GCC B2b Business Matchmaking Platform Revenue (million) Forecast, by Application 2020 & 2033
- Table 34: North Africa B2b Business Matchmaking Platform Revenue (million) Forecast, by Application 2020 & 2033
- Table 35: South Africa B2b Business Matchmaking Platform Revenue (million) Forecast, by Application 2020 & 2033
- Table 36: Rest of Middle East & Africa B2b Business Matchmaking Platform Revenue (million) Forecast, by Application 2020 & 2033
- Table 37: Global B2b Business Matchmaking Platform Revenue million Forecast, by Application 2020 & 2033
- Table 38: Global B2b Business Matchmaking Platform Revenue million Forecast, by Type 2020 & 2033
- Table 39: Global B2b Business Matchmaking Platform Revenue million Forecast, by Country 2020 & 2033
- Table 40: China B2b Business Matchmaking Platform Revenue (million) Forecast, by Application 2020 & 2033
- Table 41: India B2b Business Matchmaking Platform Revenue (million) Forecast, by Application 2020 & 2033
- Table 42: Japan B2b Business Matchmaking Platform Revenue (million) Forecast, by Application 2020 & 2033
- Table 43: South Korea B2b Business Matchmaking Platform Revenue (million) Forecast, by Application 2020 & 2033
- Table 44: ASEAN B2b Business Matchmaking Platform Revenue (million) Forecast, by Application 2020 & 2033
- Table 45: Oceania B2b Business Matchmaking Platform Revenue (million) Forecast, by Application 2020 & 2033
- Table 46: Rest of Asia Pacific B2b Business Matchmaking Platform Revenue (million) Forecast, by Application 2020 & 2033
Frequently Asked Questions
1. What is the projected Compound Annual Growth Rate (CAGR) of the B2b Business Matchmaking Platform?
The projected CAGR is approximately XXX%.
2. Which companies are prominent players in the B2b Business Matchmaking Platform?
Key companies in the market include Powerlinx, Inpart, Eventdex, Eventtia, Brella, MeetMatch, B2match, Aladdin, SkaDate, Grip, Connect Space, ABAMobile, PairConnex, BizVibe, My Business Matches, Meetmaps, Aimax Provider, Converve, B2B/2GO, Aeromart Toulouse, Innovation Match, Happenn, Appsaya.
3. What are the main segments of the B2b Business Matchmaking Platform?
The market segments include Application, Type.
4. Can you provide details about the market size?
The market size is estimated to be USD XXX million as of 2022.
5. What are some drivers contributing to market growth?
N/A
6. What are the notable trends driving market growth?
N/A
7. Are there any restraints impacting market growth?
N/A
8. Can you provide examples of recent developments in the market?
N/A
9. What pricing options are available for accessing the report?
Pricing options include single-user, multi-user, and enterprise licenses priced at USD 3950.00, USD 5925.00, and USD 7900.00 respectively.
10. Is the market size provided in terms of value or volume?
The market size is provided in terms of value, measured in million.
11. Are there any specific market keywords associated with the report?
Yes, the market keyword associated with the report is "B2b Business Matchmaking Platform," which aids in identifying and referencing the specific market segment covered.
12. How do I determine which pricing option suits my needs best?
The pricing options vary based on user requirements and access needs. Individual users may opt for single-user licenses, while businesses requiring broader access may choose multi-user or enterprise licenses for cost-effective access to the report.
13. Are there any additional resources or data provided in the B2b Business Matchmaking Platform report?
While the report offers comprehensive insights, it's advisable to review the specific contents or supplementary materials provided to ascertain if additional resources or data are available.
14. How can I stay updated on further developments or reports in the B2b Business Matchmaking Platform?
To stay informed about further developments, trends, and reports in the B2b Business Matchmaking Platform, consider subscribing to industry newsletters, following relevant companies and organizations, or regularly checking reputable industry news sources and publications.
Methodology
Step 1 - Identification of Relevant Samples Size from Population Database


Step 2 - Approaches for Defining Global Market Size (Value, Volume* & Price*)

Note*: In applicable scenarios
Step 3 - Data Sources
Primary Research
- Web Analytics
- Survey Reports
- Research Institute
- Latest Research Reports
- Opinion Leaders
Secondary Research
- Annual Reports
- White Paper
- Latest Press Release
- Industry Association
- Paid Database
- Investor Presentations

Step 4 - Data Triangulation
Involves using different sources of information in order to increase the validity of a study
These sources are likely to be stakeholders in a program - participants, other researchers, program staff, other community members, and so on.
Then we put all data in single framework & apply various statistical tools to find out the dynamic on the market.
During the analysis stage, feedback from the stakeholder groups would be compared to determine areas of agreement as well as areas of divergence