

Key Insights
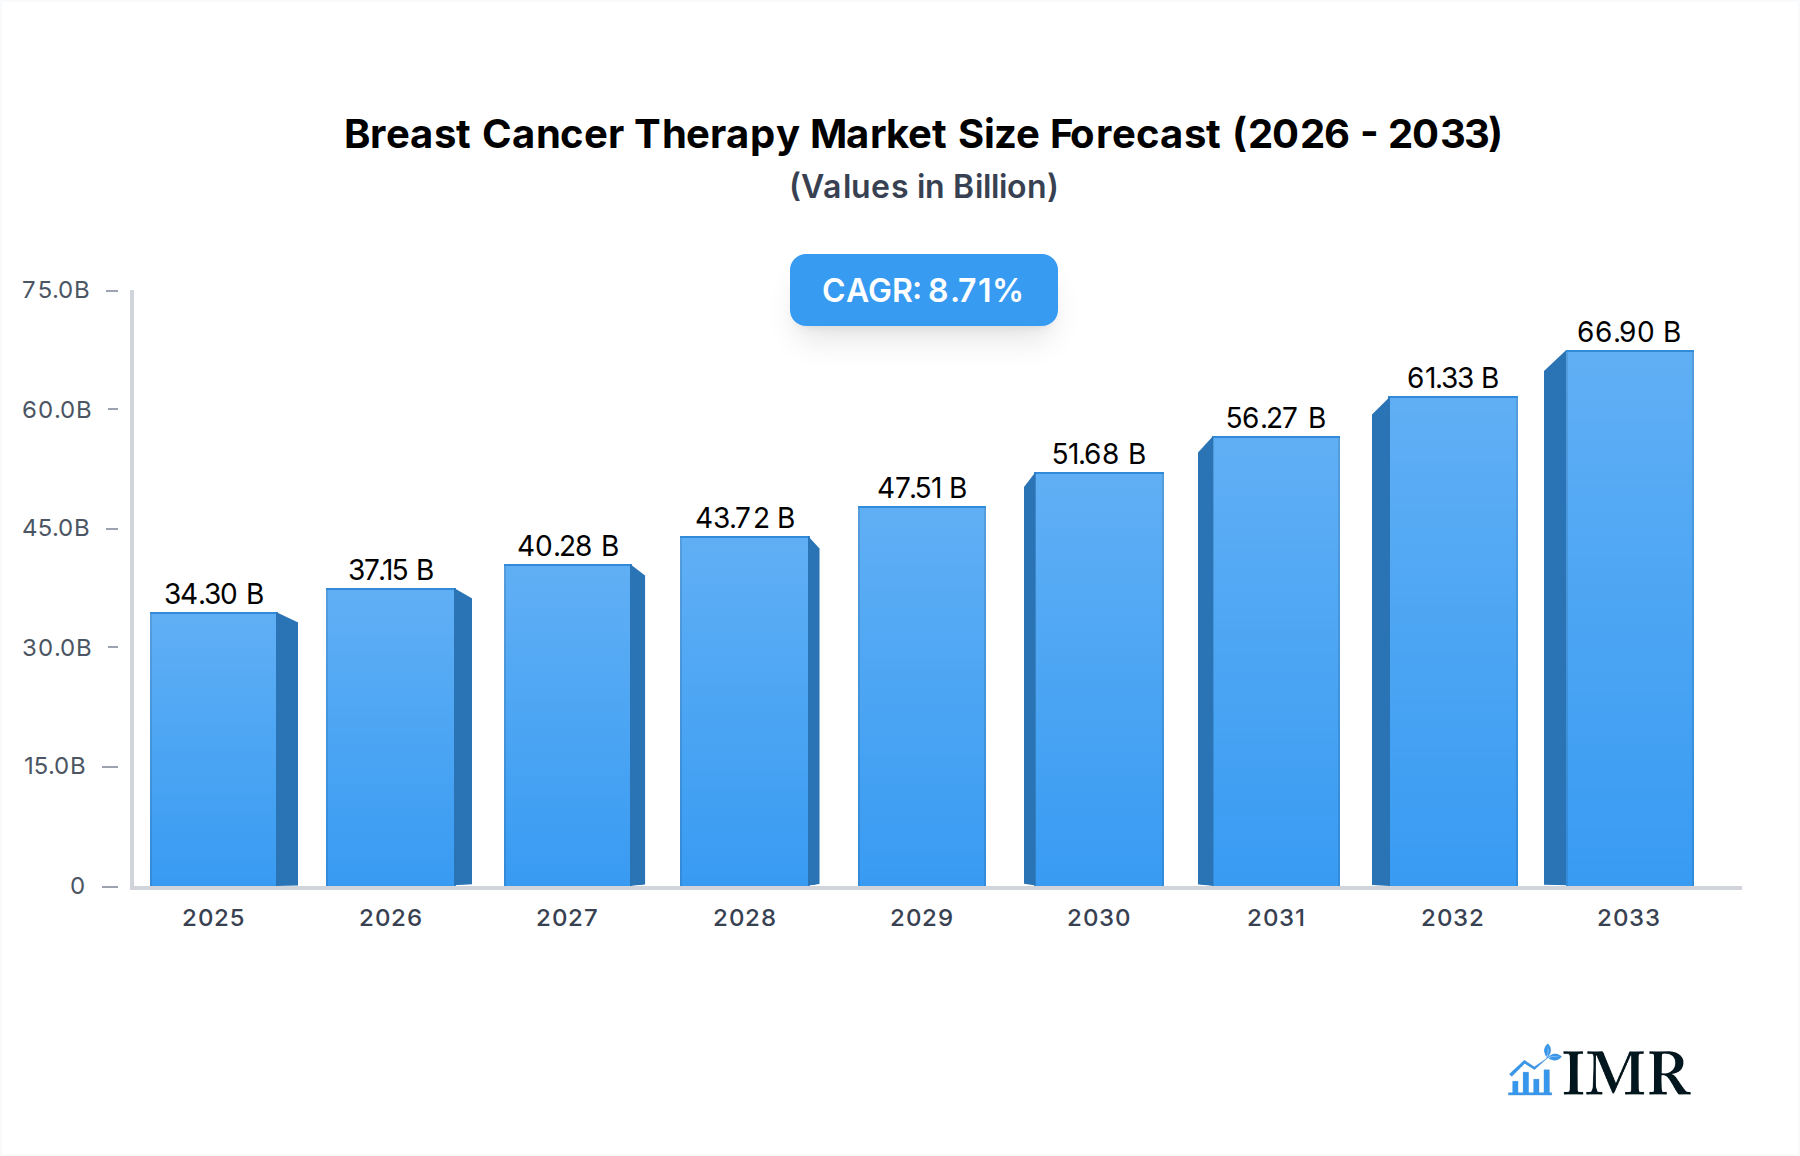
The global Breast Cancer Therapy Market is poised for significant expansion, projected to reach $34.3 billion in 2025, with a robust Compound Annual Growth Rate (CAGR) of 8.5% anticipated through 2033. This upward trajectory is primarily propelled by advancements in targeted therapies and immunotherapy, offering more personalized and effective treatment options. Increased global awareness surrounding breast cancer, coupled with early detection initiatives and improved diagnostic tools, is also fueling market growth. Furthermore, a growing pipeline of novel drug candidates and a strong emphasis on research and development by leading pharmaceutical companies are contributing to the market's dynamism. The rising incidence of breast cancer worldwide, particularly in aging populations and developing economies, further underscores the increasing demand for advanced therapeutic solutions.

Breast Cancer Therapy Market Market Size (In Billion)
Despite the optimistic outlook, certain factors could temper the market's full potential. The high cost associated with advanced breast cancer therapies, including targeted agents and biologics, poses a significant restraint, potentially limiting access for a considerable patient population, especially in resource-constrained regions. Stringent regulatory approvals for new drugs and the potential for side effects associated with some treatment modalities also present challenges. However, ongoing efforts to develop more cost-effective treatments and the expansion of healthcare infrastructure in emerging markets are expected to mitigate these restraints. The market is segmented across various therapy types, including radiation therapy, targeted therapy, hormonal therapy, and chemotherapy, with targeted therapies demonstrating particularly strong growth potential due to their precision and efficacy. Geographically, North America and Europe are expected to remain dominant markets, while the Asia Pacific region is anticipated to exhibit the fastest growth rate due to increasing healthcare expenditure and a growing patient base.
Breast Cancer Therapy Market Company Market Share
Report Description: Breast Cancer Therapy Market - Global Forecast to 2033
This comprehensive report offers an in-depth analysis of the global Breast Cancer Therapy market, projected to reach an estimated $XX billion by 2025 and forecast to grow at a robust CAGR of XX% during the forecast period of 2025–2033. The study meticulously examines historical data from 2019–2024, providing a detailed market outlook for the coming decade. We delve into the intricate dynamics of this vital sector, covering parent and child markets, offering unparalleled insights for industry stakeholders. The report is meticulously structured with high-traffic keywords integrated throughout to maximize SEO visibility and engage industry professionals seeking actionable intelligence on breast cancer treatment advancements.
Breast Cancer Therapy Market Market Dynamics & Structure
The breast cancer therapy market is characterized by a dynamic interplay of technological innovation, stringent regulatory oversight, and evolving end-user demographics. Market concentration remains moderate, with key players constantly vying for dominance through research and development of novel therapeutic agents. Technological innovation is a primary driver, fueled by advancements in precision medicine and a deeper understanding of cancer biology. Regulatory frameworks, established by bodies like the FDA and EMA, play a crucial role in approving new treatments and ensuring patient safety, albeit sometimes posing barriers to rapid market entry. Competitive product substitutes are abundant, with a continuous stream of new chemotherapies, targeted therapies, hormonal therapies, and radiation therapy techniques emerging. End-user demographics, including an aging global population and increasing cancer incidence rates, are expanding the patient pool. Mergers and acquisitions (M&A) trends are also shaping the landscape, with larger pharmaceutical companies acquiring smaller biotechs to bolster their product pipelines.
- Market Concentration: Moderate, with a mix of large multinational corporations and specialized biopharmaceutical companies.
- Technological Innovation Drivers: Genomics, proteomics, AI-driven drug discovery, liquid biopsies, and immunotherapy.
- Regulatory Frameworks: FDA, EMA, and other national health authorities significantly influence drug approval timelines and market access.
- Competitive Product Substitutes: Constant innovation across chemotherapy, targeted therapy, hormonal therapy, and radiation therapy segments.
- End-User Demographics: Aging population, increasing incidence rates, and growing awareness of early detection.
- M&A Trends: Strategic acquisitions to enhance R&D capabilities and expand market reach.
Breast Cancer Therapy Market Growth Trends & Insights
The breast cancer therapy market has witnessed a significant evolution, driven by a confluence of groundbreaking scientific discoveries and a growing global demand for effective treatment options. The market size has steadily expanded, propelled by increasing cancer incidence rates, particularly in emerging economies, and an aging global population that is more susceptible to the disease. Adoption rates of novel therapies, such as targeted agents and immunotherapies, are on an upward trajectory as clinical trials demonstrate superior efficacy and improved patient outcomes compared to traditional chemotherapy. Technological disruptions, including the advent of precision medicine, genetic profiling of tumors, and the development of sophisticated drug delivery systems, are fundamentally reshaping treatment paradigms. Consumer behavior shifts are also playing a crucial role, with patients becoming more informed and actively involved in treatment decisions, demanding personalized and less toxic therapeutic approaches. The market penetration of advanced therapies is expected to continue its upward climb, further contributing to market growth. The CAGR for the breast cancer therapy market is estimated to be around XX% during the forecast period, reflecting sustained and robust expansion.
Dominant Regions, Countries, or Segments in Breast Cancer Therapy Market
North America, particularly the United States, currently dominates the global breast cancer therapy market, driven by advanced healthcare infrastructure, high R&D expenditure, and a favorable regulatory environment that facilitates rapid approval of innovative treatments. The region benefits from a high prevalence of breast cancer and a proactive approach to early detection and screening programs. The presence of leading pharmaceutical companies and research institutions further solidifies its leadership.
Within the Therapy segment, Targeted Therapy has emerged as a dominant force, experiencing significant growth due to its ability to target specific molecular pathways involved in cancer cell growth and proliferation, minimizing damage to healthy cells.
- Targeted Therapy (Herceptin, Tykerb (Lapatinib), Afinitor, Other Targeted Therapies): This segment is a key growth driver, with substantial market share.
- Herceptin (Trastuzumab): Continues to be a cornerstone treatment for HER2-positive breast cancer, demonstrating impressive survival benefits.
- Tykerb (Lapatinib): Offers an alternative for HER2-positive patients, particularly in combination therapies.
- Afinitor (Everolimus): Widely used for hormone receptor-positive, HER2-negative advanced breast cancer in postmenopausal women.
- Other Targeted Therapies: The pipeline is rich with novel agents targeting various genetic mutations and signaling pathways.
- Hormonal Therapy (Selective Estrogen - Receptor Modulators, Aromatase Inhibitors, Other Hormonal Therapies): This segment remains crucial, especially for hormone receptor-positive breast cancers, and is expected to maintain a significant market share.
- Aromatase Inhibitors: Widely prescribed for postmenopausal women.
- Selective Estrogen Receptor Modulators (SERMs): Essential for premenopausal women.
- Chemotherapy (Taxanes, Anthracyclines, Anti-metabolites, Alkylating Agents, Epothilones): While traditional chemotherapy remains a vital component of treatment, its market share is gradually being influenced by the rise of targeted therapies and immunotherapies, though it is still a significant segment.
- Taxanes and Anthracyclines: Form the backbone of many chemotherapy regimens.
- Anti-metabolites and Alkylating Agents: Continue to play important roles in various treatment protocols.
- Radiation Therapy: Remains a critical pillar in breast cancer management, particularly for early-stage disease and as an adjuvant treatment, maintaining a stable and substantial market presence.
The Asia-Pacific region is emerging as a significant growth market, driven by increasing healthcare investments, rising cancer awareness, and a growing middle class with improved access to advanced medical treatments.
Breast Cancer Therapy Market Product Landscape
The breast cancer therapy product landscape is characterized by rapid innovation, focusing on enhancing efficacy, reducing toxicity, and improving patient quality of life. Key advancements include the development of antibody-drug conjugates (ADCs) like Enhertu, which combine targeted delivery with potent cytotoxic agents, and novel small molecule inhibitors that address specific resistance mechanisms. The introduction of personalized medicine approaches, guided by genomic profiling, is enabling the selection of therapies tailored to individual tumor characteristics, leading to improved outcomes. The focus is increasingly on therapies that offer sustained responses with fewer side effects, such as oral targeted agents and refined hormonal therapies.
Key Drivers, Barriers & Challenges in Breast Cancer Therapy Market
Key Drivers: The breast cancer therapy market is propelled by several potent drivers. Rising global cancer incidence rates, particularly in aging populations, create an ever-expanding patient base. Significant advancements in genomic sequencing and molecular diagnostics enable a more precise understanding of tumor biology, paving the way for personalized medicine. The continuous innovation in drug discovery and development, leading to novel targeted therapies, immunotherapies, and ADCs, offers improved efficacy and reduced side effects. Supportive government initiatives, increased healthcare spending, and growing awareness campaigns further fuel market growth.
Barriers & Challenges: Despite the growth, the market faces considerable challenges. The high cost of novel cancer therapies often limits accessibility, especially in low- and middle-income countries, leading to disparities in treatment. Stringent regulatory approval processes, while essential for safety, can prolong the time to market for new drugs. The emergence of drug resistance remains a persistent hurdle, necessitating ongoing research into combination therapies and next-generation treatments. Complex supply chain logistics for specialized biologics and a shortage of skilled healthcare professionals in certain regions also pose challenges.
Emerging Opportunities in Breast Cancer Therapy Market
Emerging opportunities in the breast cancer therapy market are diverse and promising. The growing focus on treating HER2-low breast cancer, as highlighted by recent FDA approvals, represents a significant untapped market. Advances in liquid biopsy technology offer potential for non-invasive monitoring of treatment response and early detection of recurrence. The development of novel immunotherapies and combination strategies that harness the power of the immune system to fight cancer presents a vast frontier for innovation. Furthermore, the increasing demand for oral therapies and patient-centric treatment models presents opportunities for companies to develop more convenient and accessible treatment options.
Growth Accelerators in the Breast Cancer Therapy Market Industry
Several catalysts are accelerating the growth of the breast cancer therapy market. Breakthroughs in understanding tumor microenvironments are leading to the development of novel agents that can modulate these complex cellular landscapes. Strategic partnerships and collaborations between pharmaceutical giants, academic institutions, and biotech startups are fostering a more rapid pace of innovation. Market expansion into emerging economies, driven by improving healthcare infrastructure and rising disposable incomes, offers substantial growth potential. The increasing adoption of real-world evidence (RWE) in clinical trial design and regulatory submissions is also streamlining the approval process for effective treatments.
Key Players Shaping the Breast Cancer Therapy Market Market
- Baxter Healthcare Corporation
- Novartis AG
- Genentech
- Hikma Pharmaceuticals
- AstraZeneca PLC
- FRESENIUS KABI
- Eli Lilly and Company
- Celltrion Healthcare
- Teva Pharmaceutical Industries Ltd
- Viatris Inc
- Halozyme Inc
- Eisai Co Ltd
- Bristol-Myers Squibb Company
- GlaxoSmithKline PLC
- Pfizer Inc
Notable Milestones in Breast Cancer Therapy Market Sector
- September 2022: Novartis announced results from a new pooled exploratory analysis across the entire MONALEESA Phase III program, confirming nearly one year of additional overall survival (OS) benefit in a subgroup of patients with aggressive forms of hormone receptor-positive, human epidermal growth factor receptor-2 negative (HR+/HER2-) advanced breast cancer (aBC).
- August 2022: The United States Food and Drug Administration approved Enhertu (fam-trastuzumab-deruxtecan-nxki), an IV infusion for the treatment of patients with unresectable (unable to be removed) or metastatic (spread to other parts of the body) HER2-low breast cancer. This is one of the first approved therapies targeted to patients with the HER2-low breast cancer subtype, which is a newly defined subset of HER2-negative breast cancer.
In-Depth Breast Cancer Therapy Market Market Outlook
The in-depth market outlook for breast cancer therapy points towards sustained and robust growth driven by relentless innovation and an expanding global patient population. The strategic focus on precision medicine, coupled with the continuous development of novel targeted agents and immunotherapies, will redefine treatment paradigms. Emerging opportunities in previously underserved patient populations, such as those with HER2-low breast cancer, and the integration of advanced diagnostic tools like liquid biopsies, will unlock new revenue streams. The market is poised for significant transformation, offering substantial potential for companies that can navigate the complexities of drug development, regulatory approvals, and market access, ultimately aiming to improve patient outcomes and quality of life in the fight against breast cancer.
Breast Cancer Therapy Market Segmentation
-
1. Therapy
- 1.1. Radiation Therapy
-
1.2. Targeted Therapy
- 1.2.1. Herceptin
- 1.2.2. Tykerb (Lapatinib)
- 1.2.3. Afinitor
- 1.2.4. Other Targeted Therapies
-
1.3. Hormonal Therapy
- 1.3.1. Selective Estrogen - Receptor Modulators
- 1.3.2. Aromatase Inhibitors
- 1.3.3. Other Hormonal Therapies
-
1.4. Chemotherapy
- 1.4.1. Taxanes
- 1.4.2. Anthracyclines
- 1.4.3. Anti-metabolites
- 1.4.4. Alkylating Agents
- 1.4.5. Epothilones
Breast Cancer Therapy Market Segmentation By Geography
-
1. North America
- 1.1. United States
- 1.2. Canada
- 1.3. Mexico
-
2. Europe
- 2.1. Germany
- 2.2. United Kingdom
- 2.3. France
- 2.4. Italy
- 2.5. Spain
- 2.6. Rest of Europe
-
3. Asia Pacific
- 3.1. China
- 3.2. Japan
- 3.3. India
- 3.4. Australia
- 3.5. South Korea
- 3.6. Rest of Asia Pacific
-
4. Middle East and Africa
- 4.1. GCC
- 4.2. South Africa
- 4.3. Rest of Middle East and Africa
-
5. South America
- 5.1. Brazil
- 5.2. Argentina
- 5.3. Rest of South America

Breast Cancer Therapy Market Regional Market Share
Geographic Coverage of Breast Cancer Therapy Market
Breast Cancer Therapy Market REPORT HIGHLIGHTS
| Aspects | Details |
|---|---|
| Study Period | 2020-2034 |
| Base Year | 2025 |
| Estimated Year | 2026 |
| Forecast Period | 2026-2034 |
| Historical Period | 2020-2025 |
| Growth Rate | CAGR of 8.5% from 2020-2034 |
| Segmentation |
|
Table of Contents
- 1. Introduction
- 1.1. Research Scope
- 1.2. Market Segmentation
- 1.3. Research Objective
- 1.4. Definitions and Assumptions
- 2. Executive Summary
- 2.1. Market Snapshot
- 3. Market Dynamics
- 3.1. Market Drivers
- 3.2. Market Restrains
- 3.3. Market Trends
- 3.4. Market Opportunities
- 4. Market Factor Analysis
- 4.1. Porters Five Forces
- 4.1.1. Bargaining Power of Suppliers
- 4.1.2. Bargaining Power of Buyers
- 4.1.3. Threat of New Entrants
- 4.1.4. Threat of Substitutes
- 4.1.5. Competitive Rivalry
- 4.2. PESTEL analysis
- 4.3. BCG Analysis
- 4.3.1. Stars (High Growth, High Market Share)
- 4.3.2. Cash Cows (Low Growth, High Market Share)
- 4.3.3. Question Mark (High Growth, Low Market Share)
- 4.3.4. Dogs (Low Growth, Low Market Share)
- 4.4. Ansoff Matrix Analysis
- 4.5. Supply Chain Analysis
- 4.6. Regulatory Landscape
- 4.7. Current Market Potential and Opportunity Assessment (TAM–SAM–SOM Framework)
- 4.8. IMR Analyst Note
- 4.1. Porters Five Forces
- 5. Market Analysis, Insights and Forecast 2021-2033
- 5.1. Market Analysis, Insights and Forecast - by Therapy
- 5.1.1. Radiation Therapy
- 5.1.2. Targeted Therapy
- 5.1.2.1. Herceptin
- 5.1.2.2. Tykerb (Lapatinib)
- 5.1.2.3. Afinitor
- 5.1.2.4. Other Targeted Therapies
- 5.1.3. Hormonal Therapy
- 5.1.3.1. Selective Estrogen - Receptor Modulators
- 5.1.3.2. Aromatase Inhibitors
- 5.1.3.3. Other Hormonal Therapies
- 5.1.4. Chemotherapy
- 5.1.4.1. Taxanes
- 5.1.4.2. Anthracyclines
- 5.1.4.3. Anti-metabolites
- 5.1.4.4. Alkylating Agents
- 5.1.4.5. Epothilones
- 5.2. Market Analysis, Insights and Forecast - by Region
- 5.2.1. North America
- 5.2.2. Europe
- 5.2.3. Asia Pacific
- 5.2.4. Middle East and Africa
- 5.2.5. South America
- 5.1. Market Analysis, Insights and Forecast - by Therapy
- 6. Global Breast Cancer Therapy Market Analysis, Insights and Forecast, 2021-2033
- 6.1. Market Analysis, Insights and Forecast - by Therapy
- 6.1.1. Radiation Therapy
- 6.1.2. Targeted Therapy
- 6.1.2.1. Herceptin
- 6.1.2.2. Tykerb (Lapatinib)
- 6.1.2.3. Afinitor
- 6.1.2.4. Other Targeted Therapies
- 6.1.3. Hormonal Therapy
- 6.1.3.1. Selective Estrogen - Receptor Modulators
- 6.1.3.2. Aromatase Inhibitors
- 6.1.3.3. Other Hormonal Therapies
- 6.1.4. Chemotherapy
- 6.1.4.1. Taxanes
- 6.1.4.2. Anthracyclines
- 6.1.4.3. Anti-metabolites
- 6.1.4.4. Alkylating Agents
- 6.1.4.5. Epothilones
- 6.1. Market Analysis, Insights and Forecast - by Therapy
- 7. North America Breast Cancer Therapy Market Analysis, Insights and Forecast, 2020-2032
- 7.1. Market Analysis, Insights and Forecast - by Therapy
- 7.1.1. Radiation Therapy
- 7.1.2. Targeted Therapy
- 7.1.2.1. Herceptin
- 7.1.2.2. Tykerb (Lapatinib)
- 7.1.2.3. Afinitor
- 7.1.2.4. Other Targeted Therapies
- 7.1.3. Hormonal Therapy
- 7.1.3.1. Selective Estrogen - Receptor Modulators
- 7.1.3.2. Aromatase Inhibitors
- 7.1.3.3. Other Hormonal Therapies
- 7.1.4. Chemotherapy
- 7.1.4.1. Taxanes
- 7.1.4.2. Anthracyclines
- 7.1.4.3. Anti-metabolites
- 7.1.4.4. Alkylating Agents
- 7.1.4.5. Epothilones
- 7.1. Market Analysis, Insights and Forecast - by Therapy
- 8. Europe Breast Cancer Therapy Market Analysis, Insights and Forecast, 2020-2032
- 8.1. Market Analysis, Insights and Forecast - by Therapy
- 8.1.1. Radiation Therapy
- 8.1.2. Targeted Therapy
- 8.1.2.1. Herceptin
- 8.1.2.2. Tykerb (Lapatinib)
- 8.1.2.3. Afinitor
- 8.1.2.4. Other Targeted Therapies
- 8.1.3. Hormonal Therapy
- 8.1.3.1. Selective Estrogen - Receptor Modulators
- 8.1.3.2. Aromatase Inhibitors
- 8.1.3.3. Other Hormonal Therapies
- 8.1.4. Chemotherapy
- 8.1.4.1. Taxanes
- 8.1.4.2. Anthracyclines
- 8.1.4.3. Anti-metabolites
- 8.1.4.4. Alkylating Agents
- 8.1.4.5. Epothilones
- 8.1. Market Analysis, Insights and Forecast - by Therapy
- 9. Asia Pacific Breast Cancer Therapy Market Analysis, Insights and Forecast, 2020-2032
- 9.1. Market Analysis, Insights and Forecast - by Therapy
- 9.1.1. Radiation Therapy
- 9.1.2. Targeted Therapy
- 9.1.2.1. Herceptin
- 9.1.2.2. Tykerb (Lapatinib)
- 9.1.2.3. Afinitor
- 9.1.2.4. Other Targeted Therapies
- 9.1.3. Hormonal Therapy
- 9.1.3.1. Selective Estrogen - Receptor Modulators
- 9.1.3.2. Aromatase Inhibitors
- 9.1.3.3. Other Hormonal Therapies
- 9.1.4. Chemotherapy
- 9.1.4.1. Taxanes
- 9.1.4.2. Anthracyclines
- 9.1.4.3. Anti-metabolites
- 9.1.4.4. Alkylating Agents
- 9.1.4.5. Epothilones
- 9.1. Market Analysis, Insights and Forecast - by Therapy
- 10. Middle East and Africa Breast Cancer Therapy Market Analysis, Insights and Forecast, 2020-2032
- 10.1. Market Analysis, Insights and Forecast - by Therapy
- 10.1.1. Radiation Therapy
- 10.1.2. Targeted Therapy
- 10.1.2.1. Herceptin
- 10.1.2.2. Tykerb (Lapatinib)
- 10.1.2.3. Afinitor
- 10.1.2.4. Other Targeted Therapies
- 10.1.3. Hormonal Therapy
- 10.1.3.1. Selective Estrogen - Receptor Modulators
- 10.1.3.2. Aromatase Inhibitors
- 10.1.3.3. Other Hormonal Therapies
- 10.1.4. Chemotherapy
- 10.1.4.1. Taxanes
- 10.1.4.2. Anthracyclines
- 10.1.4.3. Anti-metabolites
- 10.1.4.4. Alkylating Agents
- 10.1.4.5. Epothilones
- 10.1. Market Analysis, Insights and Forecast - by Therapy
- 11. South America Breast Cancer Therapy Market Analysis, Insights and Forecast, 2020-2032
- 11.1. Market Analysis, Insights and Forecast - by Therapy
- 11.1.1. Radiation Therapy
- 11.1.2. Targeted Therapy
- 11.1.2.1. Herceptin
- 11.1.2.2. Tykerb (Lapatinib)
- 11.1.2.3. Afinitor
- 11.1.2.4. Other Targeted Therapies
- 11.1.3. Hormonal Therapy
- 11.1.3.1. Selective Estrogen - Receptor Modulators
- 11.1.3.2. Aromatase Inhibitors
- 11.1.3.3. Other Hormonal Therapies
- 11.1.4. Chemotherapy
- 11.1.4.1. Taxanes
- 11.1.4.2. Anthracyclines
- 11.1.4.3. Anti-metabolites
- 11.1.4.4. Alkylating Agents
- 11.1.4.5. Epothilones
- 11.1. Market Analysis, Insights and Forecast - by Therapy
- 12. Competitive Analysis
- 12.1. Company Profiles
- 12.1.1 Baxter Healthcare Corporation
- 12.1.1.1. Company Overview
- 12.1.1.2. Products
- 12.1.1.3. Company Financials
- 12.1.1.4. SWOT Analysis
- 12.1.2 Novartis AG
- 12.1.2.1. Company Overview
- 12.1.2.2. Products
- 12.1.2.3. Company Financials
- 12.1.2.4. SWOT Analysis
- 12.1.3 Genentech
- 12.1.3.1. Company Overview
- 12.1.3.2. Products
- 12.1.3.3. Company Financials
- 12.1.3.4. SWOT Analysis
- 12.1.4 Hikma Pharmaceuticals
- 12.1.4.1. Company Overview
- 12.1.4.2. Products
- 12.1.4.3. Company Financials
- 12.1.4.4. SWOT Analysis
- 12.1.5 AstraZeneca PLC
- 12.1.5.1. Company Overview
- 12.1.5.2. Products
- 12.1.5.3. Company Financials
- 12.1.5.4. SWOT Analysis
- 12.1.6 FRESENIUS KABI
- 12.1.6.1. Company Overview
- 12.1.6.2. Products
- 12.1.6.3. Company Financials
- 12.1.6.4. SWOT Analysis
- 12.1.7 Eli Lilly and Company
- 12.1.7.1. Company Overview
- 12.1.7.2. Products
- 12.1.7.3. Company Financials
- 12.1.7.4. SWOT Analysis
- 12.1.8 Celltrion Healthcare
- 12.1.8.1. Company Overview
- 12.1.8.2. Products
- 12.1.8.3. Company Financials
- 12.1.8.4. SWOT Analysis
- 12.1.9 Teva Pharmaceutical Industries Ltd
- 12.1.9.1. Company Overview
- 12.1.9.2. Products
- 12.1.9.3. Company Financials
- 12.1.9.4. SWOT Analysis
- 12.1.10 Viatris Inc
- 12.1.10.1. Company Overview
- 12.1.10.2. Products
- 12.1.10.3. Company Financials
- 12.1.10.4. SWOT Analysis
- 12.1.11 Halozyme Inc
- 12.1.11.1. Company Overview
- 12.1.11.2. Products
- 12.1.11.3. Company Financials
- 12.1.11.4. SWOT Analysis
- 12.1.12 Eisai Co Ltd
- 12.1.12.1. Company Overview
- 12.1.12.2. Products
- 12.1.12.3. Company Financials
- 12.1.12.4. SWOT Analysis
- 12.1.13 Bristol-Myers Squibb Company
- 12.1.13.1. Company Overview
- 12.1.13.2. Products
- 12.1.13.3. Company Financials
- 12.1.13.4. SWOT Analysis
- 12.1.14 GlaxoSmithKline PLC
- 12.1.14.1. Company Overview
- 12.1.14.2. Products
- 12.1.14.3. Company Financials
- 12.1.14.4. SWOT Analysis
- 12.1.15 Pfizer Inc
- 12.1.15.1. Company Overview
- 12.1.15.2. Products
- 12.1.15.3. Company Financials
- 12.1.15.4. SWOT Analysis
- 12.1.1 Baxter Healthcare Corporation
- 12.2. Market Entropy
- 12.2.1 Company's Key Areas Served
- 12.2.2 Recent Developments
- 12.3. Company Market Share Analysis 2025
- 12.3.1 Top 5 Companies Market Share Analysis
- 12.3.2 Top 3 Companies Market Share Analysis
- 12.4. List of Potential Customers
- 13. Research Methodology
List of Figures
- Figure 1: Global Breast Cancer Therapy Market Revenue Breakdown (billion, %) by Region 2025 & 2033
- Figure 2: Global Breast Cancer Therapy Market Volume Breakdown (K Unit, %) by Region 2025 & 2033
- Figure 3: North America Breast Cancer Therapy Market Revenue (billion), by Therapy 2025 & 2033
- Figure 4: North America Breast Cancer Therapy Market Volume (K Unit), by Therapy 2025 & 2033
- Figure 5: North America Breast Cancer Therapy Market Revenue Share (%), by Therapy 2025 & 2033
- Figure 6: North America Breast Cancer Therapy Market Volume Share (%), by Therapy 2025 & 2033
- Figure 7: North America Breast Cancer Therapy Market Revenue (billion), by Country 2025 & 2033
- Figure 8: North America Breast Cancer Therapy Market Volume (K Unit), by Country 2025 & 2033
- Figure 9: North America Breast Cancer Therapy Market Revenue Share (%), by Country 2025 & 2033
- Figure 10: North America Breast Cancer Therapy Market Volume Share (%), by Country 2025 & 2033
- Figure 11: Europe Breast Cancer Therapy Market Revenue (billion), by Therapy 2025 & 2033
- Figure 12: Europe Breast Cancer Therapy Market Volume (K Unit), by Therapy 2025 & 2033
- Figure 13: Europe Breast Cancer Therapy Market Revenue Share (%), by Therapy 2025 & 2033
- Figure 14: Europe Breast Cancer Therapy Market Volume Share (%), by Therapy 2025 & 2033
- Figure 15: Europe Breast Cancer Therapy Market Revenue (billion), by Country 2025 & 2033
- Figure 16: Europe Breast Cancer Therapy Market Volume (K Unit), by Country 2025 & 2033
- Figure 17: Europe Breast Cancer Therapy Market Revenue Share (%), by Country 2025 & 2033
- Figure 18: Europe Breast Cancer Therapy Market Volume Share (%), by Country 2025 & 2033
- Figure 19: Asia Pacific Breast Cancer Therapy Market Revenue (billion), by Therapy 2025 & 2033
- Figure 20: Asia Pacific Breast Cancer Therapy Market Volume (K Unit), by Therapy 2025 & 2033
- Figure 21: Asia Pacific Breast Cancer Therapy Market Revenue Share (%), by Therapy 2025 & 2033
- Figure 22: Asia Pacific Breast Cancer Therapy Market Volume Share (%), by Therapy 2025 & 2033
- Figure 23: Asia Pacific Breast Cancer Therapy Market Revenue (billion), by Country 2025 & 2033
- Figure 24: Asia Pacific Breast Cancer Therapy Market Volume (K Unit), by Country 2025 & 2033
- Figure 25: Asia Pacific Breast Cancer Therapy Market Revenue Share (%), by Country 2025 & 2033
- Figure 26: Asia Pacific Breast Cancer Therapy Market Volume Share (%), by Country 2025 & 2033
- Figure 27: Middle East and Africa Breast Cancer Therapy Market Revenue (billion), by Therapy 2025 & 2033
- Figure 28: Middle East and Africa Breast Cancer Therapy Market Volume (K Unit), by Therapy 2025 & 2033
- Figure 29: Middle East and Africa Breast Cancer Therapy Market Revenue Share (%), by Therapy 2025 & 2033
- Figure 30: Middle East and Africa Breast Cancer Therapy Market Volume Share (%), by Therapy 2025 & 2033
- Figure 31: Middle East and Africa Breast Cancer Therapy Market Revenue (billion), by Country 2025 & 2033
- Figure 32: Middle East and Africa Breast Cancer Therapy Market Volume (K Unit), by Country 2025 & 2033
- Figure 33: Middle East and Africa Breast Cancer Therapy Market Revenue Share (%), by Country 2025 & 2033
- Figure 34: Middle East and Africa Breast Cancer Therapy Market Volume Share (%), by Country 2025 & 2033
- Figure 35: South America Breast Cancer Therapy Market Revenue (billion), by Therapy 2025 & 2033
- Figure 36: South America Breast Cancer Therapy Market Volume (K Unit), by Therapy 2025 & 2033
- Figure 37: South America Breast Cancer Therapy Market Revenue Share (%), by Therapy 2025 & 2033
- Figure 38: South America Breast Cancer Therapy Market Volume Share (%), by Therapy 2025 & 2033
- Figure 39: South America Breast Cancer Therapy Market Revenue (billion), by Country 2025 & 2033
- Figure 40: South America Breast Cancer Therapy Market Volume (K Unit), by Country 2025 & 2033
- Figure 41: South America Breast Cancer Therapy Market Revenue Share (%), by Country 2025 & 2033
- Figure 42: South America Breast Cancer Therapy Market Volume Share (%), by Country 2025 & 2033
List of Tables
- Table 1: Global Breast Cancer Therapy Market Revenue billion Forecast, by Therapy 2020 & 2033
- Table 2: Global Breast Cancer Therapy Market Volume K Unit Forecast, by Therapy 2020 & 2033
- Table 3: Global Breast Cancer Therapy Market Revenue billion Forecast, by Region 2020 & 2033
- Table 4: Global Breast Cancer Therapy Market Volume K Unit Forecast, by Region 2020 & 2033
- Table 5: Global Breast Cancer Therapy Market Revenue billion Forecast, by Therapy 2020 & 2033
- Table 6: Global Breast Cancer Therapy Market Volume K Unit Forecast, by Therapy 2020 & 2033
- Table 7: Global Breast Cancer Therapy Market Revenue billion Forecast, by Country 2020 & 2033
- Table 8: Global Breast Cancer Therapy Market Volume K Unit Forecast, by Country 2020 & 2033
- Table 9: United States Breast Cancer Therapy Market Revenue (billion) Forecast, by Application 2020 & 2033
- Table 10: United States Breast Cancer Therapy Market Volume (K Unit) Forecast, by Application 2020 & 2033
- Table 11: Canada Breast Cancer Therapy Market Revenue (billion) Forecast, by Application 2020 & 2033
- Table 12: Canada Breast Cancer Therapy Market Volume (K Unit) Forecast, by Application 2020 & 2033
- Table 13: Mexico Breast Cancer Therapy Market Revenue (billion) Forecast, by Application 2020 & 2033
- Table 14: Mexico Breast Cancer Therapy Market Volume (K Unit) Forecast, by Application 2020 & 2033
- Table 15: Global Breast Cancer Therapy Market Revenue billion Forecast, by Therapy 2020 & 2033
- Table 16: Global Breast Cancer Therapy Market Volume K Unit Forecast, by Therapy 2020 & 2033
- Table 17: Global Breast Cancer Therapy Market Revenue billion Forecast, by Country 2020 & 2033
- Table 18: Global Breast Cancer Therapy Market Volume K Unit Forecast, by Country 2020 & 2033
- Table 19: Germany Breast Cancer Therapy Market Revenue (billion) Forecast, by Application 2020 & 2033
- Table 20: Germany Breast Cancer Therapy Market Volume (K Unit) Forecast, by Application 2020 & 2033
- Table 21: United Kingdom Breast Cancer Therapy Market Revenue (billion) Forecast, by Application 2020 & 2033
- Table 22: United Kingdom Breast Cancer Therapy Market Volume (K Unit) Forecast, by Application 2020 & 2033
- Table 23: France Breast Cancer Therapy Market Revenue (billion) Forecast, by Application 2020 & 2033
- Table 24: France Breast Cancer Therapy Market Volume (K Unit) Forecast, by Application 2020 & 2033
- Table 25: Italy Breast Cancer Therapy Market Revenue (billion) Forecast, by Application 2020 & 2033
- Table 26: Italy Breast Cancer Therapy Market Volume (K Unit) Forecast, by Application 2020 & 2033
- Table 27: Spain Breast Cancer Therapy Market Revenue (billion) Forecast, by Application 2020 & 2033
- Table 28: Spain Breast Cancer Therapy Market Volume (K Unit) Forecast, by Application 2020 & 2033
- Table 29: Rest of Europe Breast Cancer Therapy Market Revenue (billion) Forecast, by Application 2020 & 2033
- Table 30: Rest of Europe Breast Cancer Therapy Market Volume (K Unit) Forecast, by Application 2020 & 2033
- Table 31: Global Breast Cancer Therapy Market Revenue billion Forecast, by Therapy 2020 & 2033
- Table 32: Global Breast Cancer Therapy Market Volume K Unit Forecast, by Therapy 2020 & 2033
- Table 33: Global Breast Cancer Therapy Market Revenue billion Forecast, by Country 2020 & 2033
- Table 34: Global Breast Cancer Therapy Market Volume K Unit Forecast, by Country 2020 & 2033
- Table 35: China Breast Cancer Therapy Market Revenue (billion) Forecast, by Application 2020 & 2033
- Table 36: China Breast Cancer Therapy Market Volume (K Unit) Forecast, by Application 2020 & 2033
- Table 37: Japan Breast Cancer Therapy Market Revenue (billion) Forecast, by Application 2020 & 2033
- Table 38: Japan Breast Cancer Therapy Market Volume (K Unit) Forecast, by Application 2020 & 2033
- Table 39: India Breast Cancer Therapy Market Revenue (billion) Forecast, by Application 2020 & 2033
- Table 40: India Breast Cancer Therapy Market Volume (K Unit) Forecast, by Application 2020 & 2033
- Table 41: Australia Breast Cancer Therapy Market Revenue (billion) Forecast, by Application 2020 & 2033
- Table 42: Australia Breast Cancer Therapy Market Volume (K Unit) Forecast, by Application 2020 & 2033
- Table 43: South Korea Breast Cancer Therapy Market Revenue (billion) Forecast, by Application 2020 & 2033
- Table 44: South Korea Breast Cancer Therapy Market Volume (K Unit) Forecast, by Application 2020 & 2033
- Table 45: Rest of Asia Pacific Breast Cancer Therapy Market Revenue (billion) Forecast, by Application 2020 & 2033
- Table 46: Rest of Asia Pacific Breast Cancer Therapy Market Volume (K Unit) Forecast, by Application 2020 & 2033
- Table 47: Global Breast Cancer Therapy Market Revenue billion Forecast, by Therapy 2020 & 2033
- Table 48: Global Breast Cancer Therapy Market Volume K Unit Forecast, by Therapy 2020 & 2033
- Table 49: Global Breast Cancer Therapy Market Revenue billion Forecast, by Country 2020 & 2033
- Table 50: Global Breast Cancer Therapy Market Volume K Unit Forecast, by Country 2020 & 2033
- Table 51: GCC Breast Cancer Therapy Market Revenue (billion) Forecast, by Application 2020 & 2033
- Table 52: GCC Breast Cancer Therapy Market Volume (K Unit) Forecast, by Application 2020 & 2033
- Table 53: South Africa Breast Cancer Therapy Market Revenue (billion) Forecast, by Application 2020 & 2033
- Table 54: South Africa Breast Cancer Therapy Market Volume (K Unit) Forecast, by Application 2020 & 2033
- Table 55: Rest of Middle East and Africa Breast Cancer Therapy Market Revenue (billion) Forecast, by Application 2020 & 2033
- Table 56: Rest of Middle East and Africa Breast Cancer Therapy Market Volume (K Unit) Forecast, by Application 2020 & 2033
- Table 57: Global Breast Cancer Therapy Market Revenue billion Forecast, by Therapy 2020 & 2033
- Table 58: Global Breast Cancer Therapy Market Volume K Unit Forecast, by Therapy 2020 & 2033
- Table 59: Global Breast Cancer Therapy Market Revenue billion Forecast, by Country 2020 & 2033
- Table 60: Global Breast Cancer Therapy Market Volume K Unit Forecast, by Country 2020 & 2033
- Table 61: Brazil Breast Cancer Therapy Market Revenue (billion) Forecast, by Application 2020 & 2033
- Table 62: Brazil Breast Cancer Therapy Market Volume (K Unit) Forecast, by Application 2020 & 2033
- Table 63: Argentina Breast Cancer Therapy Market Revenue (billion) Forecast, by Application 2020 & 2033
- Table 64: Argentina Breast Cancer Therapy Market Volume (K Unit) Forecast, by Application 2020 & 2033
- Table 65: Rest of South America Breast Cancer Therapy Market Revenue (billion) Forecast, by Application 2020 & 2033
- Table 66: Rest of South America Breast Cancer Therapy Market Volume (K Unit) Forecast, by Application 2020 & 2033
Frequently Asked Questions
1. What is the projected Compound Annual Growth Rate (CAGR) of the Breast Cancer Therapy Market?
The projected CAGR is approximately 8.5%.
2. Which companies are prominent players in the Breast Cancer Therapy Market?
Key companies in the market include Baxter Healthcare Corporation, Novartis AG, Genentech, Hikma Pharmaceuticals, AstraZeneca PLC, FRESENIUS KABI, Eli Lilly and Company, Celltrion Healthcare, Teva Pharmaceutical Industries Ltd, Viatris Inc, Halozyme Inc, Eisai Co Ltd, Bristol-Myers Squibb Company, GlaxoSmithKline PLC, Pfizer Inc.
3. What are the main segments of the Breast Cancer Therapy Market?
The market segments include Therapy.
4. Can you provide details about the market size?
The market size is estimated to be USD 34.3 billion as of 2022.
5. What are some drivers contributing to market growth?
High Incidence and Prevalence Rate of Breast Cancer; Increasing Investments in R&D; Advancements in Cancer Biology and Pharmacology. Promoting Drug Development.
6. What are the notable trends driving market growth?
Chemotherapy Segment Expected to Witness High Growth Over the Forecast Period.
7. Are there any restraints impacting market growth?
Risk of Adverse Effects of Radiation Exposure; Stringent Regulatory Scenarios.
8. Can you provide examples of recent developments in the market?
In September 2022, Novartis announced results from a new pooled exploratory analysis across the entire MONALEESA Phase III program, confirming nearly one year of additional overall survival (OS) benefit in a subgroup of patients with aggressive forms of hormone receptor-positive, human epidermal growth factor receptor-2 negative (HR+/HER2-) advanced breast cancer (aBC).
9. What pricing options are available for accessing the report?
Pricing options include single-user, multi-user, and enterprise licenses priced at USD 4750, USD 5250, and USD 8750 respectively.
10. Is the market size provided in terms of value or volume?
The market size is provided in terms of value, measured in billion and volume, measured in K Unit.
11. Are there any specific market keywords associated with the report?
Yes, the market keyword associated with the report is "Breast Cancer Therapy Market," which aids in identifying and referencing the specific market segment covered.
12. How do I determine which pricing option suits my needs best?
The pricing options vary based on user requirements and access needs. Individual users may opt for single-user licenses, while businesses requiring broader access may choose multi-user or enterprise licenses for cost-effective access to the report.
13. Are there any additional resources or data provided in the Breast Cancer Therapy Market report?
While the report offers comprehensive insights, it's advisable to review the specific contents or supplementary materials provided to ascertain if additional resources or data are available.
14. How can I stay updated on further developments or reports in the Breast Cancer Therapy Market?
To stay informed about further developments, trends, and reports in the Breast Cancer Therapy Market, consider subscribing to industry newsletters, following relevant companies and organizations, or regularly checking reputable industry news sources and publications.
Methodology
Step 1 - Identification of Relevant Samples Size from Population Database


Step 2 - Approaches for Defining Global Market Size (Value, Volume* & Price*)

Note*: In applicable scenarios
Step 3 - Data Sources
Primary Research
- Web Analytics
- Survey Reports
- Research Institute
- Latest Research Reports
- Opinion Leaders
Secondary Research
- Annual Reports
- White Paper
- Latest Press Release
- Industry Association
- Paid Database
- Investor Presentations

Step 4 - Data Triangulation
Involves using different sources of information in order to increase the validity of a study
These sources are likely to be stakeholders in a program - participants, other researchers, program staff, other community members, and so on.
Then we put all data in single framework & apply various statistical tools to find out the dynamic on the market.
During the analysis stage, feedback from the stakeholder groups would be compared to determine areas of agreement as well as areas of divergence