

Key Insights
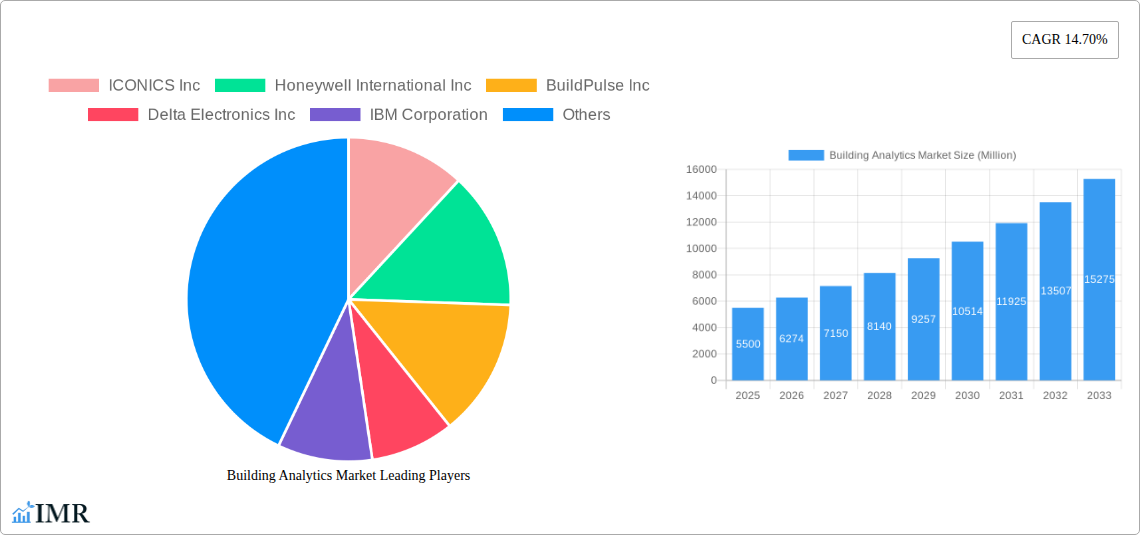
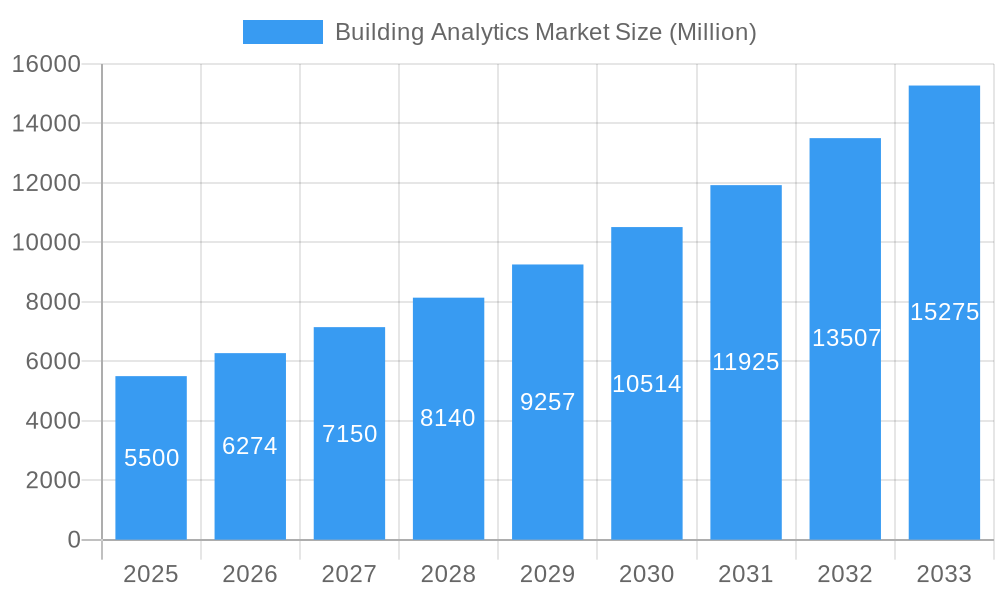
The global Building Analytics Market is poised for substantial expansion, projected to reach an estimated USD XX million by 2025. This robust growth trajectory is further underscored by a remarkable Compound Annual Growth Rate (CAGR) of 14.70% anticipated from 2025 through 2033. This surge is primarily propelled by an increasing demand for energy efficiency, driven by rising energy costs and stringent environmental regulations worldwide. Furthermore, the growing emphasis on optimizing building operations, enhancing occupant comfort, and ensuring security through intelligent data analysis is fueling market adoption. The escalating adoption of smart building technologies, including the Internet of Things (IoT) sensors and advanced cloud platforms, is providing the foundational infrastructure for sophisticated building analytics solutions.
Building Analytics Market Market Size (In Billion)
Key applications driving this market expansion include Energy Management, where analytics platforms are instrumental in identifying and rectifying energy wastage, and Security Management, leveraging data to detect anomalies and improve safety protocols. The Fault Detection and Monitoring segment also shows significant promise, enabling proactive maintenance and reducing operational downtime. On the component front, both Software and Services are crucial, with ongoing innovation in AI and machine learning algorithms enhancing the predictive and prescriptive capabilities of building analytics solutions. The market is witnessing a shift towards Cloud deployment modes due to their scalability and cost-effectiveness, although On-Premises solutions remain relevant for organizations with specific data security needs. Residential and Commercial Buildings represent the primary end-user segments, with increasing integration of analytics in new constructions and retrofitting of existing structures. Major players like Siemens AG, Honeywell International Inc., and Schneider Electric are at the forefront, investing heavily in research and development to capture a significant share of this dynamic market.
Building Analytics Market Company Market Share
Building Analytics Market: Comprehensive Report and Forecast (2019-2033)
This report offers an in-depth analysis of the global Building Analytics Market, exploring its dynamics, growth trends, regional dominance, product landscape, and key players. With a study period spanning from 2019 to 2033, this comprehensive research provides critical insights for stakeholders seeking to navigate the evolving smart building technology sector. The report leverages high-traffic keywords such as "building analytics," "smart buildings," "energy management solutions," "security management systems," "fault detection," and "IoT in buildings" to maximize search engine visibility and attract industry professionals. We delve into both parent and child market segments to provide a holistic market view.
Building Analytics Market Market Dynamics & Structure
The Building Analytics Market exhibits a moderate to high degree of market concentration, driven by a mix of established global players and emerging specialized firms. Technological innovation is the primary driver, fueled by advancements in the Internet of Things (IoT), artificial intelligence (AI), machine learning (ML), and cloud computing, enabling more sophisticated data collection and analysis. Regulatory frameworks, particularly those promoting energy efficiency and building safety, are increasingly shaping market adoption. Competitive product substitutes, such as manual building management systems and standalone energy monitoring devices, are gradually being superseded by integrated building analytics platforms. End-user demographics are shifting towards a greater demand for operational efficiency, cost reduction, and enhanced occupant comfort and safety. Mergers and acquisitions (M&A) are a notable trend, with larger companies acquiring innovative startups to expand their product portfolios and market reach. For instance, the historical period (2019-2024) saw an estimated xx number of M&A deals valued at approximately $xxx million, indicating a consolidation phase and strategic expansion efforts by key market participants. Barriers to innovation include the high initial investment cost for advanced analytics systems and the need for skilled personnel to manage and interpret the data.
- Market Concentration: Moderate to High, with key players like Johnson Controls International Plc, Siemens AG, and Honeywell International Inc. leading the pack.
- Technological Innovation Drivers: IoT sensors, AI/ML algorithms for predictive maintenance, cloud-based data platforms, and advanced visualization tools.
- Regulatory Frameworks: Government mandates for energy efficiency (e.g., LEED certification), building performance standards, and data privacy regulations.
- Competitive Product Substitutes: Basic Building Automation Systems (BAS), manual monitoring, and standalone energy meters.
- End-User Demographics: Growing demand from commercial real estate, industrial facilities, and municipalities for operational optimization and sustainability.
- M&A Trends: Strategic acquisitions to gain access to proprietary technology, expand customer base, and enhance market presence.
- Innovation Barriers: High upfront investment, data integration complexities, cybersecurity concerns, and the need for upskilling the workforce.
Building Analytics Market Growth Trends & Insights
The Building Analytics Market is poised for significant growth, driven by an escalating need for intelligent building solutions that optimize energy consumption, enhance operational efficiency, and improve occupant experience. The market size is projected to evolve from an estimated $XX,XXX million in 2025 to over $XX,XXX million by 2033, exhibiting a robust Compound Annual Growth Rate (CAGR) of approximately XX.XX% during the forecast period (2025-2033). This growth is underpinned by increasing adoption rates of smart building technologies, particularly in commercial and residential sectors. Technological disruptions, including the proliferation of AI-powered predictive analytics for fault detection and maintenance, and the integration of Building Information Modeling (BIM) with analytics platforms, are reshaping how buildings are managed. Consumer behavior is shifting towards a greater preference for sustainable and technologically advanced living and working spaces, influencing demand for data-driven building insights. The base year (2025) marks a crucial point where the market is rapidly adopting cloud-based solutions, leading to enhanced scalability and accessibility of analytics services. The historical period (2019-2024) witnessed a CAGR of XX.XX%, laying the groundwork for accelerated expansion. Key market penetration figures are projected to reach XX% for commercial buildings by 2033, highlighting the significant untapped potential. The integration of Building Analytics with broader smart city initiatives further amplifies its growth trajectory.
Dominant Regions, Countries, or Segments in Building Analytics Market
The Commercial Buildings segment is identified as the dominant force driving growth within the Building Analytics Market. This dominance is attributed to a confluence of factors including higher energy consumption, greater operational complexity, and a more pronounced focus on cost optimization and tenant satisfaction within commercial real estate portfolios. The Energy Management application segment also plays a pivotal role, directly addressing the increasing global imperative for sustainability and reduced carbon footprints.
Dominant Segments & Drivers:
- Building Type: Commercial Buildings
- Market Share: Estimated to hold XX% of the total market share in 2025.
- Drivers: Stringent energy efficiency regulations, demand for operational cost reduction, and the need for enhanced occupant comfort and productivity. Major economies in North America and Europe are leading adoption in this segment.
- Growth Potential: Significant potential driven by retrofitting existing commercial spaces with smart technologies and the development of new, energy-efficient commercial structures.
- Application: Energy Management
- Market Share: Accounts for an estimated XX% of the Building Analytics Market by application in 2025.
- Drivers: Rising energy costs, corporate sustainability goals (ESG), and government incentives for energy conservation. The integration of smart grids further enhances the value of energy analytics.
- Growth Potential: Continuous innovation in AI-driven energy forecasting and optimization, and the increasing adoption of renewable energy sources within buildings.
- Component: Software
- Market Share: Projected to command XX% of the market by component in 2025.
- Drivers: The increasing sophistication of analytics platforms, AI/ML algorithms, and data visualization tools are central to the value proposition of building analytics.
- Growth Potential: Advancements in predictive maintenance software and integrated Building Information Modeling (BIM) capabilities will fuel further growth.
- Deployment Mode: Cloud
- Market Share: Expected to dominate with an estimated XX% in 2025.
- Drivers: Scalability, cost-effectiveness, remote accessibility, and ease of integration with other cloud-based services.
- Growth Potential: The continued evolution of cloud infrastructure and the increasing comfort of businesses with cloud-based data management solutions.
Leading countries within North America and Europe, such as the United States, Germany, and the United Kingdom, are at the forefront due to supportive government policies, high levels of technological adoption, and a strong presence of key market players.
Building Analytics Market Product Landscape
The Building Analytics Market product landscape is characterized by a rapid evolution of sophisticated software platforms and integrated hardware solutions. Innovations are focused on delivering real-time insights for proactive building management. Key product developments include AI-powered predictive maintenance modules that can anticipate equipment failures, anomaly detection systems for identifying unusual energy consumption patterns, and advanced dashboards offering granular control over HVAC, lighting, and security systems. The performance metrics of these products are increasingly measured by their ability to deliver measurable ROI through energy savings (e.g., reduction of up to XX% in energy bills), reduced operational costs, and enhanced occupant comfort. Unique selling propositions often revolve around the ease of integration with existing Building Management Systems (BMS) and the robustness of cybersecurity measures employed.
Key Drivers, Barriers & Challenges in Building Analytics Market
Key Drivers:
- Increasing Demand for Energy Efficiency: Growing global concerns about climate change and rising energy costs are compelling building owners and operators to adopt solutions that optimize energy consumption.
- Technological Advancements: The rapid development and decreasing cost of IoT sensors, AI, and cloud computing are enabling more powerful and accessible building analytics platforms.
- Focus on Occupant Comfort and Productivity: Businesses are recognizing the link between a well-managed building environment and employee well-being, driving demand for intelligent systems.
- Government Regulations and Incentives: Supportive policies mandating energy performance standards and offering financial incentives for sustainable building practices are crucial growth catalysts.
Barriers & Challenges:
- High Initial Investment Costs: The upfront capital expenditure for implementing advanced building analytics systems can be a significant barrier for some organizations, particularly small and medium-sized enterprises (SMEs).
- Data Integration Complexity: Integrating data from disparate building systems, sensors, and legacy infrastructure can be technically challenging and time-consuming.
- Cybersecurity Concerns: The increased connectivity of building systems raises concerns about data breaches and cyberattacks, requiring robust security measures.
- Lack of Skilled Workforce: A shortage of trained professionals capable of implementing, managing, and interpreting building analytics data can hinder adoption.
- Resistance to Change: Inertia and reluctance to adopt new technologies among building management teams can slow down market penetration.
Emerging Opportunities in Building Analytics Market
Emerging opportunities in the Building Analytics Market are centered around the expansion into underserved sectors and the development of more specialized AI-driven applications. The growing interest in smart homes and residential building analytics presents a significant untapped market. Furthermore, the integration of building analytics with broader smart city initiatives offers immense potential for optimizing urban infrastructure and resource management. The development of predictive analytics for space utilization and demand-response capabilities in commercial buildings also presents a lucrative avenue. Evolving consumer preferences for hyper-personalized building environments, with tailored lighting, temperature, and air quality settings, will drive demand for granular analytics.
Growth Accelerators in the Building Analytics Market Industry
Technological breakthroughs in AI and ML algorithms are continuously enhancing the predictive and prescriptive capabilities of building analytics platforms, acting as significant growth accelerators. Strategic partnerships between technology providers, building automation companies, and real estate developers are fostering innovation and expanding market reach. The increasing adoption of an "as-a-service" model for building analytics solutions is lowering the barrier to entry and driving market penetration. Furthermore, the growing emphasis on ESG (Environmental, Social, and Governance) reporting by corporations is pushing for greater transparency and accountability in building performance, thereby accelerating the adoption of analytics.
Key Players Shaping the Building Analytics Market Market
- ICONICS Inc
- Honeywell International Inc
- BuildPulse Inc
- Delta Electronics Inc
- IBM Corporation
- Crestron Electronics
- Noveda Technologies Inc
- CopperTree Analytics Inc
- Johnson Controls International Plc
- Siemens AG
- BuildingIQ
- GridPoint Inc
- Schneider Electric
- ENGIE Insight Services Inc
- General Electric Company
Notable Milestones in Building Analytics Market Sector
- 2020: Increased adoption of cloud-based building analytics platforms, driven by the need for remote monitoring and management.
- 2021: Significant advancements in AI and machine learning for predictive maintenance in HVAC systems, reducing downtime and operational costs.
- 2022: Growing integration of building analytics with smart grid technologies for enhanced energy management and demand-response capabilities.
- 2023: Increased focus on cybersecurity solutions for building analytics to protect sensitive data and building operations.
- 2024: Expansion of building analytics applications into the residential sector, driven by smart home technology proliferation.
In-Depth Building Analytics Market Market Outlook
The Building Analytics Market is set for robust and sustained growth, propelled by an unwavering demand for intelligent, sustainable, and efficient building operations. The convergence of IoT, AI, and cloud computing will continue to drive innovation, offering increasingly sophisticated solutions for energy management, security, and occupant well-being. Strategic collaborations and the evolving "as-a-service" models are poised to democratize access to advanced analytics, accelerating adoption across all building types, from residential to large commercial complexes. The increasing emphasis on ESG compliance and the drive for operational cost reduction will ensure that building analytics remains a critical investment for stakeholders seeking to optimize performance and future-proof their built environment.
Building Analytics Market Segmentation
-
1. Application
- 1.1. Energy Management
- 1.2. Security Management
- 1.3. Fault Detection and Monitoring
- 1.4. Other Applications
-
2. Component
- 2.1. Software
- 2.2. Services
-
3. Deployment Mode
- 3.1. On-Premises
- 3.2. Cloud
-
4. Building Type
- 4.1. Residential Buildings
- 4.2. Commercial Buildings
- 4.3. Other Building Types
Building Analytics Market Segmentation By Geography
- 1. North America
- 2. Europe
- 3. Asia Pacific
- 4. Latin America
- 5. Middle East and Africa
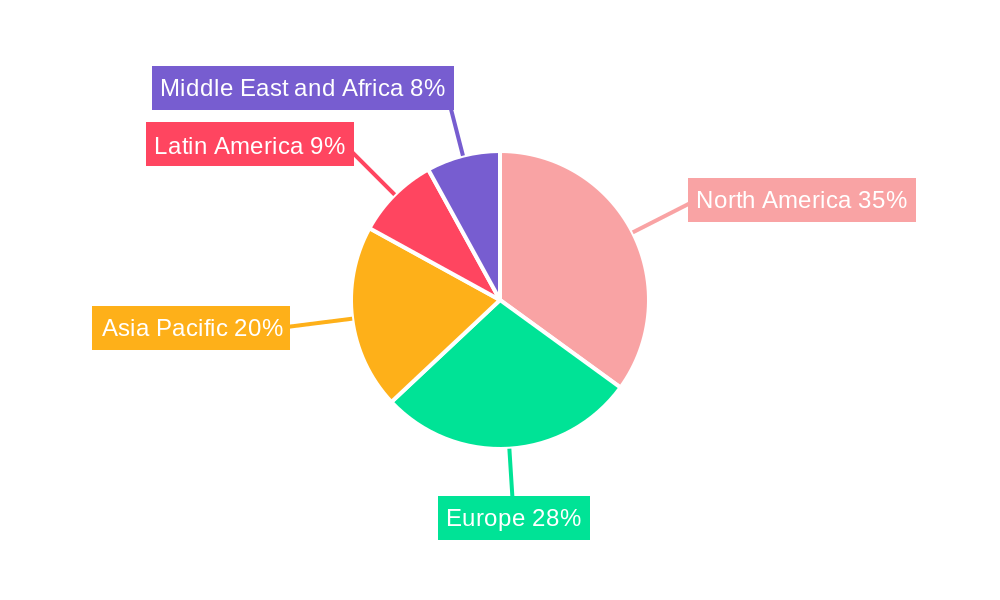
Building Analytics Market Regional Market Share
Geographic Coverage of Building Analytics Market
Building Analytics Market REPORT HIGHLIGHTS
| Aspects | Details |
|---|---|
| Study Period | 2020-2034 |
| Base Year | 2025 |
| Estimated Year | 2026 |
| Forecast Period | 2026-2034 |
| Historical Period | 2020-2025 |
| Growth Rate | CAGR of 13.67% from 2020-2034 |
| Segmentation |
|
Table of Contents
- 1. Introduction
- 1.1. Research Scope
- 1.2. Market Segmentation
- 1.3. Research Methodology
- 1.4. Definitions and Assumptions
- 2. Executive Summary
- 2.1. Introduction
- 3. Market Dynamics
- 3.1. Introduction
- 3.2. Market Drivers
- 3.2.1. ; Increased Demand for Energy-Efficient Systems; Growing Adoption of Cloud-Based IoT Platforms
- 3.3. Market Restrains
- 3.3.1. ; High Cost of Implementation
- 3.4. Market Trends
- 3.4.1. Energy Management Application to Hold the Largest Market Size
- 4. Market Factor Analysis
- 4.1. Porters Five Forces
- 4.2. Supply/Value Chain
- 4.3. PESTEL analysis
- 4.4. Market Entropy
- 4.5. Patent/Trademark Analysis
- 5. Global Building Analytics Market Analysis, Insights and Forecast, 2020-2032
- 5.1. Market Analysis, Insights and Forecast - by Application
- 5.1.1. Energy Management
- 5.1.2. Security Management
- 5.1.3. Fault Detection and Monitoring
- 5.1.4. Other Applications
- 5.2. Market Analysis, Insights and Forecast - by Component
- 5.2.1. Software
- 5.2.2. Services
- 5.3. Market Analysis, Insights and Forecast - by Deployment Mode
- 5.3.1. On-Premises
- 5.3.2. Cloud
- 5.4. Market Analysis, Insights and Forecast - by Building Type
- 5.4.1. Residential Buildings
- 5.4.2. Commercial Buildings
- 5.4.3. Other Building Types
- 5.5. Market Analysis, Insights and Forecast - by Region
- 5.5.1. North America
- 5.5.2. Europe
- 5.5.3. Asia Pacific
- 5.5.4. Latin America
- 5.5.5. Middle East and Africa
- 5.1. Market Analysis, Insights and Forecast - by Application
- 6. North America Building Analytics Market Analysis, Insights and Forecast, 2020-2032
- 6.1. Market Analysis, Insights and Forecast - by Application
- 6.1.1. Energy Management
- 6.1.2. Security Management
- 6.1.3. Fault Detection and Monitoring
- 6.1.4. Other Applications
- 6.2. Market Analysis, Insights and Forecast - by Component
- 6.2.1. Software
- 6.2.2. Services
- 6.3. Market Analysis, Insights and Forecast - by Deployment Mode
- 6.3.1. On-Premises
- 6.3.2. Cloud
- 6.4. Market Analysis, Insights and Forecast - by Building Type
- 6.4.1. Residential Buildings
- 6.4.2. Commercial Buildings
- 6.4.3. Other Building Types
- 6.1. Market Analysis, Insights and Forecast - by Application
- 7. Europe Building Analytics Market Analysis, Insights and Forecast, 2020-2032
- 7.1. Market Analysis, Insights and Forecast - by Application
- 7.1.1. Energy Management
- 7.1.2. Security Management
- 7.1.3. Fault Detection and Monitoring
- 7.1.4. Other Applications
- 7.2. Market Analysis, Insights and Forecast - by Component
- 7.2.1. Software
- 7.2.2. Services
- 7.3. Market Analysis, Insights and Forecast - by Deployment Mode
- 7.3.1. On-Premises
- 7.3.2. Cloud
- 7.4. Market Analysis, Insights and Forecast - by Building Type
- 7.4.1. Residential Buildings
- 7.4.2. Commercial Buildings
- 7.4.3. Other Building Types
- 7.1. Market Analysis, Insights and Forecast - by Application
- 8. Asia Pacific Building Analytics Market Analysis, Insights and Forecast, 2020-2032
- 8.1. Market Analysis, Insights and Forecast - by Application
- 8.1.1. Energy Management
- 8.1.2. Security Management
- 8.1.3. Fault Detection and Monitoring
- 8.1.4. Other Applications
- 8.2. Market Analysis, Insights and Forecast - by Component
- 8.2.1. Software
- 8.2.2. Services
- 8.3. Market Analysis, Insights and Forecast - by Deployment Mode
- 8.3.1. On-Premises
- 8.3.2. Cloud
- 8.4. Market Analysis, Insights and Forecast - by Building Type
- 8.4.1. Residential Buildings
- 8.4.2. Commercial Buildings
- 8.4.3. Other Building Types
- 8.1. Market Analysis, Insights and Forecast - by Application
- 9. Latin America Building Analytics Market Analysis, Insights and Forecast, 2020-2032
- 9.1. Market Analysis, Insights and Forecast - by Application
- 9.1.1. Energy Management
- 9.1.2. Security Management
- 9.1.3. Fault Detection and Monitoring
- 9.1.4. Other Applications
- 9.2. Market Analysis, Insights and Forecast - by Component
- 9.2.1. Software
- 9.2.2. Services
- 9.3. Market Analysis, Insights and Forecast - by Deployment Mode
- 9.3.1. On-Premises
- 9.3.2. Cloud
- 9.4. Market Analysis, Insights and Forecast - by Building Type
- 9.4.1. Residential Buildings
- 9.4.2. Commercial Buildings
- 9.4.3. Other Building Types
- 9.1. Market Analysis, Insights and Forecast - by Application
- 10. Middle East and Africa Building Analytics Market Analysis, Insights and Forecast, 2020-2032
- 10.1. Market Analysis, Insights and Forecast - by Application
- 10.1.1. Energy Management
- 10.1.2. Security Management
- 10.1.3. Fault Detection and Monitoring
- 10.1.4. Other Applications
- 10.2. Market Analysis, Insights and Forecast - by Component
- 10.2.1. Software
- 10.2.2. Services
- 10.3. Market Analysis, Insights and Forecast - by Deployment Mode
- 10.3.1. On-Premises
- 10.3.2. Cloud
- 10.4. Market Analysis, Insights and Forecast - by Building Type
- 10.4.1. Residential Buildings
- 10.4.2. Commercial Buildings
- 10.4.3. Other Building Types
- 10.1. Market Analysis, Insights and Forecast - by Application
- 11. Competitive Analysis
- 11.1. Global Market Share Analysis 2025
- 11.2. Company Profiles
- 11.2.1 ICONICS Inc
- 11.2.1.1. Overview
- 11.2.1.2. Products
- 11.2.1.3. SWOT Analysis
- 11.2.1.4. Recent Developments
- 11.2.1.5. Financials (Based on Availability)
- 11.2.2 Honeywell International Inc
- 11.2.2.1. Overview
- 11.2.2.2. Products
- 11.2.2.3. SWOT Analysis
- 11.2.2.4. Recent Developments
- 11.2.2.5. Financials (Based on Availability)
- 11.2.3 BuildPulse Inc
- 11.2.3.1. Overview
- 11.2.3.2. Products
- 11.2.3.3. SWOT Analysis
- 11.2.3.4. Recent Developments
- 11.2.3.5. Financials (Based on Availability)
- 11.2.4 Delta Electronics Inc
- 11.2.4.1. Overview
- 11.2.4.2. Products
- 11.2.4.3. SWOT Analysis
- 11.2.4.4. Recent Developments
- 11.2.4.5. Financials (Based on Availability)
- 11.2.5 IBM Corporation
- 11.2.5.1. Overview
- 11.2.5.2. Products
- 11.2.5.3. SWOT Analysis
- 11.2.5.4. Recent Developments
- 11.2.5.5. Financials (Based on Availability)
- 11.2.6 Crestron Electronics*List Not Exhaustive
- 11.2.6.1. Overview
- 11.2.6.2. Products
- 11.2.6.3. SWOT Analysis
- 11.2.6.4. Recent Developments
- 11.2.6.5. Financials (Based on Availability)
- 11.2.7 Noveda Technologies Inc
- 11.2.7.1. Overview
- 11.2.7.2. Products
- 11.2.7.3. SWOT Analysis
- 11.2.7.4. Recent Developments
- 11.2.7.5. Financials (Based on Availability)
- 11.2.8 CopperTree Analytics Inc
- 11.2.8.1. Overview
- 11.2.8.2. Products
- 11.2.8.3. SWOT Analysis
- 11.2.8.4. Recent Developments
- 11.2.8.5. Financials (Based on Availability)
- 11.2.9 Johnson Controls International Plc
- 11.2.9.1. Overview
- 11.2.9.2. Products
- 11.2.9.3. SWOT Analysis
- 11.2.9.4. Recent Developments
- 11.2.9.5. Financials (Based on Availability)
- 11.2.10 Siemens AG
- 11.2.10.1. Overview
- 11.2.10.2. Products
- 11.2.10.3. SWOT Analysis
- 11.2.10.4. Recent Developments
- 11.2.10.5. Financials (Based on Availability)
- 11.2.11 BuildingIQ
- 11.2.11.1. Overview
- 11.2.11.2. Products
- 11.2.11.3. SWOT Analysis
- 11.2.11.4. Recent Developments
- 11.2.11.5. Financials (Based on Availability)
- 11.2.12 GridPoint Inc
- 11.2.12.1. Overview
- 11.2.12.2. Products
- 11.2.12.3. SWOT Analysis
- 11.2.12.4. Recent Developments
- 11.2.12.5. Financials (Based on Availability)
- 11.2.13 Schneider Electric
- 11.2.13.1. Overview
- 11.2.13.2. Products
- 11.2.13.3. SWOT Analysis
- 11.2.13.4. Recent Developments
- 11.2.13.5. Financials (Based on Availability)
- 11.2.14 ENGIE Insight Services Inc
- 11.2.14.1. Overview
- 11.2.14.2. Products
- 11.2.14.3. SWOT Analysis
- 11.2.14.4. Recent Developments
- 11.2.14.5. Financials (Based on Availability)
- 11.2.15 General Electric Company
- 11.2.15.1. Overview
- 11.2.15.2. Products
- 11.2.15.3. SWOT Analysis
- 11.2.15.4. Recent Developments
- 11.2.15.5. Financials (Based on Availability)
- 11.2.1 ICONICS Inc
List of Figures
- Figure 1: Global Building Analytics Market Revenue Breakdown (undefined, %) by Region 2025 & 2033
- Figure 2: North America Building Analytics Market Revenue (undefined), by Application 2025 & 2033
- Figure 3: North America Building Analytics Market Revenue Share (%), by Application 2025 & 2033
- Figure 4: North America Building Analytics Market Revenue (undefined), by Component 2025 & 2033
- Figure 5: North America Building Analytics Market Revenue Share (%), by Component 2025 & 2033
- Figure 6: North America Building Analytics Market Revenue (undefined), by Deployment Mode 2025 & 2033
- Figure 7: North America Building Analytics Market Revenue Share (%), by Deployment Mode 2025 & 2033
- Figure 8: North America Building Analytics Market Revenue (undefined), by Building Type 2025 & 2033
- Figure 9: North America Building Analytics Market Revenue Share (%), by Building Type 2025 & 2033
- Figure 10: North America Building Analytics Market Revenue (undefined), by Country 2025 & 2033
- Figure 11: North America Building Analytics Market Revenue Share (%), by Country 2025 & 2033
- Figure 12: Europe Building Analytics Market Revenue (undefined), by Application 2025 & 2033
- Figure 13: Europe Building Analytics Market Revenue Share (%), by Application 2025 & 2033
- Figure 14: Europe Building Analytics Market Revenue (undefined), by Component 2025 & 2033
- Figure 15: Europe Building Analytics Market Revenue Share (%), by Component 2025 & 2033
- Figure 16: Europe Building Analytics Market Revenue (undefined), by Deployment Mode 2025 & 2033
- Figure 17: Europe Building Analytics Market Revenue Share (%), by Deployment Mode 2025 & 2033
- Figure 18: Europe Building Analytics Market Revenue (undefined), by Building Type 2025 & 2033
- Figure 19: Europe Building Analytics Market Revenue Share (%), by Building Type 2025 & 2033
- Figure 20: Europe Building Analytics Market Revenue (undefined), by Country 2025 & 2033
- Figure 21: Europe Building Analytics Market Revenue Share (%), by Country 2025 & 2033
- Figure 22: Asia Pacific Building Analytics Market Revenue (undefined), by Application 2025 & 2033
- Figure 23: Asia Pacific Building Analytics Market Revenue Share (%), by Application 2025 & 2033
- Figure 24: Asia Pacific Building Analytics Market Revenue (undefined), by Component 2025 & 2033
- Figure 25: Asia Pacific Building Analytics Market Revenue Share (%), by Component 2025 & 2033
- Figure 26: Asia Pacific Building Analytics Market Revenue (undefined), by Deployment Mode 2025 & 2033
- Figure 27: Asia Pacific Building Analytics Market Revenue Share (%), by Deployment Mode 2025 & 2033
- Figure 28: Asia Pacific Building Analytics Market Revenue (undefined), by Building Type 2025 & 2033
- Figure 29: Asia Pacific Building Analytics Market Revenue Share (%), by Building Type 2025 & 2033
- Figure 30: Asia Pacific Building Analytics Market Revenue (undefined), by Country 2025 & 2033
- Figure 31: Asia Pacific Building Analytics Market Revenue Share (%), by Country 2025 & 2033
- Figure 32: Latin America Building Analytics Market Revenue (undefined), by Application 2025 & 2033
- Figure 33: Latin America Building Analytics Market Revenue Share (%), by Application 2025 & 2033
- Figure 34: Latin America Building Analytics Market Revenue (undefined), by Component 2025 & 2033
- Figure 35: Latin America Building Analytics Market Revenue Share (%), by Component 2025 & 2033
- Figure 36: Latin America Building Analytics Market Revenue (undefined), by Deployment Mode 2025 & 2033
- Figure 37: Latin America Building Analytics Market Revenue Share (%), by Deployment Mode 2025 & 2033
- Figure 38: Latin America Building Analytics Market Revenue (undefined), by Building Type 2025 & 2033
- Figure 39: Latin America Building Analytics Market Revenue Share (%), by Building Type 2025 & 2033
- Figure 40: Latin America Building Analytics Market Revenue (undefined), by Country 2025 & 2033
- Figure 41: Latin America Building Analytics Market Revenue Share (%), by Country 2025 & 2033
- Figure 42: Middle East and Africa Building Analytics Market Revenue (undefined), by Application 2025 & 2033
- Figure 43: Middle East and Africa Building Analytics Market Revenue Share (%), by Application 2025 & 2033
- Figure 44: Middle East and Africa Building Analytics Market Revenue (undefined), by Component 2025 & 2033
- Figure 45: Middle East and Africa Building Analytics Market Revenue Share (%), by Component 2025 & 2033
- Figure 46: Middle East and Africa Building Analytics Market Revenue (undefined), by Deployment Mode 2025 & 2033
- Figure 47: Middle East and Africa Building Analytics Market Revenue Share (%), by Deployment Mode 2025 & 2033
- Figure 48: Middle East and Africa Building Analytics Market Revenue (undefined), by Building Type 2025 & 2033
- Figure 49: Middle East and Africa Building Analytics Market Revenue Share (%), by Building Type 2025 & 2033
- Figure 50: Middle East and Africa Building Analytics Market Revenue (undefined), by Country 2025 & 2033
- Figure 51: Middle East and Africa Building Analytics Market Revenue Share (%), by Country 2025 & 2033
List of Tables
- Table 1: Global Building Analytics Market Revenue undefined Forecast, by Application 2020 & 2033
- Table 2: Global Building Analytics Market Revenue undefined Forecast, by Component 2020 & 2033
- Table 3: Global Building Analytics Market Revenue undefined Forecast, by Deployment Mode 2020 & 2033
- Table 4: Global Building Analytics Market Revenue undefined Forecast, by Building Type 2020 & 2033
- Table 5: Global Building Analytics Market Revenue undefined Forecast, by Region 2020 & 2033
- Table 6: Global Building Analytics Market Revenue undefined Forecast, by Application 2020 & 2033
- Table 7: Global Building Analytics Market Revenue undefined Forecast, by Component 2020 & 2033
- Table 8: Global Building Analytics Market Revenue undefined Forecast, by Deployment Mode 2020 & 2033
- Table 9: Global Building Analytics Market Revenue undefined Forecast, by Building Type 2020 & 2033
- Table 10: Global Building Analytics Market Revenue undefined Forecast, by Country 2020 & 2033
- Table 11: Global Building Analytics Market Revenue undefined Forecast, by Application 2020 & 2033
- Table 12: Global Building Analytics Market Revenue undefined Forecast, by Component 2020 & 2033
- Table 13: Global Building Analytics Market Revenue undefined Forecast, by Deployment Mode 2020 & 2033
- Table 14: Global Building Analytics Market Revenue undefined Forecast, by Building Type 2020 & 2033
- Table 15: Global Building Analytics Market Revenue undefined Forecast, by Country 2020 & 2033
- Table 16: Global Building Analytics Market Revenue undefined Forecast, by Application 2020 & 2033
- Table 17: Global Building Analytics Market Revenue undefined Forecast, by Component 2020 & 2033
- Table 18: Global Building Analytics Market Revenue undefined Forecast, by Deployment Mode 2020 & 2033
- Table 19: Global Building Analytics Market Revenue undefined Forecast, by Building Type 2020 & 2033
- Table 20: Global Building Analytics Market Revenue undefined Forecast, by Country 2020 & 2033
- Table 21: Global Building Analytics Market Revenue undefined Forecast, by Application 2020 & 2033
- Table 22: Global Building Analytics Market Revenue undefined Forecast, by Component 2020 & 2033
- Table 23: Global Building Analytics Market Revenue undefined Forecast, by Deployment Mode 2020 & 2033
- Table 24: Global Building Analytics Market Revenue undefined Forecast, by Building Type 2020 & 2033
- Table 25: Global Building Analytics Market Revenue undefined Forecast, by Country 2020 & 2033
- Table 26: Global Building Analytics Market Revenue undefined Forecast, by Application 2020 & 2033
- Table 27: Global Building Analytics Market Revenue undefined Forecast, by Component 2020 & 2033
- Table 28: Global Building Analytics Market Revenue undefined Forecast, by Deployment Mode 2020 & 2033
- Table 29: Global Building Analytics Market Revenue undefined Forecast, by Building Type 2020 & 2033
- Table 30: Global Building Analytics Market Revenue undefined Forecast, by Country 2020 & 2033
Frequently Asked Questions
1. What is the projected Compound Annual Growth Rate (CAGR) of the Building Analytics Market?
The projected CAGR is approximately 13.67%.
2. Which companies are prominent players in the Building Analytics Market?
Key companies in the market include ICONICS Inc, Honeywell International Inc, BuildPulse Inc, Delta Electronics Inc, IBM Corporation, Crestron Electronics*List Not Exhaustive, Noveda Technologies Inc, CopperTree Analytics Inc, Johnson Controls International Plc, Siemens AG, BuildingIQ, GridPoint Inc, Schneider Electric, ENGIE Insight Services Inc, General Electric Company.
3. What are the main segments of the Building Analytics Market?
The market segments include Application, Component , Deployment Mode, Building Type.
4. Can you provide details about the market size?
The market size is estimated to be USD XXX N/A as of 2022.
5. What are some drivers contributing to market growth?
; Increased Demand for Energy-Efficient Systems; Growing Adoption of Cloud-Based IoT Platforms.
6. What are the notable trends driving market growth?
Energy Management Application to Hold the Largest Market Size.
7. Are there any restraints impacting market growth?
; High Cost of Implementation.
8. Can you provide examples of recent developments in the market?
N/A
9. What pricing options are available for accessing the report?
Pricing options include single-user, multi-user, and enterprise licenses priced at USD 4750, USD 5250, and USD 8750 respectively.
10. Is the market size provided in terms of value or volume?
The market size is provided in terms of value, measured in N/A.
11. Are there any specific market keywords associated with the report?
Yes, the market keyword associated with the report is "Building Analytics Market," which aids in identifying and referencing the specific market segment covered.
12. How do I determine which pricing option suits my needs best?
The pricing options vary based on user requirements and access needs. Individual users may opt for single-user licenses, while businesses requiring broader access may choose multi-user or enterprise licenses for cost-effective access to the report.
13. Are there any additional resources or data provided in the Building Analytics Market report?
While the report offers comprehensive insights, it's advisable to review the specific contents or supplementary materials provided to ascertain if additional resources or data are available.
14. How can I stay updated on further developments or reports in the Building Analytics Market?
To stay informed about further developments, trends, and reports in the Building Analytics Market, consider subscribing to industry newsletters, following relevant companies and organizations, or regularly checking reputable industry news sources and publications.
Methodology
Step 1 - Identification of Relevant Samples Size from Population Database


Step 2 - Approaches for Defining Global Market Size (Value, Volume* & Price*)

Note*: In applicable scenarios
Step 3 - Data Sources
Primary Research
- Web Analytics
- Survey Reports
- Research Institute
- Latest Research Reports
- Opinion Leaders
Secondary Research
- Annual Reports
- White Paper
- Latest Press Release
- Industry Association
- Paid Database
- Investor Presentations

Step 4 - Data Triangulation
Involves using different sources of information in order to increase the validity of a study
These sources are likely to be stakeholders in a program - participants, other researchers, program staff, other community members, and so on.
Then we put all data in single framework & apply various statistical tools to find out the dynamic on the market.
During the analysis stage, feedback from the stakeholder groups would be compared to determine areas of agreement as well as areas of divergence