

Key Insights
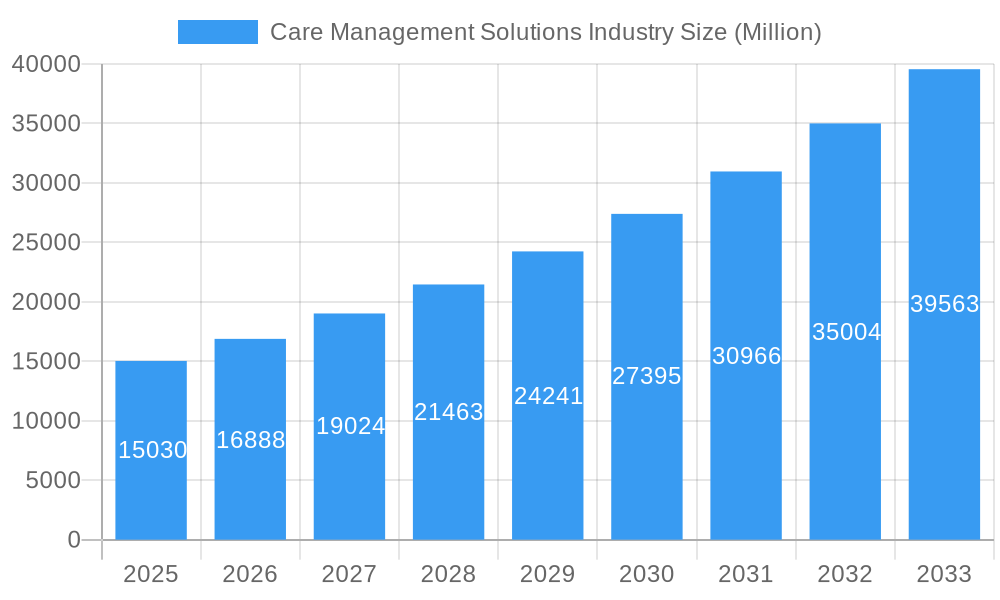
The Care Management Solutions market, valued at $15.03 billion in 2025, is projected to experience robust growth, driven by a compound annual growth rate (CAGR) of 12.23% from 2025 to 2033. This expansion is fueled by several key factors. The increasing prevalence of chronic diseases globally necessitates proactive and efficient care management, boosting demand for sophisticated software and services. Furthermore, the rising adoption of value-based care models by healthcare payers and providers incentivizes the use of these solutions to improve patient outcomes and reduce healthcare costs. Technological advancements, particularly in cloud-based and web-based platforms, are enhancing accessibility and scalability, further accelerating market growth. The market is segmented by application (Chronic Care Management, Disease Management, Utilization Management), end-user (Healthcare Payers, Healthcare Providers, Other End Users), component (Software, Services), and delivery mode (Cloud-based and Web-based, On-premise). North America currently holds a significant market share, driven by advanced healthcare infrastructure and early adoption of innovative technologies. However, the Asia-Pacific region is anticipated to witness substantial growth in the coming years due to expanding healthcare expenditure and rising technological penetration.
Care Management Solutions Industry Market Size (In Billion)
The competitive landscape includes established players like IBM (through Phytel), Cognizant, Optum, and EPIC, alongside specialized firms such as Zeomega, Meddecision, and Convey Health Solutions. These companies are constantly innovating to offer comprehensive solutions incorporating advanced analytics, AI-powered predictive modeling, and seamless integration with existing healthcare systems. Despite the positive outlook, market growth could face some challenges. Data privacy concerns, the complexity of integrating diverse healthcare systems, and the need for significant upfront investments in technology and infrastructure could potentially restrain market expansion. However, the long-term benefits of improved patient outcomes, cost reduction, and enhanced operational efficiency are expected to outweigh these challenges, ensuring continued market growth throughout the forecast period.
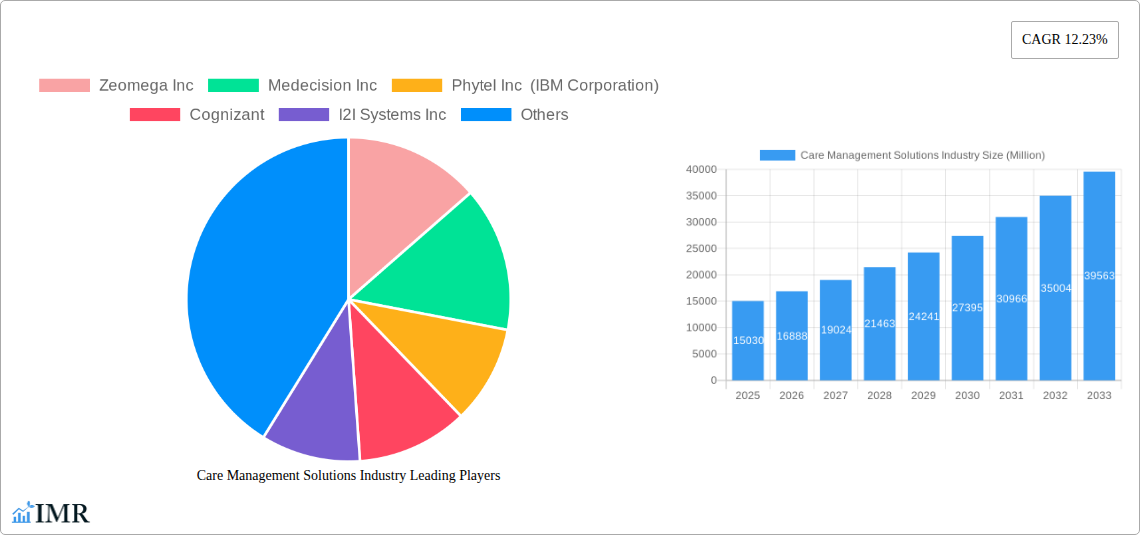
Care Management Solutions Industry Company Market Share
Care Management Solutions Market Report: 2019-2033
This comprehensive report provides a detailed analysis of the Care Management Solutions industry, covering market dynamics, growth trends, regional insights, competitive landscape, and future outlook. With a study period spanning 2019-2033, a base year of 2025, and a forecast period of 2025-2033, this report is an indispensable resource for industry professionals, investors, and strategic decision-makers. The report utilizes data from 2019-2024 as its historical period and presents insights into the parent market (Healthcare IT) and child markets (Chronic Care Management, Disease Management, Utilization Management). The market size is presented in million USD.
Care Management Solutions Industry Market Dynamics & Structure
The Care Management Solutions market is characterized by moderate concentration, with key players holding significant market share, but also fostering healthy competition. The market's growth is driven by technological innovation, particularly in AI and telehealth integration, alongside stringent regulatory frameworks pushing for improved care coordination and cost reduction. Competitive product substitutes, such as traditional in-person care models, are facing pressure due to increasing demand for remote, efficient, and data-driven solutions. End-user demographics are shifting towards an aging population requiring more comprehensive care management, fueling market growth. M&A activity is prevalent, with several large players acquiring smaller firms to expand their service offerings and geographic reach.
- Market Concentration: Moderately concentrated, with the top 5 players holding approximately xx% of the market share in 2025.
- Technological Drivers: AI-powered analytics, telehealth integration, remote patient monitoring (RPM), and blockchain for data security.
- Regulatory Landscape: HIPAA compliance, interoperability standards, and government initiatives promoting value-based care.
- Competitive Substitutes: Traditional in-person care, less sophisticated software solutions.
- M&A Activity: An estimated xx M&A deals in the last five years, with a focus on expanding capabilities and geographic reach. (Deal volume may vary depending on the data source).
- Innovation Barriers: High initial investment costs for technology adoption, data integration challenges, and resistance to change among healthcare providers.
Care Management Solutions Industry Growth Trends & Insights
The Care Management Solutions market exhibited strong growth during the historical period (2019-2024), with a Compound Annual Growth Rate (CAGR) of xx%. This growth is attributed to the increasing prevalence of chronic diseases, rising healthcare costs, and a growing adoption of value-based care models. The market is expected to continue its expansion during the forecast period (2025-2033), with a projected CAGR of xx%. This continued growth is driven by several factors, including the increasing penetration of telehealth, advancements in predictive analytics, and a growing emphasis on patient engagement. The adoption rate of care management solutions is expected to increase significantly in the coming years, driven by both payers and providers looking to improve care quality and efficiency. Technological disruptions, like the rise of AI-powered solutions, are reshaping the market and enabling more personalized and proactive care approaches. Consumer behavior is evolving towards a preference for remote and convenient care options, reinforcing the market's upward trajectory.
- Market Size (2025): xx Million
- Market Size (2033): xx Million
- CAGR (2025-2033): xx%
- Market Penetration (2025): xx%
Dominant Regions, Countries, or Segments in Care Management Solutions Industry
North America currently dominates the Care Management Solutions market, driven by high healthcare expenditure, advanced technological infrastructure, and a favorable regulatory environment. Within this region, the United States holds the largest share due to its large population, high prevalence of chronic diseases, and robust healthcare IT adoption. However, significant growth potential exists in other regions, particularly in Europe and Asia Pacific. Within the segments, Chronic Care Management is the largest application segment due to the rising incidence of chronic diseases such as diabetes and heart disease. Healthcare payers are the largest end-user segment due to their focus on cost containment and improved care quality. Software solutions constitute the largest component segment due to the increasing adoption of cloud-based and web-based solutions. Cloud-based and web-based delivery models are leading the way due to their scalability, flexibility, and cost-effectiveness.
Leading Region: North America (United States)
Largest Application Segment: Chronic Care Management
Largest End-User Segment: Healthcare Payers
Largest Component Segment: Software
Largest Delivery Mode: Cloud-based and Web-based
Key Drivers (North America): High healthcare expenditure, advanced IT infrastructure, strong government support for digital health initiatives.
Key Drivers (Europe): Growing adoption of telehealth, increasing focus on cost-efficiency within healthcare systems, supportive regulatory frameworks.
Key Drivers (Asia Pacific): Rising prevalence of chronic diseases, increasing healthcare expenditure, government investments in digital health infrastructure.
Care Management Solutions Industry Product Landscape
The Care Management Solutions market offers a diverse range of products, from basic patient monitoring systems to sophisticated AI-powered platforms capable of predictive analytics and personalized care planning. Product innovation focuses on improving user experience, integrating various data sources, and enhancing clinical decision support capabilities. Key features include robust reporting and analytics dashboards, seamless integration with electronic health records (EHRs), and secure data management capabilities. Unique selling propositions frequently focus on personalization, predictive capabilities, and cost-effectiveness demonstrated through improved patient outcomes.
Key Drivers, Barriers & Challenges in Care Management Solutions Industry
Key Drivers: The rising prevalence of chronic diseases, increasing healthcare costs, the growing adoption of value-based care, and advancements in technology are the primary drivers of market growth. Government initiatives supporting digital health and interoperability further stimulate adoption. The demand for remote patient monitoring (RPM) and telehealth solutions is also contributing significantly.
Challenges and Restraints: High initial investment costs associated with implementing new care management systems, data integration difficulties, and concerns about data security and privacy represent significant barriers. Resistance to change among healthcare providers and the lack of interoperability between different systems further impede market growth. Supply chain disruptions impacting technology procurement and cybersecurity threats are emerging challenges with a potential xx% impact on the market in 2025.
Emerging Opportunities in Care Management Solutions Industry
Untapped markets in developing economies, the integration of artificial intelligence (AI) and machine learning (ML) for improved predictive capabilities, and increased focus on preventative care offer significant opportunities. The rise of virtual care and the integration of wearable devices for remote patient monitoring represent additional growth avenues. An expanding focus on population health management and personalized medicine will shape future demand.
Growth Accelerators in the Care Management Solutions Industry
Technological breakthroughs in AI, ML, and IoT, strategic partnerships between technology providers and healthcare organizations, and market expansion into underserved regions will propel long-term growth. Continued investment in research and development, the development of user-friendly interfaces, and a greater emphasis on improving patient engagement will also contribute to market expansion.
Key Players Shaping the Care Management Solutions Market
- Zeomega Inc
- Medecision Inc
- Phytel Inc (IBM Corporation)
- Cognizant
- I2I Systems Inc
- Centene Corporation (Evolve)
- Veradigm
- Infomc
- Infosys Limited
- Convey Health Solutions
- Optum Inc
- EPIC Corporation Inc
- Exl Healthcare
- Hinduja Global Solutions Limited
Notable Milestones in Care Management Solutions Industry Sector
- April 2023: Medecision launched Aerial Social Care Coordinator, enhancing social determinant of health (SDOH) insights for health plans and providers.
- March 2023: Royal Philips launched Philips Virtual Care Management, offering flexible solutions to improve patient engagement and reduce hospital strain.
In-Depth Care Management Solutions Industry Market Outlook
The Care Management Solutions market is poised for continued strong growth, fueled by technological advancements, increasing demand for remote care, and a growing emphasis on value-based healthcare. Strategic partnerships, expansion into emerging markets, and the development of innovative solutions will shape future market dynamics. The market’s long-term potential is significant, driven by the escalating global healthcare burden and the persistent need for cost-effective, high-quality care.
Care Management Solutions Industry Segmentation
-
1. Component
- 1.1. Software
- 1.2. Services
-
2. Delivery Mode
- 2.1. Cloud-based and Web-based
- 2.2. On-premise
-
3. Application
- 3.1. Chronic Care Management
- 3.2. Disease Management
- 3.3. Utilization Management
-
4. End User
- 4.1. Healthcare Payers
- 4.2. Healthcare Providers
- 4.3. Other End Users
Care Management Solutions Industry Segmentation By Geography
-
1. North America
- 1.1. United States
- 1.2. Canada
- 1.3. Mexico
-
2. Europe
- 2.1. Germany
- 2.2. United Kindom
- 2.3. France
- 2.4. Italy
- 2.5. Spain
- 2.6. Rest of Europe
-
3. Asia Pacific
- 3.1. China
- 3.2. Japan
- 3.3. India
- 3.4. Australia
- 3.5. South Korea
- 3.6. Rest of Asia Pacific
- 4. Middle East
-
5. GCC
- 5.1. South Africa
- 5.2. Rest of Middle East and Africa
-
6. South America
- 6.1. Brazil
- 6.2. Argentina
- 6.3. Rest of South America
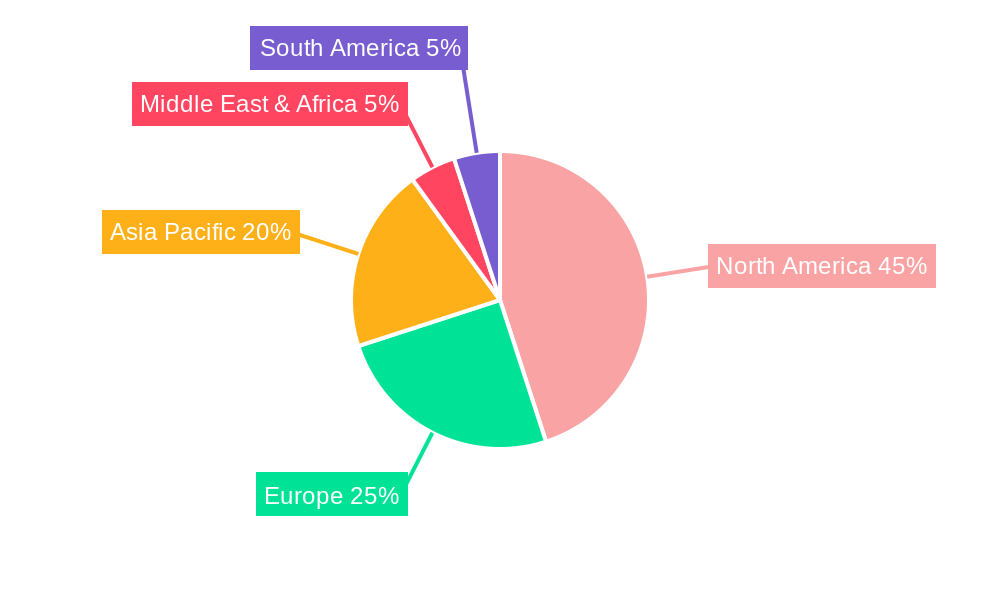
Care Management Solutions Industry Regional Market Share
Geographic Coverage of Care Management Solutions Industry
Care Management Solutions Industry REPORT HIGHLIGHTS
| Aspects | Details |
|---|---|
| Study Period | 2020-2034 |
| Base Year | 2025 |
| Estimated Year | 2026 |
| Forecast Period | 2026-2034 |
| Historical Period | 2020-2025 |
| Growth Rate | CAGR of 12.23% from 2020-2034 |
| Segmentation |
|
Table of Contents
- 1. Introduction
- 1.1. Research Scope
- 1.2. Market Segmentation
- 1.3. Research Methodology
- 1.4. Definitions and Assumptions
- 2. Executive Summary
- 2.1. Introduction
- 3. Market Dynamics
- 3.1. Introduction
- 3.2. Market Drivers
- 3.2.1. Rising Geriatric Population and Burden of Chronic Diseases; Care Management Solutions Offer a Means to Reduce Healthcare Costs; Government Initiatives on Healthcare Services and Infrastructure
- 3.3. Market Restrains
- 3.3.1. High Investments Required for Supporting Infrastructure; Data Security Concerns Related to Cloud-based Solutions
- 3.4. Market Trends
- 3.4.1. Chronic Care Management Segment Expected to Hold a Significant Share in the Care Management Solutions Market
- 4. Market Factor Analysis
- 4.1. Porters Five Forces
- 4.2. Supply/Value Chain
- 4.3. PESTEL analysis
- 4.4. Market Entropy
- 4.5. Patent/Trademark Analysis
- 5. Global Care Management Solutions Industry Analysis, Insights and Forecast, 2020-2032
- 5.1. Market Analysis, Insights and Forecast - by Component
- 5.1.1. Software
- 5.1.2. Services
- 5.2. Market Analysis, Insights and Forecast - by Delivery Mode
- 5.2.1. Cloud-based and Web-based
- 5.2.2. On-premise
- 5.3. Market Analysis, Insights and Forecast - by Application
- 5.3.1. Chronic Care Management
- 5.3.2. Disease Management
- 5.3.3. Utilization Management
- 5.4. Market Analysis, Insights and Forecast - by End User
- 5.4.1. Healthcare Payers
- 5.4.2. Healthcare Providers
- 5.4.3. Other End Users
- 5.5. Market Analysis, Insights and Forecast - by Region
- 5.5.1. North America
- 5.5.2. Europe
- 5.5.3. Asia Pacific
- 5.5.4. Middle East
- 5.5.5. GCC
- 5.5.6. South America
- 5.1. Market Analysis, Insights and Forecast - by Component
- 6. North America Care Management Solutions Industry Analysis, Insights and Forecast, 2020-2032
- 6.1. Market Analysis, Insights and Forecast - by Component
- 6.1.1. Software
- 6.1.2. Services
- 6.2. Market Analysis, Insights and Forecast - by Delivery Mode
- 6.2.1. Cloud-based and Web-based
- 6.2.2. On-premise
- 6.3. Market Analysis, Insights and Forecast - by Application
- 6.3.1. Chronic Care Management
- 6.3.2. Disease Management
- 6.3.3. Utilization Management
- 6.4. Market Analysis, Insights and Forecast - by End User
- 6.4.1. Healthcare Payers
- 6.4.2. Healthcare Providers
- 6.4.3. Other End Users
- 6.1. Market Analysis, Insights and Forecast - by Component
- 7. Europe Care Management Solutions Industry Analysis, Insights and Forecast, 2020-2032
- 7.1. Market Analysis, Insights and Forecast - by Component
- 7.1.1. Software
- 7.1.2. Services
- 7.2. Market Analysis, Insights and Forecast - by Delivery Mode
- 7.2.1. Cloud-based and Web-based
- 7.2.2. On-premise
- 7.3. Market Analysis, Insights and Forecast - by Application
- 7.3.1. Chronic Care Management
- 7.3.2. Disease Management
- 7.3.3. Utilization Management
- 7.4. Market Analysis, Insights and Forecast - by End User
- 7.4.1. Healthcare Payers
- 7.4.2. Healthcare Providers
- 7.4.3. Other End Users
- 7.1. Market Analysis, Insights and Forecast - by Component
- 8. Asia Pacific Care Management Solutions Industry Analysis, Insights and Forecast, 2020-2032
- 8.1. Market Analysis, Insights and Forecast - by Component
- 8.1.1. Software
- 8.1.2. Services
- 8.2. Market Analysis, Insights and Forecast - by Delivery Mode
- 8.2.1. Cloud-based and Web-based
- 8.2.2. On-premise
- 8.3. Market Analysis, Insights and Forecast - by Application
- 8.3.1. Chronic Care Management
- 8.3.2. Disease Management
- 8.3.3. Utilization Management
- 8.4. Market Analysis, Insights and Forecast - by End User
- 8.4.1. Healthcare Payers
- 8.4.2. Healthcare Providers
- 8.4.3. Other End Users
- 8.1. Market Analysis, Insights and Forecast - by Component
- 9. Middle East Care Management Solutions Industry Analysis, Insights and Forecast, 2020-2032
- 9.1. Market Analysis, Insights and Forecast - by Component
- 9.1.1. Software
- 9.1.2. Services
- 9.2. Market Analysis, Insights and Forecast - by Delivery Mode
- 9.2.1. Cloud-based and Web-based
- 9.2.2. On-premise
- 9.3. Market Analysis, Insights and Forecast - by Application
- 9.3.1. Chronic Care Management
- 9.3.2. Disease Management
- 9.3.3. Utilization Management
- 9.4. Market Analysis, Insights and Forecast - by End User
- 9.4.1. Healthcare Payers
- 9.4.2. Healthcare Providers
- 9.4.3. Other End Users
- 9.1. Market Analysis, Insights and Forecast - by Component
- 10. GCC Care Management Solutions Industry Analysis, Insights and Forecast, 2020-2032
- 10.1. Market Analysis, Insights and Forecast - by Component
- 10.1.1. Software
- 10.1.2. Services
- 10.2. Market Analysis, Insights and Forecast - by Delivery Mode
- 10.2.1. Cloud-based and Web-based
- 10.2.2. On-premise
- 10.3. Market Analysis, Insights and Forecast - by Application
- 10.3.1. Chronic Care Management
- 10.3.2. Disease Management
- 10.3.3. Utilization Management
- 10.4. Market Analysis, Insights and Forecast - by End User
- 10.4.1. Healthcare Payers
- 10.4.2. Healthcare Providers
- 10.4.3. Other End Users
- 10.1. Market Analysis, Insights and Forecast - by Component
- 11. South America Care Management Solutions Industry Analysis, Insights and Forecast, 2020-2032
- 11.1. Market Analysis, Insights and Forecast - by Component
- 11.1.1. Software
- 11.1.2. Services
- 11.2. Market Analysis, Insights and Forecast - by Delivery Mode
- 11.2.1. Cloud-based and Web-based
- 11.2.2. On-premise
- 11.3. Market Analysis, Insights and Forecast - by Application
- 11.3.1. Chronic Care Management
- 11.3.2. Disease Management
- 11.3.3. Utilization Management
- 11.4. Market Analysis, Insights and Forecast - by End User
- 11.4.1. Healthcare Payers
- 11.4.2. Healthcare Providers
- 11.4.3. Other End Users
- 11.1. Market Analysis, Insights and Forecast - by Component
- 12. Competitive Analysis
- 12.1. Global Market Share Analysis 2025
- 12.2. Company Profiles
- 12.2.1 Zeomega Inc
- 12.2.1.1. Overview
- 12.2.1.2. Products
- 12.2.1.3. SWOT Analysis
- 12.2.1.4. Recent Developments
- 12.2.1.5. Financials (Based on Availability)
- 12.2.2 Medecision Inc
- 12.2.2.1. Overview
- 12.2.2.2. Products
- 12.2.2.3. SWOT Analysis
- 12.2.2.4. Recent Developments
- 12.2.2.5. Financials (Based on Availability)
- 12.2.3 Phytel Inc (IBM Corporation)
- 12.2.3.1. Overview
- 12.2.3.2. Products
- 12.2.3.3. SWOT Analysis
- 12.2.3.4. Recent Developments
- 12.2.3.5. Financials (Based on Availability)
- 12.2.4 Cognizant
- 12.2.4.1. Overview
- 12.2.4.2. Products
- 12.2.4.3. SWOT Analysis
- 12.2.4.4. Recent Developments
- 12.2.4.5. Financials (Based on Availability)
- 12.2.5 I2I Systems Inc
- 12.2.5.1. Overview
- 12.2.5.2. Products
- 12.2.5.3. SWOT Analysis
- 12.2.5.4. Recent Developments
- 12.2.5.5. Financials (Based on Availability)
- 12.2.6 Centene Corporation (Evolve)
- 12.2.6.1. Overview
- 12.2.6.2. Products
- 12.2.6.3. SWOT Analysis
- 12.2.6.4. Recent Developments
- 12.2.6.5. Financials (Based on Availability)
- 12.2.7 Veradigm
- 12.2.7.1. Overview
- 12.2.7.2. Products
- 12.2.7.3. SWOT Analysis
- 12.2.7.4. Recent Developments
- 12.2.7.5. Financials (Based on Availability)
- 12.2.8 InfoMC
- 12.2.8.1. Overview
- 12.2.8.2. Products
- 12.2.8.3. SWOT Analysis
- 12.2.8.4. Recent Developments
- 12.2.8.5. Financials (Based on Availability)
- 12.2.9 Infosys Limited
- 12.2.9.1. Overview
- 12.2.9.2. Products
- 12.2.9.3. SWOT Analysis
- 12.2.9.4. Recent Developments
- 12.2.9.5. Financials (Based on Availability)
- 12.2.10 Convey Health Solutions
- 12.2.10.1. Overview
- 12.2.10.2. Products
- 12.2.10.3. SWOT Analysis
- 12.2.10.4. Recent Developments
- 12.2.10.5. Financials (Based on Availability)
- 12.2.11 Optum Inc
- 12.2.11.1. Overview
- 12.2.11.2. Products
- 12.2.11.3. SWOT Analysis
- 12.2.11.4. Recent Developments
- 12.2.11.5. Financials (Based on Availability)
- 12.2.12 EPIC Corporation Inc
- 12.2.12.1. Overview
- 12.2.12.2. Products
- 12.2.12.3. SWOT Analysis
- 12.2.12.4. Recent Developments
- 12.2.12.5. Financials (Based on Availability)
- 12.2.13 Exl Healthcare
- 12.2.13.1. Overview
- 12.2.13.2. Products
- 12.2.13.3. SWOT Analysis
- 12.2.13.4. Recent Developments
- 12.2.13.5. Financials (Based on Availability)
- 12.2.14 Hinduja Global Solutions Limited
- 12.2.14.1. Overview
- 12.2.14.2. Products
- 12.2.14.3. SWOT Analysis
- 12.2.14.4. Recent Developments
- 12.2.14.5. Financials (Based on Availability)
- 12.2.1 Zeomega Inc
List of Figures
- Figure 1: Global Care Management Solutions Industry Revenue Breakdown (Million, %) by Region 2025 & 2033
- Figure 2: Global Care Management Solutions Industry Volume Breakdown (K Unit, %) by Region 2025 & 2033
- Figure 3: North America Care Management Solutions Industry Revenue (Million), by Component 2025 & 2033
- Figure 4: North America Care Management Solutions Industry Volume (K Unit), by Component 2025 & 2033
- Figure 5: North America Care Management Solutions Industry Revenue Share (%), by Component 2025 & 2033
- Figure 6: North America Care Management Solutions Industry Volume Share (%), by Component 2025 & 2033
- Figure 7: North America Care Management Solutions Industry Revenue (Million), by Delivery Mode 2025 & 2033
- Figure 8: North America Care Management Solutions Industry Volume (K Unit), by Delivery Mode 2025 & 2033
- Figure 9: North America Care Management Solutions Industry Revenue Share (%), by Delivery Mode 2025 & 2033
- Figure 10: North America Care Management Solutions Industry Volume Share (%), by Delivery Mode 2025 & 2033
- Figure 11: North America Care Management Solutions Industry Revenue (Million), by Application 2025 & 2033
- Figure 12: North America Care Management Solutions Industry Volume (K Unit), by Application 2025 & 2033
- Figure 13: North America Care Management Solutions Industry Revenue Share (%), by Application 2025 & 2033
- Figure 14: North America Care Management Solutions Industry Volume Share (%), by Application 2025 & 2033
- Figure 15: North America Care Management Solutions Industry Revenue (Million), by End User 2025 & 2033
- Figure 16: North America Care Management Solutions Industry Volume (K Unit), by End User 2025 & 2033
- Figure 17: North America Care Management Solutions Industry Revenue Share (%), by End User 2025 & 2033
- Figure 18: North America Care Management Solutions Industry Volume Share (%), by End User 2025 & 2033
- Figure 19: North America Care Management Solutions Industry Revenue (Million), by Country 2025 & 2033
- Figure 20: North America Care Management Solutions Industry Volume (K Unit), by Country 2025 & 2033
- Figure 21: North America Care Management Solutions Industry Revenue Share (%), by Country 2025 & 2033
- Figure 22: North America Care Management Solutions Industry Volume Share (%), by Country 2025 & 2033
- Figure 23: Europe Care Management Solutions Industry Revenue (Million), by Component 2025 & 2033
- Figure 24: Europe Care Management Solutions Industry Volume (K Unit), by Component 2025 & 2033
- Figure 25: Europe Care Management Solutions Industry Revenue Share (%), by Component 2025 & 2033
- Figure 26: Europe Care Management Solutions Industry Volume Share (%), by Component 2025 & 2033
- Figure 27: Europe Care Management Solutions Industry Revenue (Million), by Delivery Mode 2025 & 2033
- Figure 28: Europe Care Management Solutions Industry Volume (K Unit), by Delivery Mode 2025 & 2033
- Figure 29: Europe Care Management Solutions Industry Revenue Share (%), by Delivery Mode 2025 & 2033
- Figure 30: Europe Care Management Solutions Industry Volume Share (%), by Delivery Mode 2025 & 2033
- Figure 31: Europe Care Management Solutions Industry Revenue (Million), by Application 2025 & 2033
- Figure 32: Europe Care Management Solutions Industry Volume (K Unit), by Application 2025 & 2033
- Figure 33: Europe Care Management Solutions Industry Revenue Share (%), by Application 2025 & 2033
- Figure 34: Europe Care Management Solutions Industry Volume Share (%), by Application 2025 & 2033
- Figure 35: Europe Care Management Solutions Industry Revenue (Million), by End User 2025 & 2033
- Figure 36: Europe Care Management Solutions Industry Volume (K Unit), by End User 2025 & 2033
- Figure 37: Europe Care Management Solutions Industry Revenue Share (%), by End User 2025 & 2033
- Figure 38: Europe Care Management Solutions Industry Volume Share (%), by End User 2025 & 2033
- Figure 39: Europe Care Management Solutions Industry Revenue (Million), by Country 2025 & 2033
- Figure 40: Europe Care Management Solutions Industry Volume (K Unit), by Country 2025 & 2033
- Figure 41: Europe Care Management Solutions Industry Revenue Share (%), by Country 2025 & 2033
- Figure 42: Europe Care Management Solutions Industry Volume Share (%), by Country 2025 & 2033
- Figure 43: Asia Pacific Care Management Solutions Industry Revenue (Million), by Component 2025 & 2033
- Figure 44: Asia Pacific Care Management Solutions Industry Volume (K Unit), by Component 2025 & 2033
- Figure 45: Asia Pacific Care Management Solutions Industry Revenue Share (%), by Component 2025 & 2033
- Figure 46: Asia Pacific Care Management Solutions Industry Volume Share (%), by Component 2025 & 2033
- Figure 47: Asia Pacific Care Management Solutions Industry Revenue (Million), by Delivery Mode 2025 & 2033
- Figure 48: Asia Pacific Care Management Solutions Industry Volume (K Unit), by Delivery Mode 2025 & 2033
- Figure 49: Asia Pacific Care Management Solutions Industry Revenue Share (%), by Delivery Mode 2025 & 2033
- Figure 50: Asia Pacific Care Management Solutions Industry Volume Share (%), by Delivery Mode 2025 & 2033
- Figure 51: Asia Pacific Care Management Solutions Industry Revenue (Million), by Application 2025 & 2033
- Figure 52: Asia Pacific Care Management Solutions Industry Volume (K Unit), by Application 2025 & 2033
- Figure 53: Asia Pacific Care Management Solutions Industry Revenue Share (%), by Application 2025 & 2033
- Figure 54: Asia Pacific Care Management Solutions Industry Volume Share (%), by Application 2025 & 2033
- Figure 55: Asia Pacific Care Management Solutions Industry Revenue (Million), by End User 2025 & 2033
- Figure 56: Asia Pacific Care Management Solutions Industry Volume (K Unit), by End User 2025 & 2033
- Figure 57: Asia Pacific Care Management Solutions Industry Revenue Share (%), by End User 2025 & 2033
- Figure 58: Asia Pacific Care Management Solutions Industry Volume Share (%), by End User 2025 & 2033
- Figure 59: Asia Pacific Care Management Solutions Industry Revenue (Million), by Country 2025 & 2033
- Figure 60: Asia Pacific Care Management Solutions Industry Volume (K Unit), by Country 2025 & 2033
- Figure 61: Asia Pacific Care Management Solutions Industry Revenue Share (%), by Country 2025 & 2033
- Figure 62: Asia Pacific Care Management Solutions Industry Volume Share (%), by Country 2025 & 2033
- Figure 63: Middle East Care Management Solutions Industry Revenue (Million), by Component 2025 & 2033
- Figure 64: Middle East Care Management Solutions Industry Volume (K Unit), by Component 2025 & 2033
- Figure 65: Middle East Care Management Solutions Industry Revenue Share (%), by Component 2025 & 2033
- Figure 66: Middle East Care Management Solutions Industry Volume Share (%), by Component 2025 & 2033
- Figure 67: Middle East Care Management Solutions Industry Revenue (Million), by Delivery Mode 2025 & 2033
- Figure 68: Middle East Care Management Solutions Industry Volume (K Unit), by Delivery Mode 2025 & 2033
- Figure 69: Middle East Care Management Solutions Industry Revenue Share (%), by Delivery Mode 2025 & 2033
- Figure 70: Middle East Care Management Solutions Industry Volume Share (%), by Delivery Mode 2025 & 2033
- Figure 71: Middle East Care Management Solutions Industry Revenue (Million), by Application 2025 & 2033
- Figure 72: Middle East Care Management Solutions Industry Volume (K Unit), by Application 2025 & 2033
- Figure 73: Middle East Care Management Solutions Industry Revenue Share (%), by Application 2025 & 2033
- Figure 74: Middle East Care Management Solutions Industry Volume Share (%), by Application 2025 & 2033
- Figure 75: Middle East Care Management Solutions Industry Revenue (Million), by End User 2025 & 2033
- Figure 76: Middle East Care Management Solutions Industry Volume (K Unit), by End User 2025 & 2033
- Figure 77: Middle East Care Management Solutions Industry Revenue Share (%), by End User 2025 & 2033
- Figure 78: Middle East Care Management Solutions Industry Volume Share (%), by End User 2025 & 2033
- Figure 79: Middle East Care Management Solutions Industry Revenue (Million), by Country 2025 & 2033
- Figure 80: Middle East Care Management Solutions Industry Volume (K Unit), by Country 2025 & 2033
- Figure 81: Middle East Care Management Solutions Industry Revenue Share (%), by Country 2025 & 2033
- Figure 82: Middle East Care Management Solutions Industry Volume Share (%), by Country 2025 & 2033
- Figure 83: GCC Care Management Solutions Industry Revenue (Million), by Component 2025 & 2033
- Figure 84: GCC Care Management Solutions Industry Volume (K Unit), by Component 2025 & 2033
- Figure 85: GCC Care Management Solutions Industry Revenue Share (%), by Component 2025 & 2033
- Figure 86: GCC Care Management Solutions Industry Volume Share (%), by Component 2025 & 2033
- Figure 87: GCC Care Management Solutions Industry Revenue (Million), by Delivery Mode 2025 & 2033
- Figure 88: GCC Care Management Solutions Industry Volume (K Unit), by Delivery Mode 2025 & 2033
- Figure 89: GCC Care Management Solutions Industry Revenue Share (%), by Delivery Mode 2025 & 2033
- Figure 90: GCC Care Management Solutions Industry Volume Share (%), by Delivery Mode 2025 & 2033
- Figure 91: GCC Care Management Solutions Industry Revenue (Million), by Application 2025 & 2033
- Figure 92: GCC Care Management Solutions Industry Volume (K Unit), by Application 2025 & 2033
- Figure 93: GCC Care Management Solutions Industry Revenue Share (%), by Application 2025 & 2033
- Figure 94: GCC Care Management Solutions Industry Volume Share (%), by Application 2025 & 2033
- Figure 95: GCC Care Management Solutions Industry Revenue (Million), by End User 2025 & 2033
- Figure 96: GCC Care Management Solutions Industry Volume (K Unit), by End User 2025 & 2033
- Figure 97: GCC Care Management Solutions Industry Revenue Share (%), by End User 2025 & 2033
- Figure 98: GCC Care Management Solutions Industry Volume Share (%), by End User 2025 & 2033
- Figure 99: GCC Care Management Solutions Industry Revenue (Million), by Country 2025 & 2033
- Figure 100: GCC Care Management Solutions Industry Volume (K Unit), by Country 2025 & 2033
- Figure 101: GCC Care Management Solutions Industry Revenue Share (%), by Country 2025 & 2033
- Figure 102: GCC Care Management Solutions Industry Volume Share (%), by Country 2025 & 2033
- Figure 103: South America Care Management Solutions Industry Revenue (Million), by Component 2025 & 2033
- Figure 104: South America Care Management Solutions Industry Volume (K Unit), by Component 2025 & 2033
- Figure 105: South America Care Management Solutions Industry Revenue Share (%), by Component 2025 & 2033
- Figure 106: South America Care Management Solutions Industry Volume Share (%), by Component 2025 & 2033
- Figure 107: South America Care Management Solutions Industry Revenue (Million), by Delivery Mode 2025 & 2033
- Figure 108: South America Care Management Solutions Industry Volume (K Unit), by Delivery Mode 2025 & 2033
- Figure 109: South America Care Management Solutions Industry Revenue Share (%), by Delivery Mode 2025 & 2033
- Figure 110: South America Care Management Solutions Industry Volume Share (%), by Delivery Mode 2025 & 2033
- Figure 111: South America Care Management Solutions Industry Revenue (Million), by Application 2025 & 2033
- Figure 112: South America Care Management Solutions Industry Volume (K Unit), by Application 2025 & 2033
- Figure 113: South America Care Management Solutions Industry Revenue Share (%), by Application 2025 & 2033
- Figure 114: South America Care Management Solutions Industry Volume Share (%), by Application 2025 & 2033
- Figure 115: South America Care Management Solutions Industry Revenue (Million), by End User 2025 & 2033
- Figure 116: South America Care Management Solutions Industry Volume (K Unit), by End User 2025 & 2033
- Figure 117: South America Care Management Solutions Industry Revenue Share (%), by End User 2025 & 2033
- Figure 118: South America Care Management Solutions Industry Volume Share (%), by End User 2025 & 2033
- Figure 119: South America Care Management Solutions Industry Revenue (Million), by Country 2025 & 2033
- Figure 120: South America Care Management Solutions Industry Volume (K Unit), by Country 2025 & 2033
- Figure 121: South America Care Management Solutions Industry Revenue Share (%), by Country 2025 & 2033
- Figure 122: South America Care Management Solutions Industry Volume Share (%), by Country 2025 & 2033
List of Tables
- Table 1: Global Care Management Solutions Industry Revenue Million Forecast, by Component 2020 & 2033
- Table 2: Global Care Management Solutions Industry Volume K Unit Forecast, by Component 2020 & 2033
- Table 3: Global Care Management Solutions Industry Revenue Million Forecast, by Delivery Mode 2020 & 2033
- Table 4: Global Care Management Solutions Industry Volume K Unit Forecast, by Delivery Mode 2020 & 2033
- Table 5: Global Care Management Solutions Industry Revenue Million Forecast, by Application 2020 & 2033
- Table 6: Global Care Management Solutions Industry Volume K Unit Forecast, by Application 2020 & 2033
- Table 7: Global Care Management Solutions Industry Revenue Million Forecast, by End User 2020 & 2033
- Table 8: Global Care Management Solutions Industry Volume K Unit Forecast, by End User 2020 & 2033
- Table 9: Global Care Management Solutions Industry Revenue Million Forecast, by Region 2020 & 2033
- Table 10: Global Care Management Solutions Industry Volume K Unit Forecast, by Region 2020 & 2033
- Table 11: Global Care Management Solutions Industry Revenue Million Forecast, by Component 2020 & 2033
- Table 12: Global Care Management Solutions Industry Volume K Unit Forecast, by Component 2020 & 2033
- Table 13: Global Care Management Solutions Industry Revenue Million Forecast, by Delivery Mode 2020 & 2033
- Table 14: Global Care Management Solutions Industry Volume K Unit Forecast, by Delivery Mode 2020 & 2033
- Table 15: Global Care Management Solutions Industry Revenue Million Forecast, by Application 2020 & 2033
- Table 16: Global Care Management Solutions Industry Volume K Unit Forecast, by Application 2020 & 2033
- Table 17: Global Care Management Solutions Industry Revenue Million Forecast, by End User 2020 & 2033
- Table 18: Global Care Management Solutions Industry Volume K Unit Forecast, by End User 2020 & 2033
- Table 19: Global Care Management Solutions Industry Revenue Million Forecast, by Country 2020 & 2033
- Table 20: Global Care Management Solutions Industry Volume K Unit Forecast, by Country 2020 & 2033
- Table 21: United States Care Management Solutions Industry Revenue (Million) Forecast, by Application 2020 & 2033
- Table 22: United States Care Management Solutions Industry Volume (K Unit) Forecast, by Application 2020 & 2033
- Table 23: Canada Care Management Solutions Industry Revenue (Million) Forecast, by Application 2020 & 2033
- Table 24: Canada Care Management Solutions Industry Volume (K Unit) Forecast, by Application 2020 & 2033
- Table 25: Mexico Care Management Solutions Industry Revenue (Million) Forecast, by Application 2020 & 2033
- Table 26: Mexico Care Management Solutions Industry Volume (K Unit) Forecast, by Application 2020 & 2033
- Table 27: Global Care Management Solutions Industry Revenue Million Forecast, by Component 2020 & 2033
- Table 28: Global Care Management Solutions Industry Volume K Unit Forecast, by Component 2020 & 2033
- Table 29: Global Care Management Solutions Industry Revenue Million Forecast, by Delivery Mode 2020 & 2033
- Table 30: Global Care Management Solutions Industry Volume K Unit Forecast, by Delivery Mode 2020 & 2033
- Table 31: Global Care Management Solutions Industry Revenue Million Forecast, by Application 2020 & 2033
- Table 32: Global Care Management Solutions Industry Volume K Unit Forecast, by Application 2020 & 2033
- Table 33: Global Care Management Solutions Industry Revenue Million Forecast, by End User 2020 & 2033
- Table 34: Global Care Management Solutions Industry Volume K Unit Forecast, by End User 2020 & 2033
- Table 35: Global Care Management Solutions Industry Revenue Million Forecast, by Country 2020 & 2033
- Table 36: Global Care Management Solutions Industry Volume K Unit Forecast, by Country 2020 & 2033
- Table 37: Germany Care Management Solutions Industry Revenue (Million) Forecast, by Application 2020 & 2033
- Table 38: Germany Care Management Solutions Industry Volume (K Unit) Forecast, by Application 2020 & 2033
- Table 39: United Kindom Care Management Solutions Industry Revenue (Million) Forecast, by Application 2020 & 2033
- Table 40: United Kindom Care Management Solutions Industry Volume (K Unit) Forecast, by Application 2020 & 2033
- Table 41: France Care Management Solutions Industry Revenue (Million) Forecast, by Application 2020 & 2033
- Table 42: France Care Management Solutions Industry Volume (K Unit) Forecast, by Application 2020 & 2033
- Table 43: Italy Care Management Solutions Industry Revenue (Million) Forecast, by Application 2020 & 2033
- Table 44: Italy Care Management Solutions Industry Volume (K Unit) Forecast, by Application 2020 & 2033
- Table 45: Spain Care Management Solutions Industry Revenue (Million) Forecast, by Application 2020 & 2033
- Table 46: Spain Care Management Solutions Industry Volume (K Unit) Forecast, by Application 2020 & 2033
- Table 47: Rest of Europe Care Management Solutions Industry Revenue (Million) Forecast, by Application 2020 & 2033
- Table 48: Rest of Europe Care Management Solutions Industry Volume (K Unit) Forecast, by Application 2020 & 2033
- Table 49: Global Care Management Solutions Industry Revenue Million Forecast, by Component 2020 & 2033
- Table 50: Global Care Management Solutions Industry Volume K Unit Forecast, by Component 2020 & 2033
- Table 51: Global Care Management Solutions Industry Revenue Million Forecast, by Delivery Mode 2020 & 2033
- Table 52: Global Care Management Solutions Industry Volume K Unit Forecast, by Delivery Mode 2020 & 2033
- Table 53: Global Care Management Solutions Industry Revenue Million Forecast, by Application 2020 & 2033
- Table 54: Global Care Management Solutions Industry Volume K Unit Forecast, by Application 2020 & 2033
- Table 55: Global Care Management Solutions Industry Revenue Million Forecast, by End User 2020 & 2033
- Table 56: Global Care Management Solutions Industry Volume K Unit Forecast, by End User 2020 & 2033
- Table 57: Global Care Management Solutions Industry Revenue Million Forecast, by Country 2020 & 2033
- Table 58: Global Care Management Solutions Industry Volume K Unit Forecast, by Country 2020 & 2033
- Table 59: China Care Management Solutions Industry Revenue (Million) Forecast, by Application 2020 & 2033
- Table 60: China Care Management Solutions Industry Volume (K Unit) Forecast, by Application 2020 & 2033
- Table 61: Japan Care Management Solutions Industry Revenue (Million) Forecast, by Application 2020 & 2033
- Table 62: Japan Care Management Solutions Industry Volume (K Unit) Forecast, by Application 2020 & 2033
- Table 63: India Care Management Solutions Industry Revenue (Million) Forecast, by Application 2020 & 2033
- Table 64: India Care Management Solutions Industry Volume (K Unit) Forecast, by Application 2020 & 2033
- Table 65: Australia Care Management Solutions Industry Revenue (Million) Forecast, by Application 2020 & 2033
- Table 66: Australia Care Management Solutions Industry Volume (K Unit) Forecast, by Application 2020 & 2033
- Table 67: South Korea Care Management Solutions Industry Revenue (Million) Forecast, by Application 2020 & 2033
- Table 68: South Korea Care Management Solutions Industry Volume (K Unit) Forecast, by Application 2020 & 2033
- Table 69: Rest of Asia Pacific Care Management Solutions Industry Revenue (Million) Forecast, by Application 2020 & 2033
- Table 70: Rest of Asia Pacific Care Management Solutions Industry Volume (K Unit) Forecast, by Application 2020 & 2033
- Table 71: Global Care Management Solutions Industry Revenue Million Forecast, by Component 2020 & 2033
- Table 72: Global Care Management Solutions Industry Volume K Unit Forecast, by Component 2020 & 2033
- Table 73: Global Care Management Solutions Industry Revenue Million Forecast, by Delivery Mode 2020 & 2033
- Table 74: Global Care Management Solutions Industry Volume K Unit Forecast, by Delivery Mode 2020 & 2033
- Table 75: Global Care Management Solutions Industry Revenue Million Forecast, by Application 2020 & 2033
- Table 76: Global Care Management Solutions Industry Volume K Unit Forecast, by Application 2020 & 2033
- Table 77: Global Care Management Solutions Industry Revenue Million Forecast, by End User 2020 & 2033
- Table 78: Global Care Management Solutions Industry Volume K Unit Forecast, by End User 2020 & 2033
- Table 79: Global Care Management Solutions Industry Revenue Million Forecast, by Country 2020 & 2033
- Table 80: Global Care Management Solutions Industry Volume K Unit Forecast, by Country 2020 & 2033
- Table 81: Global Care Management Solutions Industry Revenue Million Forecast, by Component 2020 & 2033
- Table 82: Global Care Management Solutions Industry Volume K Unit Forecast, by Component 2020 & 2033
- Table 83: Global Care Management Solutions Industry Revenue Million Forecast, by Delivery Mode 2020 & 2033
- Table 84: Global Care Management Solutions Industry Volume K Unit Forecast, by Delivery Mode 2020 & 2033
- Table 85: Global Care Management Solutions Industry Revenue Million Forecast, by Application 2020 & 2033
- Table 86: Global Care Management Solutions Industry Volume K Unit Forecast, by Application 2020 & 2033
- Table 87: Global Care Management Solutions Industry Revenue Million Forecast, by End User 2020 & 2033
- Table 88: Global Care Management Solutions Industry Volume K Unit Forecast, by End User 2020 & 2033
- Table 89: Global Care Management Solutions Industry Revenue Million Forecast, by Country 2020 & 2033
- Table 90: Global Care Management Solutions Industry Volume K Unit Forecast, by Country 2020 & 2033
- Table 91: South Africa Care Management Solutions Industry Revenue (Million) Forecast, by Application 2020 & 2033
- Table 92: South Africa Care Management Solutions Industry Volume (K Unit) Forecast, by Application 2020 & 2033
- Table 93: Rest of Middle East and Africa Care Management Solutions Industry Revenue (Million) Forecast, by Application 2020 & 2033
- Table 94: Rest of Middle East and Africa Care Management Solutions Industry Volume (K Unit) Forecast, by Application 2020 & 2033
- Table 95: Global Care Management Solutions Industry Revenue Million Forecast, by Component 2020 & 2033
- Table 96: Global Care Management Solutions Industry Volume K Unit Forecast, by Component 2020 & 2033
- Table 97: Global Care Management Solutions Industry Revenue Million Forecast, by Delivery Mode 2020 & 2033
- Table 98: Global Care Management Solutions Industry Volume K Unit Forecast, by Delivery Mode 2020 & 2033
- Table 99: Global Care Management Solutions Industry Revenue Million Forecast, by Application 2020 & 2033
- Table 100: Global Care Management Solutions Industry Volume K Unit Forecast, by Application 2020 & 2033
- Table 101: Global Care Management Solutions Industry Revenue Million Forecast, by End User 2020 & 2033
- Table 102: Global Care Management Solutions Industry Volume K Unit Forecast, by End User 2020 & 2033
- Table 103: Global Care Management Solutions Industry Revenue Million Forecast, by Country 2020 & 2033
- Table 104: Global Care Management Solutions Industry Volume K Unit Forecast, by Country 2020 & 2033
- Table 105: Brazil Care Management Solutions Industry Revenue (Million) Forecast, by Application 2020 & 2033
- Table 106: Brazil Care Management Solutions Industry Volume (K Unit) Forecast, by Application 2020 & 2033
- Table 107: Argentina Care Management Solutions Industry Revenue (Million) Forecast, by Application 2020 & 2033
- Table 108: Argentina Care Management Solutions Industry Volume (K Unit) Forecast, by Application 2020 & 2033
- Table 109: Rest of South America Care Management Solutions Industry Revenue (Million) Forecast, by Application 2020 & 2033
- Table 110: Rest of South America Care Management Solutions Industry Volume (K Unit) Forecast, by Application 2020 & 2033
Frequently Asked Questions
1. What is the projected Compound Annual Growth Rate (CAGR) of the Care Management Solutions Industry?
The projected CAGR is approximately 12.23%.
2. Which companies are prominent players in the Care Management Solutions Industry?
Key companies in the market include Zeomega Inc, Medecision Inc, Phytel Inc (IBM Corporation), Cognizant, I2I Systems Inc, Centene Corporation (Evolve), Veradigm, InfoMC, Infosys Limited, Convey Health Solutions, Optum Inc, EPIC Corporation Inc, Exl Healthcare, Hinduja Global Solutions Limited.
3. What are the main segments of the Care Management Solutions Industry?
The market segments include Component, Delivery Mode, Application, End User.
4. Can you provide details about the market size?
The market size is estimated to be USD 15.03 Million as of 2022.
5. What are some drivers contributing to market growth?
Rising Geriatric Population and Burden of Chronic Diseases; Care Management Solutions Offer a Means to Reduce Healthcare Costs; Government Initiatives on Healthcare Services and Infrastructure.
6. What are the notable trends driving market growth?
Chronic Care Management Segment Expected to Hold a Significant Share in the Care Management Solutions Market.
7. Are there any restraints impacting market growth?
High Investments Required for Supporting Infrastructure; Data Security Concerns Related to Cloud-based Solutions.
8. Can you provide examples of recent developments in the market?
April 2023: Medecision, a provider of digital care management solutions and services, launched Aerial Social Care Coordinator, a cutting-edge solution designed to provide health plans and healthcare providers with immediate insight into individuals' social determinants of health barriers.
9. What pricing options are available for accessing the report?
Pricing options include single-user, multi-user, and enterprise licenses priced at USD 4750, USD 5250, and USD 8750 respectively.
10. Is the market size provided in terms of value or volume?
The market size is provided in terms of value, measured in Million and volume, measured in K Unit.
11. Are there any specific market keywords associated with the report?
Yes, the market keyword associated with the report is "Care Management Solutions Industry," which aids in identifying and referencing the specific market segment covered.
12. How do I determine which pricing option suits my needs best?
The pricing options vary based on user requirements and access needs. Individual users may opt for single-user licenses, while businesses requiring broader access may choose multi-user or enterprise licenses for cost-effective access to the report.
13. Are there any additional resources or data provided in the Care Management Solutions Industry report?
While the report offers comprehensive insights, it's advisable to review the specific contents or supplementary materials provided to ascertain if additional resources or data are available.
14. How can I stay updated on further developments or reports in the Care Management Solutions Industry?
To stay informed about further developments, trends, and reports in the Care Management Solutions Industry, consider subscribing to industry newsletters, following relevant companies and organizations, or regularly checking reputable industry news sources and publications.
Methodology
Step 1 - Identification of Relevant Samples Size from Population Database


Step 2 - Approaches for Defining Global Market Size (Value, Volume* & Price*)

Note*: In applicable scenarios
Step 3 - Data Sources
Primary Research
- Web Analytics
- Survey Reports
- Research Institute
- Latest Research Reports
- Opinion Leaders
Secondary Research
- Annual Reports
- White Paper
- Latest Press Release
- Industry Association
- Paid Database
- Investor Presentations

Step 4 - Data Triangulation
Involves using different sources of information in order to increase the validity of a study
These sources are likely to be stakeholders in a program - participants, other researchers, program staff, other community members, and so on.
Then we put all data in single framework & apply various statistical tools to find out the dynamic on the market.
During the analysis stage, feedback from the stakeholder groups would be compared to determine areas of agreement as well as areas of divergence