

Key Insights
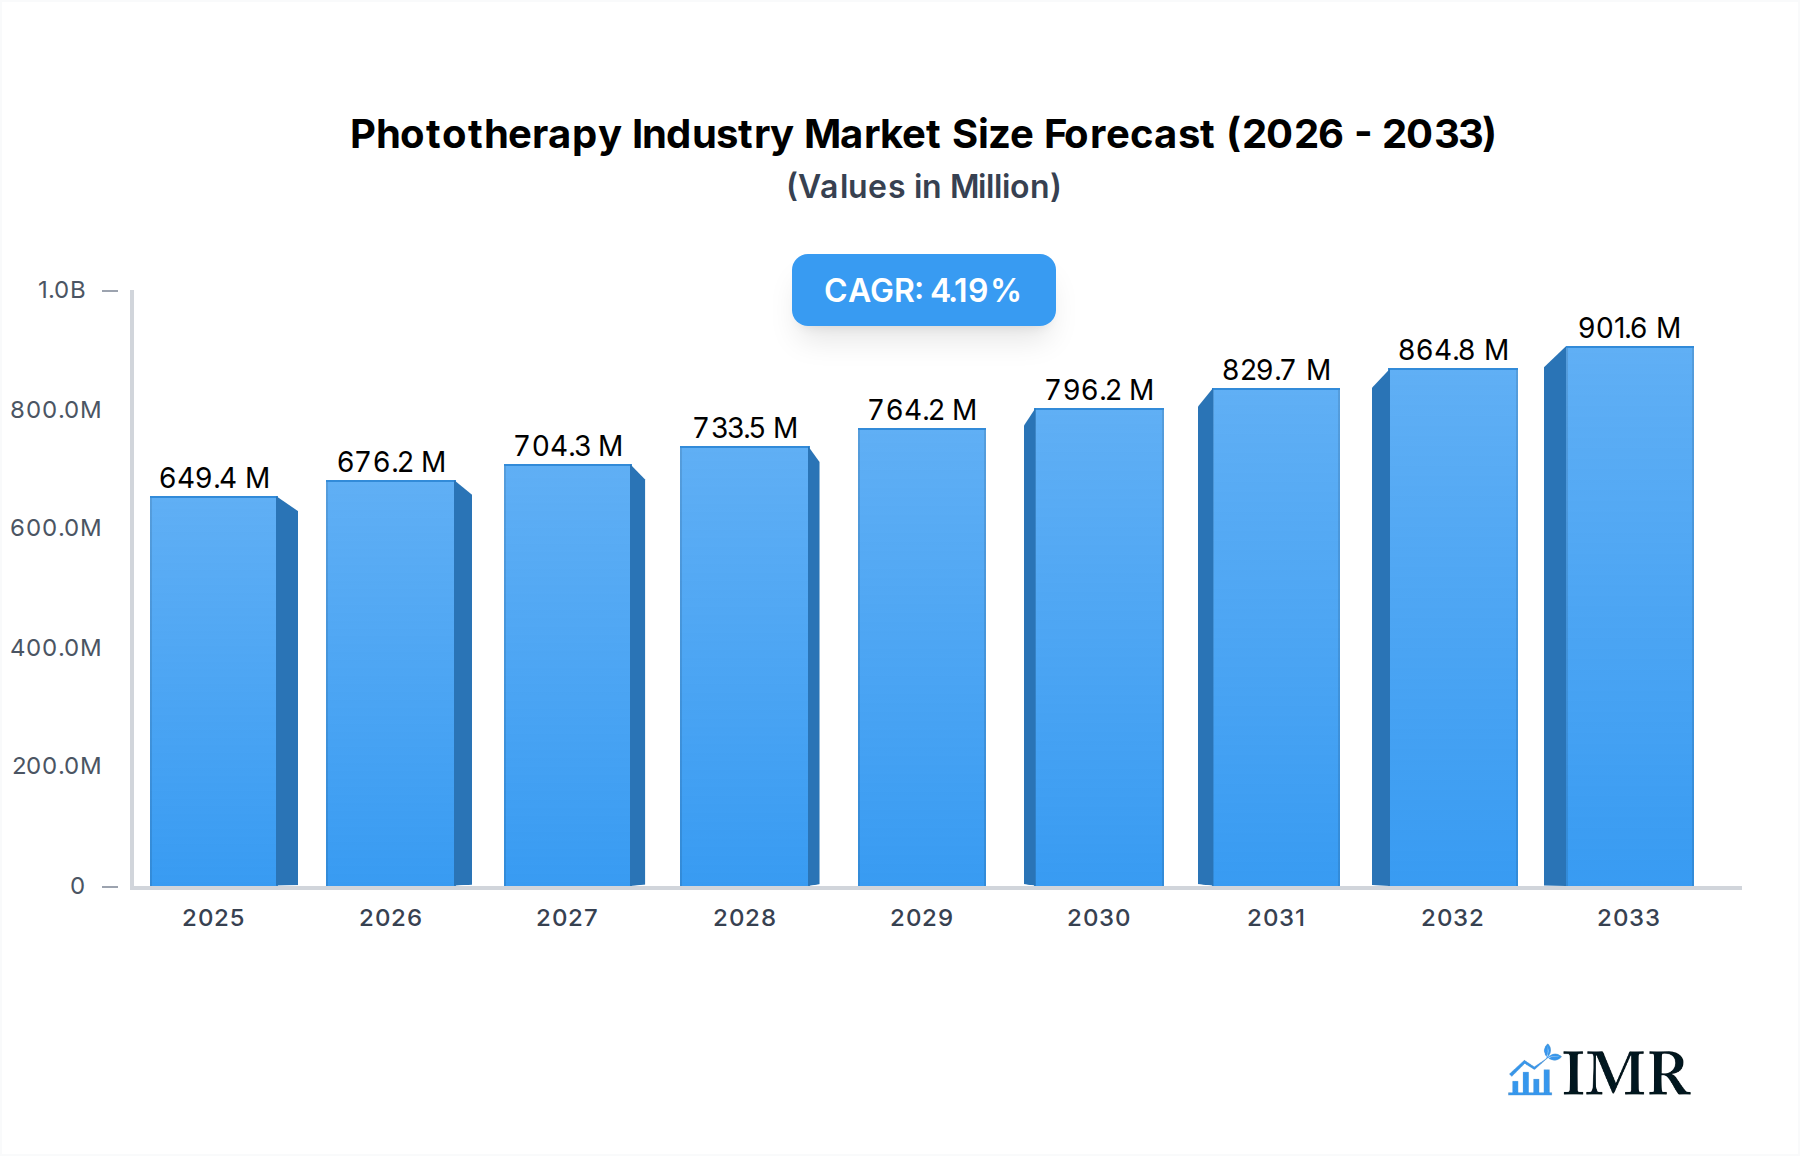
The global phototherapy market is poised for robust expansion, projected to reach a substantial USD 649.37 million by 2025, with an anticipated Compound Annual Growth Rate (CAGR) of 4.1% through 2033. This impressive growth is underpinned by a confluence of driving factors, including the increasing prevalence of mental health disorders and skin conditions, coupled with a growing awareness of phototherapy's efficacy in treatment. Furthermore, the rising demand for non-pharmacological treatment options and advancements in light therapy device technology are significantly contributing to market dynamism. The market is segmented across various product types such as light boxes, floor and desk lamps, and handheld devices, catering to diverse therapeutic needs. White light and blue light dominate the light type segment, widely utilized for conditions ranging from Seasonal Affective Disorder (SAD) to acne and psoriasis. The application spectrum is broad, encompassing vitamin D deficiency, mental health disorders, skin disorders, and neonatal jaundice, highlighting the versatility of phototherapy.

Phototherapy Industry Market Size (In Million)
The market's trajectory is further shaped by evolving consumer preferences and technological innovations. Home care settings are emerging as a significant growth area, driven by the development of user-friendly and portable devices that offer convenience and accessibility. While the market is experiencing strong tailwinds, potential restraints such as the high initial cost of some advanced devices and the need for greater physician and patient education regarding phototherapy's benefits and proper usage, could influence adoption rates. Key players like Koninklijke Philips N.V., Beurer, and Lumie are actively investing in research and development to introduce novel solutions and expand their market reach. Geographically, North America and Europe currently lead the market, benefiting from established healthcare infrastructures and a higher adoption rate of advanced medical technologies. However, the Asia Pacific region is expected to witness significant growth due to increasing healthcare expenditure and a growing patient pool.
Phototherapy Industry Company Market Share
Phototherapy Industry Market Analysis Report: Forecasted Growth, Key Trends, and Dominant Segments (2019-2033)
This comprehensive report delves into the dynamic phototherapy industry, offering an in-depth analysis of market dynamics, growth trends, key drivers, barriers, and the competitive landscape. Covering a study period from 2019 to 2033, with a detailed focus on the base year 2025 and a forecast period extending to 2033, this report provides actionable insights for industry professionals. We examine the market's structure, technological innovations, regulatory impacts, and end-user behavior across various product types, light types, applications, and end-user segments, including parent and child markets. All market values are presented in millions of units to facilitate precise understanding of scale and impact.
Phototherapy Industry Market Dynamics & Structure
The global phototherapy market is characterized by a moderate to high level of concentration, with key players like Koninklijke Philips N.V. and PhotoMedex Inc. holding significant shares. Technological innovation is a primary driver, fueled by advancements in light-emitting diode (LED) technology, increasing the efficacy and portability of phototherapy devices. Regulatory frameworks, particularly those governing medical device approvals and therapeutic claims, play a crucial role in shaping market access and product development. While direct substitutes are limited, alternative treatments for skin disorders and mental health conditions present indirect competition. End-user demographics are expanding, with growing awareness and adoption in home care settings alongside traditional clinical applications. Mergers and acquisitions (M&A) are a notable trend, with companies seeking to consolidate their market position and expand their product portfolios. For instance, the acquisition of smaller innovators by larger established companies aims to integrate novel technologies and broaden reach. Innovation barriers include the substantial R&D investment required for developing evidence-based phototherapy solutions and navigating complex clinical trial processes. The market's structure is also influenced by the increasing demand for personalized treatment solutions, driving the development of devices with adjustable parameters and targeted light delivery.
- Market Concentration: Moderate to High, with key players dominating specific segments.
- Technological Innovation Drivers: LED advancements, miniaturization, smart device integration.
- Regulatory Frameworks: FDA, CE Marking, and regional health authorities significantly influence market entry.
- Competitive Product Substitutes: Alternative therapies for skin conditions and mental health disorders.
- End-User Demographics: Growing home care adoption, aging populations, increased mental health awareness.
- M&A Trends: Consolidation to gain market share and acquire innovative technologies.
Phototherapy Industry Growth Trends & Insights
The phototherapy industry is poised for substantial expansion, driven by an increasing prevalence of chronic skin disorders, a rising awareness of mental health conditions, and the growing demand for non-pharmacological treatment options. The market size has witnessed consistent growth, with an estimated value of approximately \$3,500 million in 2024, projected to reach over \$7,800 million by 2033, exhibiting a robust Compound Annual Growth Rate (CAGR) of around 9.5% during the forecast period. Adoption rates for home-use phototherapy devices are accelerating, facilitated by improved product design, enhanced user-friendliness, and supportive reimbursement policies in certain regions. Technological disruptions, such as the development of targeted narrowband UVB and blue light therapies, are revolutionizing treatment efficacy for conditions like psoriasis and acne. Consumer behavior shifts are evident, with individuals increasingly seeking convenient and accessible therapeutic solutions. The rising incidence of neonatal jaundice globally further bolsters the demand for specialized phototherapy devices, contributing significantly to the market's upward trajectory. Furthermore, the integration of AI and IoT in phototherapy devices is creating personalized treatment plans and remote monitoring capabilities, enhancing patient outcomes and driving market penetration. The increasing application of red light therapy for cosmetic and therapeutic purposes, including wound healing and pain management, also represents a significant growth avenue. The market's evolution is also marked by a growing emphasis on evidence-based research, validating the efficacy of phototherapy across a broader spectrum of conditions. This continuous refinement of therapeutic protocols and device functionalities ensures sustained demand and market vitality.
Dominant Regions, Countries, or Segments in Phototherapy Industry
North America currently holds a dominant position in the global phototherapy industry, largely driven by the United States. This regional leadership is attributed to several factors, including a high prevalence of skin disorders such as psoriasis and eczema, significant investments in healthcare infrastructure, and a robust reimbursement framework for medical devices. The presence of leading phototherapy companies and a well-established research ecosystem further solidifies its market dominance.
Within the product type segment, Light Boxes continue to be a cornerstone of the market, particularly for treating seasonal affective disorder (SAD) and certain skin conditions. Their established efficacy and widespread adoption in both clinical and home settings contribute to their sustained demand. However, Handheld Devices are experiencing rapid growth, fueled by their portability, ease of use, and targeted application for specific skin concerns and localized pain relief.
In terms of light type, White Light remains prevalent due to its broad application in mental health therapies and light boxes. However, Blue Light therapy is gaining significant traction, especially for treating acne and neonatal jaundice, owing to its targeted antimicrobial properties and efficacy in breaking down bilirubin. Red Light therapy is also emerging as a strong contender, with increasing applications in cosmetic procedures, wound healing, and pain management.
From an application perspective, Skin Disorders represent a major segment, encompassing psoriasis, eczema, vitiligo, and acne. The high incidence rates and the effectiveness of phototherapy in managing these chronic conditions drive substantial market demand. Mental Health Disorders, particularly Seasonal Affective Disorder (SAD), also represent a significant application area, with dawn simulators and light boxes being widely utilized.
The Home Care Settings end-user segment is witnessing the most dynamic growth. The convenience, privacy, and cost-effectiveness of using phototherapy devices at home are appealing to a growing number of patients. This shift is supported by the development of user-friendly and portable devices.
- Dominant Region: North America (driven by the United States).
- Leading Product Type: Light Boxes, with rapid growth in Handheld Devices.
- Key Light Type: White Light, with significant growth in Blue Light and Red Light therapies.
- Major Application: Skin Disorders, with growing importance of Mental Health Disorders.
- Fastest Growing End User: Home Care Settings.
Phototherapy Industry Product Landscape
The phototherapy industry is experiencing a wave of innovation focused on enhancing therapeutic efficacy, user convenience, and personalization. Advancements in LED technology have led to the development of devices offering more precise wavelength control and higher light intensity, improving treatment outcomes for various skin conditions and mental health disorders. Innovations in light boxes now include integrated timers and adjustable intensity settings, while handheld devices are becoming more compact and feature-rich, offering targeted treatments for localized issues. The integration of smart technology, such as mobile app connectivity, allows for personalized treatment regimens and remote monitoring, enhancing patient engagement and adherence. Manufacturers are also exploring novel light types, such as specific combinations of red and infrared light for advanced wound healing and pain management, expanding the therapeutic applications of phototherapy beyond traditional uses.
Key Drivers, Barriers & Challenges in Phototherapy Industry
The phototherapy industry is propelled by several key drivers, including the escalating prevalence of skin disorders like psoriasis and eczema, coupled with a growing awareness and acceptance of phototherapy as an effective treatment for mental health conditions such as SAD. Technological advancements in LED illumination and device miniaturization are making phototherapy more accessible, portable, and user-friendly, especially for home care settings. Furthermore, the demand for non-pharmacological and non-invasive treatment options is a significant growth catalyst.
However, the market faces considerable barriers and challenges. High initial costs for advanced phototherapy devices can deter some consumers, particularly in regions with limited healthcare coverage. Stringent regulatory approvals for new devices and therapeutic claims can slow down market entry and product innovation. Supply chain disruptions and the need for specialized manufacturing expertise can also pose challenges. Competitive pressures from alternative therapies and the need for extensive clinical validation for new applications require significant R&D investment, acting as a restraint on rapid market expansion.
Emerging Opportunities in Phototherapy Industry
Emerging opportunities within the phototherapy industry lie in the expansion of applications beyond traditional dermatological and mental health uses. The growing interest in aesthetic treatments and anti-aging therapies presents a significant avenue for red light and near-infrared light devices. Furthermore, the increasing adoption of phototherapy for pain management and rehabilitation, particularly for conditions like arthritis and muscle recovery, opens up new market segments. The development of wearable phototherapy devices for continuous and localized treatment offers convenience and improved patient compliance. There is also an untapped potential in developing phototherapy solutions for veterinary applications and for addressing sleep disorders beyond SAD. The integration of AI-powered diagnostic tools to personalize phototherapy protocols based on individual patient needs represents another promising frontier.
Growth Accelerators in the Phototherapy Industry Industry
The long-term growth of the phototherapy industry is being significantly accelerated by a confluence of factors. Continuous technological breakthroughs, particularly in the efficiency, specificity, and cost-effectiveness of LED light sources, are enhancing device performance and affordability. Strategic partnerships between device manufacturers, healthcare providers, and research institutions are crucial for validating new therapeutic applications and expanding clinical adoption. Market expansion strategies, including entry into emerging economies and catering to diverse patient populations, are vital for sustained growth. The increasing focus on preventative healthcare and wellness also bodes well for phototherapy, as its non-invasive nature aligns with these trends. Furthermore, the development of integrated phototherapy systems that combine multiple light types and treatment modalities will cater to a broader range of patient needs.
Key Players Shaping the Phototherapy Industry Market
- Beurer
- Zepter International
- PhotoMedex Inc
- Verilux Inc
- Nature Bright
- Revian Inc
- Koninklijke Philips N V
- Northern Light Technologies
- Lumie
- BioPhotas
- Carex
- Lucimed SA
Notable Milestones in Phototherapy Industry Sector
- February 2022: STRATA Skin Sciences, Inc. announced the commercial launch of its next-generation excimer laser system, XTRAC Momentum 1.0. The XTRAC excimer laser technology allows for the precise delivery of targeted UVB light therapy to specific treatment areas of the skin for both adult and pediatric patients suffering from inflammatory skin conditions such as psoriasis, atopic dermatitis, and vitiligo.
- January 2022: Bilihome closed the new funding round led by Health Innovations and Oost NL, which aimed to support the market launch of a smart, wearable light therapy device for jaundice, a condition that affects 10% of all newborns.
In-Depth Phototherapy Industry Market Outlook
The future of the phototherapy industry is exceptionally promising, fueled by ongoing innovation and a broadening scope of therapeutic applications. Growth accelerators, including advancements in targeted light delivery systems and the increasing integration of smart technologies for personalized treatment, will continue to drive market expansion. Strategic collaborations aimed at exploring novel indications, such as for wound healing, pain management, and even certain neurological conditions, will unlock significant new market potential. The rising global awareness of mental well-being and the persistent challenge of chronic skin diseases will ensure sustained demand. Furthermore, the growing trend of self-care and home-based treatment solutions positions phototherapy as a key modality for future healthcare. Companies that can effectively navigate regulatory landscapes and demonstrate strong clinical evidence for their innovative phototherapy solutions are poised for substantial success.
Phototherapy Industry Segmentation
-
1. Product Type
- 1.1. Light Box
- 1.2. Floor and Desk Lamps
- 1.3. Light Visor
- 1.4. Dawn Simulator
- 1.5. Light Therapy Bulbs
- 1.6. Handheld Devices
-
2. Light Type
- 2.1. White Light
- 2.2. Blue Light
- 2.3. Red Light
- 2.4. Others (Green and Yellow Light)
-
3. Application
- 3.1. Vitamin D Deficiency
- 3.2. Mental Health Disorders
- 3.3. Skin Disorders
- 3.4. Neonatal Jaundice
-
4. End User
- 4.1. Dermatology Clinics
- 4.2. Home Care Settings
- 4.3. Others (Workplace, Salons, etc.)
Phototherapy Industry Segmentation By Geography
-
1. North America
- 1.1. United States
- 1.2. Canada
- 1.3. Mexico
-
2. Europe
- 2.1. Germany
- 2.2. United Kingdom
- 2.3. France
- 2.4. Italy
- 2.5. Spain
- 2.6. Rest of Europe
-
3. Asia Pacific
- 3.1. China
- 3.2. Japan
- 3.3. India
- 3.4. Australia
- 3.5. South Korea
- 3.6. Rest of Asia Pacific
-
4. Middle East and Africa
- 4.1. GCC
- 4.2. South Africa
- 4.3. Rest of Middle East and Africa
-
5. South America
- 5.1. Brazil
- 5.2. Argentina
- 5.3. Rest of South America

Phototherapy Industry Regional Market Share
Geographic Coverage of Phototherapy Industry
Phototherapy Industry REPORT HIGHLIGHTS
| Aspects | Details |
|---|---|
| Study Period | 2020-2034 |
| Base Year | 2025 |
| Estimated Year | 2026 |
| Forecast Period | 2026-2034 |
| Historical Period | 2020-2025 |
| Growth Rate | CAGR of 4.1% from 2020-2034 |
| Segmentation |
|
Table of Contents
- 1. Introduction
- 1.1. Research Scope
- 1.2. Market Segmentation
- 1.3. Research Objective
- 1.4. Definitions and Assumptions
- 2. Executive Summary
- 2.1. Market Snapshot
- 3. Market Dynamics
- 3.1. Market Drivers
- 3.2. Market Restrains
- 3.3. Market Trends
- 3.4. Market Opportunities
- 4. Market Factor Analysis
- 4.1. Porters Five Forces
- 4.1.1. Bargaining Power of Suppliers
- 4.1.2. Bargaining Power of Buyers
- 4.1.3. Threat of New Entrants
- 4.1.4. Threat of Substitutes
- 4.1.5. Competitive Rivalry
- 4.2. PESTEL analysis
- 4.3. BCG Analysis
- 4.3.1. Stars (High Growth, High Market Share)
- 4.3.2. Cash Cows (Low Growth, High Market Share)
- 4.3.3. Question Mark (High Growth, Low Market Share)
- 4.3.4. Dogs (Low Growth, Low Market Share)
- 4.4. Ansoff Matrix Analysis
- 4.5. Supply Chain Analysis
- 4.6. Regulatory Landscape
- 4.7. Current Market Potential and Opportunity Assessment (TAM–SAM–SOM Framework)
- 4.8. IMR Analyst Note
- 4.1. Porters Five Forces
- 5. Market Analysis, Insights and Forecast 2021-2033
- 5.1. Market Analysis, Insights and Forecast - by Product Type
- 5.1.1. Light Box
- 5.1.2. Floor and Desk Lamps
- 5.1.3. Light Visor
- 5.1.4. Dawn Simulator
- 5.1.5. Light Therapy Bulbs
- 5.1.6. Handheld Devices
- 5.2. Market Analysis, Insights and Forecast - by Light Type
- 5.2.1. White Light
- 5.2.2. Blue Light
- 5.2.3. Red Light
- 5.2.4. Others (Green and Yellow Light)
- 5.3. Market Analysis, Insights and Forecast - by Application
- 5.3.1. Vitamin D Deficiency
- 5.3.2. Mental Health Disorders
- 5.3.3. Skin Disorders
- 5.3.4. Neonatal Jaundice
- 5.4. Market Analysis, Insights and Forecast - by End User
- 5.4.1. Dermatology Clinics
- 5.4.2. Home Care Settings
- 5.4.3. Others (Workplace, Salons, etc.)
- 5.5. Market Analysis, Insights and Forecast - by Region
- 5.5.1. North America
- 5.5.2. Europe
- 5.5.3. Asia Pacific
- 5.5.4. Middle East and Africa
- 5.5.5. South America
- 5.1. Market Analysis, Insights and Forecast - by Product Type
- 6. Global Phototherapy Industry Analysis, Insights and Forecast, 2021-2033
- 6.1. Market Analysis, Insights and Forecast - by Product Type
- 6.1.1. Light Box
- 6.1.2. Floor and Desk Lamps
- 6.1.3. Light Visor
- 6.1.4. Dawn Simulator
- 6.1.5. Light Therapy Bulbs
- 6.1.6. Handheld Devices
- 6.2. Market Analysis, Insights and Forecast - by Light Type
- 6.2.1. White Light
- 6.2.2. Blue Light
- 6.2.3. Red Light
- 6.2.4. Others (Green and Yellow Light)
- 6.3. Market Analysis, Insights and Forecast - by Application
- 6.3.1. Vitamin D Deficiency
- 6.3.2. Mental Health Disorders
- 6.3.3. Skin Disorders
- 6.3.4. Neonatal Jaundice
- 6.4. Market Analysis, Insights and Forecast - by End User
- 6.4.1. Dermatology Clinics
- 6.4.2. Home Care Settings
- 6.4.3. Others (Workplace, Salons, etc.)
- 6.1. Market Analysis, Insights and Forecast - by Product Type
- 7. North America Phototherapy Industry Analysis, Insights and Forecast, 2020-2032
- 7.1. Market Analysis, Insights and Forecast - by Product Type
- 7.1.1. Light Box
- 7.1.2. Floor and Desk Lamps
- 7.1.3. Light Visor
- 7.1.4. Dawn Simulator
- 7.1.5. Light Therapy Bulbs
- 7.1.6. Handheld Devices
- 7.2. Market Analysis, Insights and Forecast - by Light Type
- 7.2.1. White Light
- 7.2.2. Blue Light
- 7.2.3. Red Light
- 7.2.4. Others (Green and Yellow Light)
- 7.3. Market Analysis, Insights and Forecast - by Application
- 7.3.1. Vitamin D Deficiency
- 7.3.2. Mental Health Disorders
- 7.3.3. Skin Disorders
- 7.3.4. Neonatal Jaundice
- 7.4. Market Analysis, Insights and Forecast - by End User
- 7.4.1. Dermatology Clinics
- 7.4.2. Home Care Settings
- 7.4.3. Others (Workplace, Salons, etc.)
- 7.1. Market Analysis, Insights and Forecast - by Product Type
- 8. Europe Phototherapy Industry Analysis, Insights and Forecast, 2020-2032
- 8.1. Market Analysis, Insights and Forecast - by Product Type
- 8.1.1. Light Box
- 8.1.2. Floor and Desk Lamps
- 8.1.3. Light Visor
- 8.1.4. Dawn Simulator
- 8.1.5. Light Therapy Bulbs
- 8.1.6. Handheld Devices
- 8.2. Market Analysis, Insights and Forecast - by Light Type
- 8.2.1. White Light
- 8.2.2. Blue Light
- 8.2.3. Red Light
- 8.2.4. Others (Green and Yellow Light)
- 8.3. Market Analysis, Insights and Forecast - by Application
- 8.3.1. Vitamin D Deficiency
- 8.3.2. Mental Health Disorders
- 8.3.3. Skin Disorders
- 8.3.4. Neonatal Jaundice
- 8.4. Market Analysis, Insights and Forecast - by End User
- 8.4.1. Dermatology Clinics
- 8.4.2. Home Care Settings
- 8.4.3. Others (Workplace, Salons, etc.)
- 8.1. Market Analysis, Insights and Forecast - by Product Type
- 9. Asia Pacific Phototherapy Industry Analysis, Insights and Forecast, 2020-2032
- 9.1. Market Analysis, Insights and Forecast - by Product Type
- 9.1.1. Light Box
- 9.1.2. Floor and Desk Lamps
- 9.1.3. Light Visor
- 9.1.4. Dawn Simulator
- 9.1.5. Light Therapy Bulbs
- 9.1.6. Handheld Devices
- 9.2. Market Analysis, Insights and Forecast - by Light Type
- 9.2.1. White Light
- 9.2.2. Blue Light
- 9.2.3. Red Light
- 9.2.4. Others (Green and Yellow Light)
- 9.3. Market Analysis, Insights and Forecast - by Application
- 9.3.1. Vitamin D Deficiency
- 9.3.2. Mental Health Disorders
- 9.3.3. Skin Disorders
- 9.3.4. Neonatal Jaundice
- 9.4. Market Analysis, Insights and Forecast - by End User
- 9.4.1. Dermatology Clinics
- 9.4.2. Home Care Settings
- 9.4.3. Others (Workplace, Salons, etc.)
- 9.1. Market Analysis, Insights and Forecast - by Product Type
- 10. Middle East and Africa Phototherapy Industry Analysis, Insights and Forecast, 2020-2032
- 10.1. Market Analysis, Insights and Forecast - by Product Type
- 10.1.1. Light Box
- 10.1.2. Floor and Desk Lamps
- 10.1.3. Light Visor
- 10.1.4. Dawn Simulator
- 10.1.5. Light Therapy Bulbs
- 10.1.6. Handheld Devices
- 10.2. Market Analysis, Insights and Forecast - by Light Type
- 10.2.1. White Light
- 10.2.2. Blue Light
- 10.2.3. Red Light
- 10.2.4. Others (Green and Yellow Light)
- 10.3. Market Analysis, Insights and Forecast - by Application
- 10.3.1. Vitamin D Deficiency
- 10.3.2. Mental Health Disorders
- 10.3.3. Skin Disorders
- 10.3.4. Neonatal Jaundice
- 10.4. Market Analysis, Insights and Forecast - by End User
- 10.4.1. Dermatology Clinics
- 10.4.2. Home Care Settings
- 10.4.3. Others (Workplace, Salons, etc.)
- 10.1. Market Analysis, Insights and Forecast - by Product Type
- 11. South America Phototherapy Industry Analysis, Insights and Forecast, 2020-2032
- 11.1. Market Analysis, Insights and Forecast - by Product Type
- 11.1.1. Light Box
- 11.1.2. Floor and Desk Lamps
- 11.1.3. Light Visor
- 11.1.4. Dawn Simulator
- 11.1.5. Light Therapy Bulbs
- 11.1.6. Handheld Devices
- 11.2. Market Analysis, Insights and Forecast - by Light Type
- 11.2.1. White Light
- 11.2.2. Blue Light
- 11.2.3. Red Light
- 11.2.4. Others (Green and Yellow Light)
- 11.3. Market Analysis, Insights and Forecast - by Application
- 11.3.1. Vitamin D Deficiency
- 11.3.2. Mental Health Disorders
- 11.3.3. Skin Disorders
- 11.3.4. Neonatal Jaundice
- 11.4. Market Analysis, Insights and Forecast - by End User
- 11.4.1. Dermatology Clinics
- 11.4.2. Home Care Settings
- 11.4.3. Others (Workplace, Salons, etc.)
- 11.1. Market Analysis, Insights and Forecast - by Product Type
- 12. Competitive Analysis
- 12.1. Company Profiles
- 12.1.1 Beurer
- 12.1.1.1. Company Overview
- 12.1.1.2. Products
- 12.1.1.3. Company Financials
- 12.1.1.4. SWOT Analysis
- 12.1.2 Zepter International
- 12.1.2.1. Company Overview
- 12.1.2.2. Products
- 12.1.2.3. Company Financials
- 12.1.2.4. SWOT Analysis
- 12.1.3 PhotoMedex Inc
- 12.1.3.1. Company Overview
- 12.1.3.2. Products
- 12.1.3.3. Company Financials
- 12.1.3.4. SWOT Analysis
- 12.1.4 Verilux Inc
- 12.1.4.1. Company Overview
- 12.1.4.2. Products
- 12.1.4.3. Company Financials
- 12.1.4.4. SWOT Analysis
- 12.1.5 Nature Bright
- 12.1.5.1. Company Overview
- 12.1.5.2. Products
- 12.1.5.3. Company Financials
- 12.1.5.4. SWOT Analysis
- 12.1.6 Revian Inc
- 12.1.6.1. Company Overview
- 12.1.6.2. Products
- 12.1.6.3. Company Financials
- 12.1.6.4. SWOT Analysis
- 12.1.7 Koninklijke Philips N V
- 12.1.7.1. Company Overview
- 12.1.7.2. Products
- 12.1.7.3. Company Financials
- 12.1.7.4. SWOT Analysis
- 12.1.8 Northern Light Technologies
- 12.1.8.1. Company Overview
- 12.1.8.2. Products
- 12.1.8.3. Company Financials
- 12.1.8.4. SWOT Analysis
- 12.1.9 Lumie
- 12.1.9.1. Company Overview
- 12.1.9.2. Products
- 12.1.9.3. Company Financials
- 12.1.9.4. SWOT Analysis
- 12.1.10 BioPhotas
- 12.1.10.1. Company Overview
- 12.1.10.2. Products
- 12.1.10.3. Company Financials
- 12.1.10.4. SWOT Analysis
- 12.1.11 Carex
- 12.1.11.1. Company Overview
- 12.1.11.2. Products
- 12.1.11.3. Company Financials
- 12.1.11.4. SWOT Analysis
- 12.1.12 Lucimed SA
- 12.1.12.1. Company Overview
- 12.1.12.2. Products
- 12.1.12.3. Company Financials
- 12.1.12.4. SWOT Analysis
- 12.1.1 Beurer
- 12.2. Market Entropy
- 12.2.1 Company's Key Areas Served
- 12.2.2 Recent Developments
- 12.3. Company Market Share Analysis 2025
- 12.3.1 Top 5 Companies Market Share Analysis
- 12.3.2 Top 3 Companies Market Share Analysis
- 12.4. List of Potential Customers
- 13. Research Methodology
List of Figures
- Figure 1: Global Phototherapy Industry Revenue Breakdown (million, %) by Region 2025 & 2033
- Figure 2: North America Phototherapy Industry Revenue (million), by Product Type 2025 & 2033
- Figure 3: North America Phototherapy Industry Revenue Share (%), by Product Type 2025 & 2033
- Figure 4: North America Phototherapy Industry Revenue (million), by Light Type 2025 & 2033
- Figure 5: North America Phototherapy Industry Revenue Share (%), by Light Type 2025 & 2033
- Figure 6: North America Phototherapy Industry Revenue (million), by Application 2025 & 2033
- Figure 7: North America Phototherapy Industry Revenue Share (%), by Application 2025 & 2033
- Figure 8: North America Phototherapy Industry Revenue (million), by End User 2025 & 2033
- Figure 9: North America Phototherapy Industry Revenue Share (%), by End User 2025 & 2033
- Figure 10: North America Phototherapy Industry Revenue (million), by Country 2025 & 2033
- Figure 11: North America Phototherapy Industry Revenue Share (%), by Country 2025 & 2033
- Figure 12: Europe Phototherapy Industry Revenue (million), by Product Type 2025 & 2033
- Figure 13: Europe Phototherapy Industry Revenue Share (%), by Product Type 2025 & 2033
- Figure 14: Europe Phototherapy Industry Revenue (million), by Light Type 2025 & 2033
- Figure 15: Europe Phototherapy Industry Revenue Share (%), by Light Type 2025 & 2033
- Figure 16: Europe Phototherapy Industry Revenue (million), by Application 2025 & 2033
- Figure 17: Europe Phototherapy Industry Revenue Share (%), by Application 2025 & 2033
- Figure 18: Europe Phototherapy Industry Revenue (million), by End User 2025 & 2033
- Figure 19: Europe Phototherapy Industry Revenue Share (%), by End User 2025 & 2033
- Figure 20: Europe Phototherapy Industry Revenue (million), by Country 2025 & 2033
- Figure 21: Europe Phototherapy Industry Revenue Share (%), by Country 2025 & 2033
- Figure 22: Asia Pacific Phototherapy Industry Revenue (million), by Product Type 2025 & 2033
- Figure 23: Asia Pacific Phototherapy Industry Revenue Share (%), by Product Type 2025 & 2033
- Figure 24: Asia Pacific Phototherapy Industry Revenue (million), by Light Type 2025 & 2033
- Figure 25: Asia Pacific Phototherapy Industry Revenue Share (%), by Light Type 2025 & 2033
- Figure 26: Asia Pacific Phototherapy Industry Revenue (million), by Application 2025 & 2033
- Figure 27: Asia Pacific Phototherapy Industry Revenue Share (%), by Application 2025 & 2033
- Figure 28: Asia Pacific Phototherapy Industry Revenue (million), by End User 2025 & 2033
- Figure 29: Asia Pacific Phototherapy Industry Revenue Share (%), by End User 2025 & 2033
- Figure 30: Asia Pacific Phototherapy Industry Revenue (million), by Country 2025 & 2033
- Figure 31: Asia Pacific Phototherapy Industry Revenue Share (%), by Country 2025 & 2033
- Figure 32: Middle East and Africa Phototherapy Industry Revenue (million), by Product Type 2025 & 2033
- Figure 33: Middle East and Africa Phototherapy Industry Revenue Share (%), by Product Type 2025 & 2033
- Figure 34: Middle East and Africa Phototherapy Industry Revenue (million), by Light Type 2025 & 2033
- Figure 35: Middle East and Africa Phototherapy Industry Revenue Share (%), by Light Type 2025 & 2033
- Figure 36: Middle East and Africa Phototherapy Industry Revenue (million), by Application 2025 & 2033
- Figure 37: Middle East and Africa Phototherapy Industry Revenue Share (%), by Application 2025 & 2033
- Figure 38: Middle East and Africa Phototherapy Industry Revenue (million), by End User 2025 & 2033
- Figure 39: Middle East and Africa Phototherapy Industry Revenue Share (%), by End User 2025 & 2033
- Figure 40: Middle East and Africa Phototherapy Industry Revenue (million), by Country 2025 & 2033
- Figure 41: Middle East and Africa Phototherapy Industry Revenue Share (%), by Country 2025 & 2033
- Figure 42: South America Phototherapy Industry Revenue (million), by Product Type 2025 & 2033
- Figure 43: South America Phototherapy Industry Revenue Share (%), by Product Type 2025 & 2033
- Figure 44: South America Phototherapy Industry Revenue (million), by Light Type 2025 & 2033
- Figure 45: South America Phototherapy Industry Revenue Share (%), by Light Type 2025 & 2033
- Figure 46: South America Phototherapy Industry Revenue (million), by Application 2025 & 2033
- Figure 47: South America Phototherapy Industry Revenue Share (%), by Application 2025 & 2033
- Figure 48: South America Phototherapy Industry Revenue (million), by End User 2025 & 2033
- Figure 49: South America Phototherapy Industry Revenue Share (%), by End User 2025 & 2033
- Figure 50: South America Phototherapy Industry Revenue (million), by Country 2025 & 2033
- Figure 51: South America Phototherapy Industry Revenue Share (%), by Country 2025 & 2033
List of Tables
- Table 1: Global Phototherapy Industry Revenue million Forecast, by Product Type 2020 & 2033
- Table 2: Global Phototherapy Industry Revenue million Forecast, by Light Type 2020 & 2033
- Table 3: Global Phototherapy Industry Revenue million Forecast, by Application 2020 & 2033
- Table 4: Global Phototherapy Industry Revenue million Forecast, by End User 2020 & 2033
- Table 5: Global Phototherapy Industry Revenue million Forecast, by Region 2020 & 2033
- Table 6: Global Phototherapy Industry Revenue million Forecast, by Product Type 2020 & 2033
- Table 7: Global Phototherapy Industry Revenue million Forecast, by Light Type 2020 & 2033
- Table 8: Global Phototherapy Industry Revenue million Forecast, by Application 2020 & 2033
- Table 9: Global Phototherapy Industry Revenue million Forecast, by End User 2020 & 2033
- Table 10: Global Phototherapy Industry Revenue million Forecast, by Country 2020 & 2033
- Table 11: United States Phototherapy Industry Revenue (million) Forecast, by Application 2020 & 2033
- Table 12: Canada Phototherapy Industry Revenue (million) Forecast, by Application 2020 & 2033
- Table 13: Mexico Phototherapy Industry Revenue (million) Forecast, by Application 2020 & 2033
- Table 14: Global Phototherapy Industry Revenue million Forecast, by Product Type 2020 & 2033
- Table 15: Global Phototherapy Industry Revenue million Forecast, by Light Type 2020 & 2033
- Table 16: Global Phototherapy Industry Revenue million Forecast, by Application 2020 & 2033
- Table 17: Global Phototherapy Industry Revenue million Forecast, by End User 2020 & 2033
- Table 18: Global Phototherapy Industry Revenue million Forecast, by Country 2020 & 2033
- Table 19: Germany Phototherapy Industry Revenue (million) Forecast, by Application 2020 & 2033
- Table 20: United Kingdom Phototherapy Industry Revenue (million) Forecast, by Application 2020 & 2033
- Table 21: France Phototherapy Industry Revenue (million) Forecast, by Application 2020 & 2033
- Table 22: Italy Phototherapy Industry Revenue (million) Forecast, by Application 2020 & 2033
- Table 23: Spain Phototherapy Industry Revenue (million) Forecast, by Application 2020 & 2033
- Table 24: Rest of Europe Phototherapy Industry Revenue (million) Forecast, by Application 2020 & 2033
- Table 25: Global Phototherapy Industry Revenue million Forecast, by Product Type 2020 & 2033
- Table 26: Global Phototherapy Industry Revenue million Forecast, by Light Type 2020 & 2033
- Table 27: Global Phototherapy Industry Revenue million Forecast, by Application 2020 & 2033
- Table 28: Global Phototherapy Industry Revenue million Forecast, by End User 2020 & 2033
- Table 29: Global Phototherapy Industry Revenue million Forecast, by Country 2020 & 2033
- Table 30: China Phototherapy Industry Revenue (million) Forecast, by Application 2020 & 2033
- Table 31: Japan Phototherapy Industry Revenue (million) Forecast, by Application 2020 & 2033
- Table 32: India Phototherapy Industry Revenue (million) Forecast, by Application 2020 & 2033
- Table 33: Australia Phototherapy Industry Revenue (million) Forecast, by Application 2020 & 2033
- Table 34: South Korea Phototherapy Industry Revenue (million) Forecast, by Application 2020 & 2033
- Table 35: Rest of Asia Pacific Phototherapy Industry Revenue (million) Forecast, by Application 2020 & 2033
- Table 36: Global Phototherapy Industry Revenue million Forecast, by Product Type 2020 & 2033
- Table 37: Global Phototherapy Industry Revenue million Forecast, by Light Type 2020 & 2033
- Table 38: Global Phototherapy Industry Revenue million Forecast, by Application 2020 & 2033
- Table 39: Global Phototherapy Industry Revenue million Forecast, by End User 2020 & 2033
- Table 40: Global Phototherapy Industry Revenue million Forecast, by Country 2020 & 2033
- Table 41: GCC Phototherapy Industry Revenue (million) Forecast, by Application 2020 & 2033
- Table 42: South Africa Phototherapy Industry Revenue (million) Forecast, by Application 2020 & 2033
- Table 43: Rest of Middle East and Africa Phototherapy Industry Revenue (million) Forecast, by Application 2020 & 2033
- Table 44: Global Phototherapy Industry Revenue million Forecast, by Product Type 2020 & 2033
- Table 45: Global Phototherapy Industry Revenue million Forecast, by Light Type 2020 & 2033
- Table 46: Global Phototherapy Industry Revenue million Forecast, by Application 2020 & 2033
- Table 47: Global Phototherapy Industry Revenue million Forecast, by End User 2020 & 2033
- Table 48: Global Phototherapy Industry Revenue million Forecast, by Country 2020 & 2033
- Table 49: Brazil Phototherapy Industry Revenue (million) Forecast, by Application 2020 & 2033
- Table 50: Argentina Phototherapy Industry Revenue (million) Forecast, by Application 2020 & 2033
- Table 51: Rest of South America Phototherapy Industry Revenue (million) Forecast, by Application 2020 & 2033
Frequently Asked Questions
1. What is the projected Compound Annual Growth Rate (CAGR) of the Phototherapy Industry?
The projected CAGR is approximately 4.1%.
2. Which companies are prominent players in the Phototherapy Industry?
Key companies in the market include Beurer, Zepter International, PhotoMedex Inc, Verilux Inc, Nature Bright, Revian Inc, Koninklijke Philips N V, Northern Light Technologies, Lumie, BioPhotas, Carex, Lucimed SA.
3. What are the main segments of the Phototherapy Industry?
The market segments include Product Type, Light Type, Application, End User.
4. Can you provide details about the market size?
The market size is estimated to be USD 649.37 million as of 2022.
5. What are some drivers contributing to market growth?
Growing Burden of Skin and Mental Health Disorders; Increasing Research and Development Activities.
6. What are the notable trends driving market growth?
Red Light Segment is Expected to Account for the Largest Market Share During the Forecast Period.
7. Are there any restraints impacting market growth?
Increasing Side Effects Due to Light Therapy and Product Recalls.
8. Can you provide examples of recent developments in the market?
In February 2022, STRATA Skin Sciences, Inc. announced the commercial launch of its next-generation excimer laser system, XTRAC Momentum 1.0. The XTRAC excimer laser technology allows for the precise delivery of targeted UVB light therapy to specific treatment areas of the skin for both adult and pediatric patients suffering from inflammatory skin conditions such as psoriasis, atopic dermatitis, and vitiligo.
9. What pricing options are available for accessing the report?
Pricing options include single-user, multi-user, and enterprise licenses priced at USD 4750, USD 5250, and USD 8750 respectively.
10. Is the market size provided in terms of value or volume?
The market size is provided in terms of value, measured in million.
11. Are there any specific market keywords associated with the report?
Yes, the market keyword associated with the report is "Phototherapy Industry," which aids in identifying and referencing the specific market segment covered.
12. How do I determine which pricing option suits my needs best?
The pricing options vary based on user requirements and access needs. Individual users may opt for single-user licenses, while businesses requiring broader access may choose multi-user or enterprise licenses for cost-effective access to the report.
13. Are there any additional resources or data provided in the Phototherapy Industry report?
While the report offers comprehensive insights, it's advisable to review the specific contents or supplementary materials provided to ascertain if additional resources or data are available.
14. How can I stay updated on further developments or reports in the Phototherapy Industry?
To stay informed about further developments, trends, and reports in the Phototherapy Industry, consider subscribing to industry newsletters, following relevant companies and organizations, or regularly checking reputable industry news sources and publications.
Methodology
Step 1 - Identification of Relevant Samples Size from Population Database


Step 2 - Approaches for Defining Global Market Size (Value, Volume* & Price*)

Note*: In applicable scenarios
Step 3 - Data Sources
Primary Research
- Web Analytics
- Survey Reports
- Research Institute
- Latest Research Reports
- Opinion Leaders
Secondary Research
- Annual Reports
- White Paper
- Latest Press Release
- Industry Association
- Paid Database
- Investor Presentations

Step 4 - Data Triangulation
Involves using different sources of information in order to increase the validity of a study
These sources are likely to be stakeholders in a program - participants, other researchers, program staff, other community members, and so on.
Then we put all data in single framework & apply various statistical tools to find out the dynamic on the market.
During the analysis stage, feedback from the stakeholder groups would be compared to determine areas of agreement as well as areas of divergence