

Key Insights
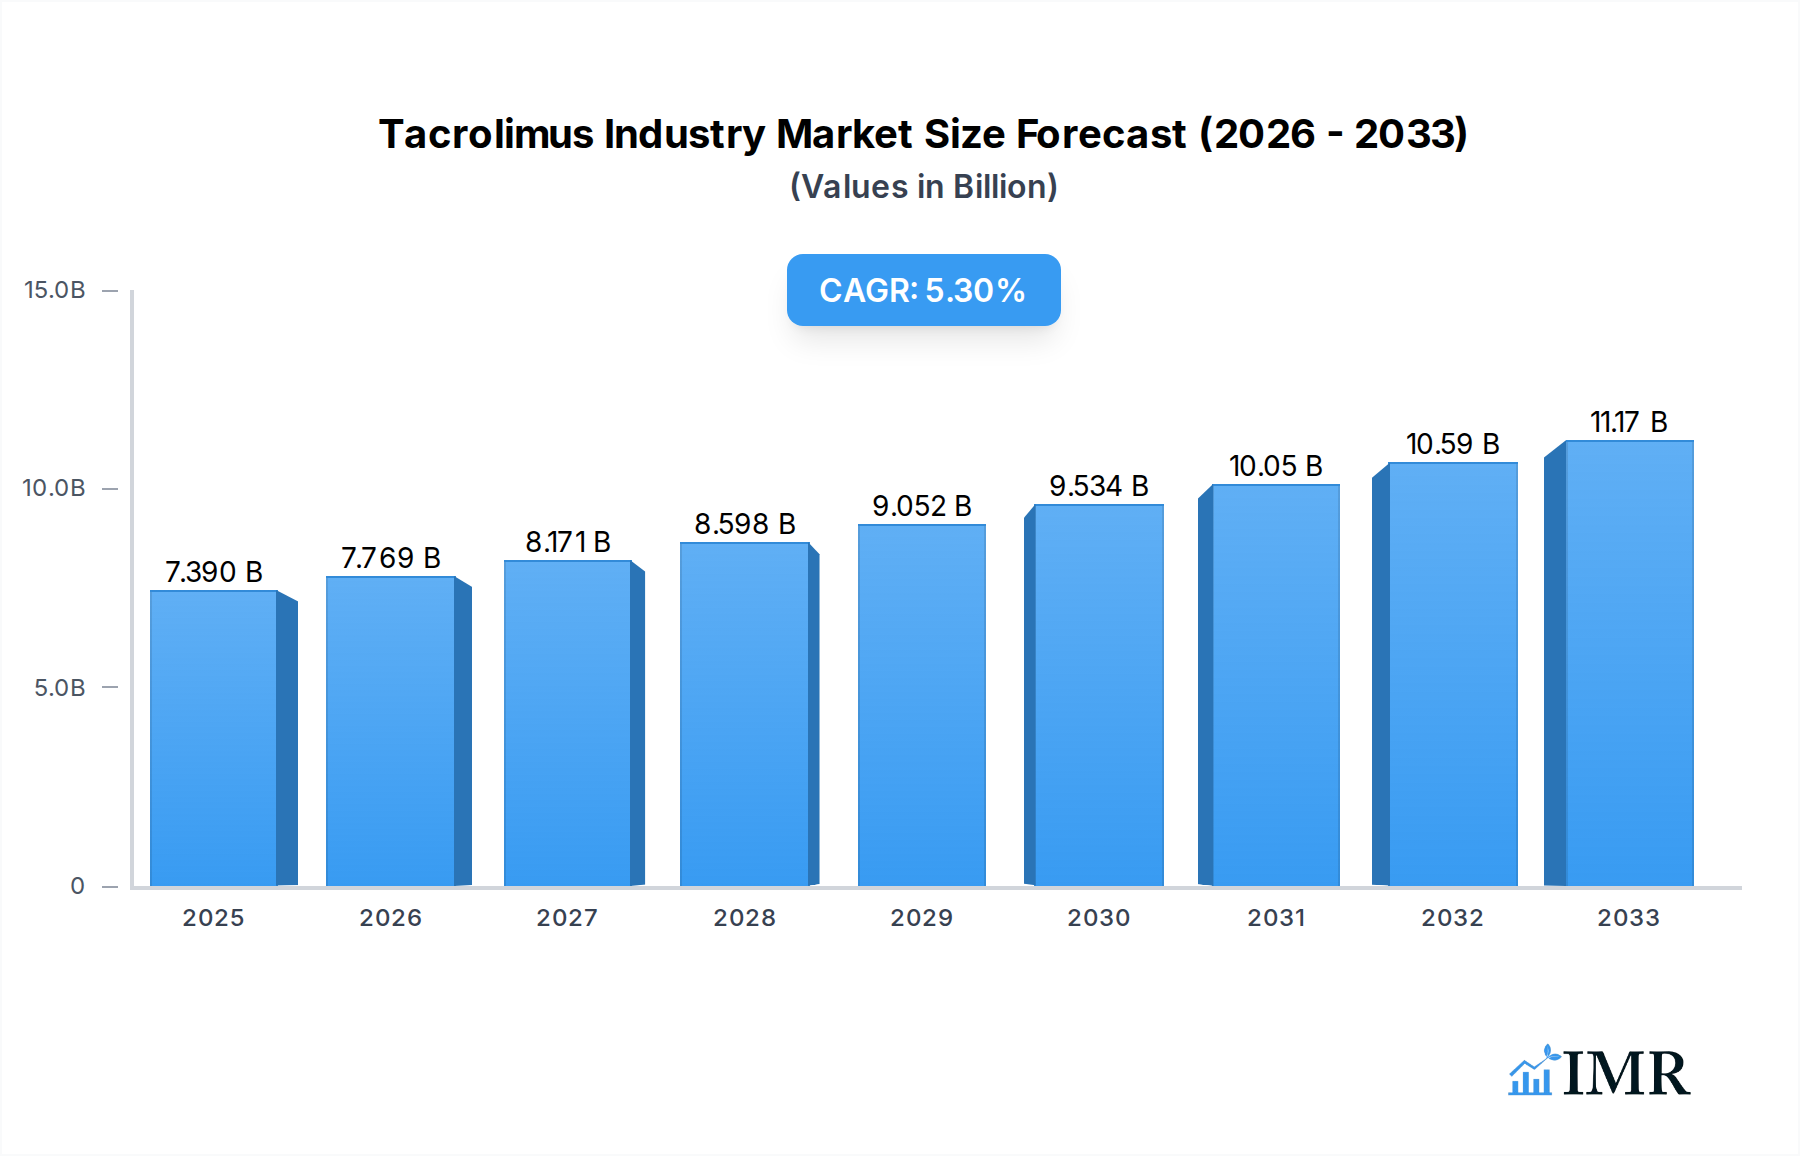
The global Tacrolimus market is poised for substantial growth, projected to reach $7.39 billion by 2025, with a robust Compound Annual Growth Rate (CAGR) of 5.15% expected throughout the forecast period of 2025-2033. This expansion is primarily fueled by the increasing prevalence of autoimmune diseases and organ transplantations worldwide. The growing demand for immunosuppressive therapies, driven by advancements in transplant procedures and better patient outcomes, forms a significant pillar of this market growth. Furthermore, the rising incidence of inflammatory skin conditions like dermatitis and eczema, where Tacrolimus formulations are extensively used for topical treatment, contributes to the market's upward trajectory. The market's dynamism is also shaped by ongoing research and development efforts focused on new drug delivery systems and innovative formulations, aiming to enhance efficacy and patient compliance.

Tacrolimus Industry Market Size (In Billion)
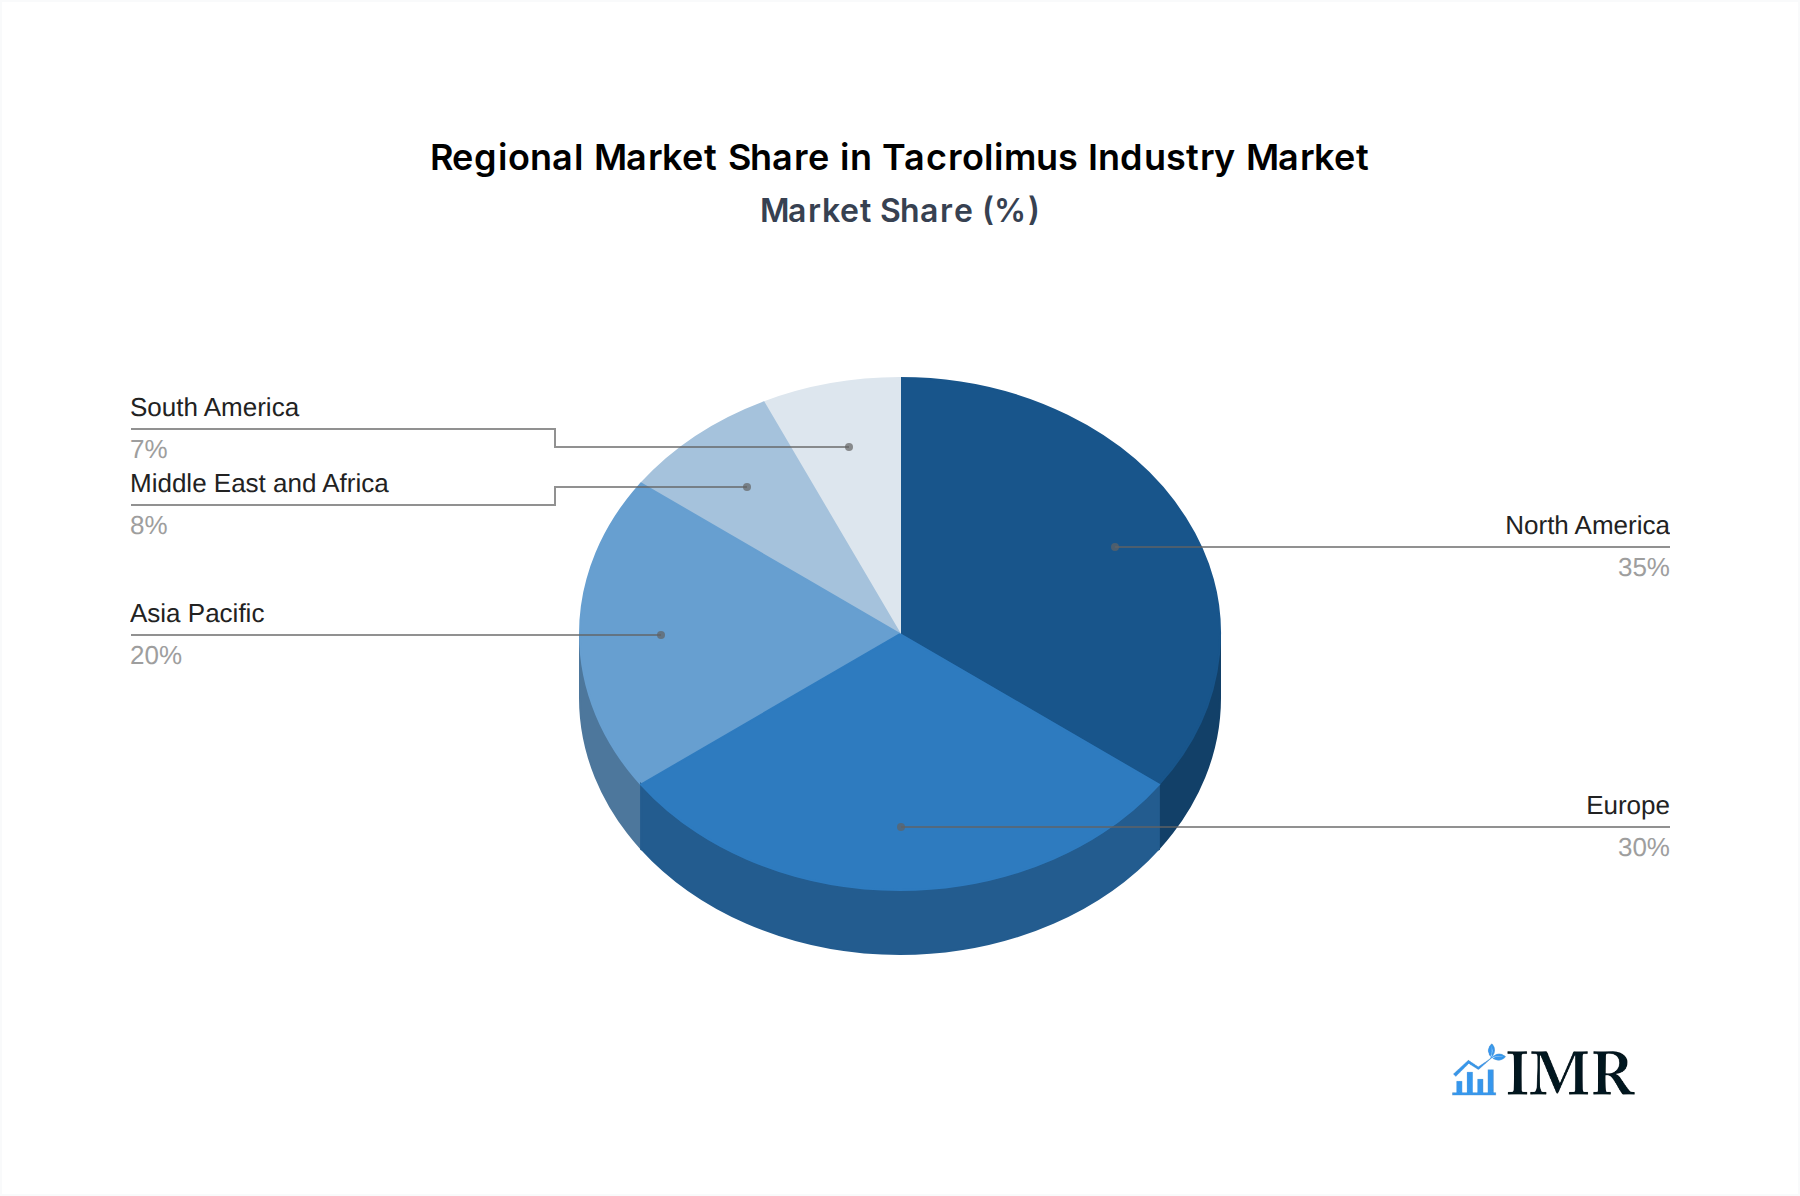
The market segmentation reveals a diverse landscape, with Tablets and Capsules dominating the product type category due to their ease of administration. In terms of applications, Immunosuppression stands out as the leading segment, directly reflecting the critical role of Tacrolimus in preventing organ rejection post-transplantation. Hospitals and Clinics represent the primary end-user segments, indicating the concentrated demand for Tacrolimus in professional healthcare settings. Geographically, North America and Europe are expected to remain dominant markets, owing to well-established healthcare infrastructure, high healthcare expenditure, and widespread access to advanced medical treatments. However, the Asia Pacific region is anticipated to exhibit the highest growth rate, driven by a burgeoning patient population, increasing healthcare awareness, and expanding access to sophisticated medical care. Key players like Pfizer Inc., Novartis AG, and GlaxoSmithKline plc are actively involved in market development through strategic partnerships and product innovations.
Tacrolimus Industry Company Market Share
This in-depth report provides a comprehensive analysis of the global Tacrolimus industry, exploring its intricate market dynamics, pivotal growth trends, regional dominance, product landscape, and future potential. Spanning from 2019 to 2033, with a base and estimated year of 2025, this study offers critical insights for industry professionals, investors, and stakeholders seeking to navigate the evolving tacrolimus market, immunosuppressant drugs, and dermatology therapeutics. The report delves into the child market of specific applications like vitiligo treatment and eczema management, alongside the parent market of broader immunosuppression, ensuring a holistic view of the tacrolimus market size, tacrolimus market share, and tacrolimus market growth.
Tacrolimus Industry Market Dynamics & Structure
The global tacrolimus market exhibits a moderately concentrated structure, driven by significant R&D investments and stringent regulatory approvals required for immunosuppressant drugs. Technological innovation in drug delivery systems and novel formulations for tacrolimus applications are key drivers, alongside evolving regulatory frameworks that influence market access and generic competition. Competitive product substitutes, primarily other calcineurin inhibitors, present a constant challenge, necessitating continuous innovation and cost-effectiveness. End-user demographics, particularly the rising incidence of organ transplantations and chronic autoimmune diseases, significantly shape demand. Mergers and acquisitions (M&A) are active, with companies like Pfizer Inc., Astellas Pharma Inc., and Novartis AG strategically consolidating their positions to enhance market reach and product portfolios. The tacrolimus market trends indicate a growing emphasis on specialized formulations for niche applications like dermatitis treatment.
- Market Concentration: Dominated by a few key global players, with a growing presence of emerging generic manufacturers.
- Technological Innovation Drivers: Development of extended-release formulations, topical tacrolimus for dermatological conditions, and improved patient compliance.
- Regulatory Frameworks: FDA, EMA, and other regional health authorities play a crucial role in drug approval, pricing, and market entry strategies for tacrolimus products.
- Competitive Product Substitutes: Cyclosporine, sirolimus, and other immunosuppressants impacting market share.
- End-User Demographics: Aging populations, increasing organ transplant rates, and a higher prevalence of autoimmune disorders.
- M&A Trends: Strategic acquisitions and partnerships to expand geographic presence and R&D capabilities, impacting the overall tacrolimus industry structure.
Tacrolimus Industry Growth Trends & Insights
The tacrolimus industry is poised for robust growth, projected to reach a market size of approximately $XX billion by 2033, with a Compound Annual Growth Rate (CAGR) of XX%. This expansion is fueled by escalating organ transplantations globally, a critical application driving the demand for tacrolimus for immunosuppression. Furthermore, the increasing prevalence of chronic skin conditions like atopic dermatitis and vitiligo is significantly boosting the adoption of topical tacrolimus formulations, contributing to the child market growth of dermatological applications. Tacrolimus market penetration is expected to deepen as awareness regarding its efficacy in managing these conditions grows, particularly in developing economies. Technological advancements in drug formulation, leading to improved bioavailability and patient compliance, are key disruptors. Shifts in consumer behavior, favoring non-corticosteroid treatments for dermatological issues, further accelerate market adoption. The tacrolimus market forecast indicates sustained demand for both oral and topical forms, with a particular surge in the latter due to its favorable safety profile compared to topical steroids. The rising healthcare expenditure in emerging markets and the increasing availability of generics are also significant growth enablers for the tacrolimus market outlook. Analysis of tacrolimus market CAGR reveals a consistent upward trajectory, reflecting the indispensable role of this drug in post-transplant care and inflammatory disease management.
Dominant Regions, Countries, or Segments in Tacrolimus Industry
North America, particularly the United States, currently dominates the tacrolimus market, driven by advanced healthcare infrastructure, high organ transplant rates, and significant R&D investments. The strong presence of key players like Pfizer Inc. and Lupin Pharmaceuticals Inc., coupled with favorable reimbursement policies for immunosuppressants, underpins this regional dominance. In terms of product type, Tablets and Capsules represent the largest segment, catering primarily to post-transplant immunosuppression. However, the Others (Ointments, Granules) segment, encompassing topical tacrolimus formulations, is witnessing accelerated growth due to the rising incidence of dermatitis and eczema, emerging as a critical child market for tacrolimus.
Application-wise, Immunosuppression remains the leading segment, accounting for the majority of the market share. However, Dermatitis is rapidly gaining traction, driven by increasing diagnoses of atopic dermatitis and the growing preference for non-steroidal treatments. This application segment is expected to exhibit a higher CAGR, indicating a significant shift in market dynamics.
End-user analysis reveals that Hospitals are the primary consumers of tacrolimus, owing to their role in performing transplant surgeries and managing complex immunosuppressive regimens. Clinics, particularly dermatology clinics, are becoming increasingly significant as topical tacrolimus gains popularity for treating skin conditions.
Key drivers for regional dominance include:
- Economic Policies: Robust healthcare spending and supportive government initiatives for organ transplantation programs.
- Infrastructure: Well-established healthcare networks and advanced medical facilities.
- Prevalence of Diseases: Higher incidence rates of organ failure and chronic inflammatory skin conditions.
- Regulatory Landscape: Favorable approval pathways and patent protection for innovative formulations.
- Market Share: North America holds an estimated XX% of the global tacrolimus market, followed by Europe (XX%) and Asia Pacific (XX%).
- Growth Potential: The Asia Pacific region, driven by increasing healthcare access and a growing middle class, presents substantial growth potential for the tacrolimus market.
Tacrolimus Industry Product Landscape
The tacrolimus product landscape is characterized by ongoing innovation aimed at enhancing efficacy, safety, and patient convenience. Primary product forms include oral formulations (tablets and capsules) for systemic immunosuppression and topical formulations (ointments) for dermatological conditions. Recent advancements focus on controlled-release formulations to optimize drug delivery and reduce dosing frequency, thereby improving patient adherence in immunosuppression therapy. For dermatological applications, efforts are directed towards developing more palatable and cosmetically acceptable topical products. The unique selling proposition of tacrolimus lies in its potent immunosuppressive activity with a potentially better safety profile than some older agents. Technological advancements in manufacturing processes are also contributing to cost-effectiveness, making tacrolimus accessible to a wider patient population.
Key Drivers, Barriers & Challenges in Tacrolimus Industry
Key Drivers:
- Rising Organ Transplantations: The escalating number of organ transplants worldwide is a primary driver for the immunosuppressant tacrolimus market.
- Increasing Prevalence of Autoimmune & Inflammatory Diseases: Growing incidence of conditions like atopic dermatitis, eczema, and vitiligo fuels demand for topical tacrolimus.
- Technological Advancements: Development of novel formulations, improved delivery systems, and combination therapies.
- Growing Healthcare Expenditure: Increased investment in healthcare infrastructure and access to advanced treatments, especially in emerging economies.
Barriers & Challenges:
- Stringent Regulatory Approvals: The complex and time-consuming approval processes for new tacrolimus products and formulations.
- High Cost of Treatment: The significant expense associated with immunosuppressive therapy can limit access for some patient populations.
- Availability of Generic Alternatives: Intense competition from generic manufacturers can impact pricing and profit margins for innovator companies.
- Potential Side Effects: While generally well-tolerated, tacrolimus can have side effects that require careful monitoring and management, impacting patient compliance.
- Supply Chain Disruptions: Global events can impact the availability and cost of raw materials and finished products.
Emerging Opportunities in Tacrolimus Industry
Emerging opportunities in the tacrolimus industry lie in the development of novel drug delivery systems for enhanced patient compliance, particularly for pediatric populations and those with difficulties in oral administration. The untapped potential of tacrolimus for vitiligo treatment represents a significant avenue for growth, with ongoing research exploring its efficacy in repigmentation. Furthermore, exploring combination therapies with other immunomodulators or biologics for refractory autoimmune diseases presents a promising area for innovation. The increasing demand for non-corticosteroid alternatives in dermatology creates a fertile ground for expanding the market share of topical tacrolimus. Expansion into emerging markets with increasing healthcare access also offers substantial growth potential.
Growth Accelerators in the Tacrolimus Industry Industry
Long-term growth in the tacrolimus industry is being accelerated by significant technological breakthroughs, including the development of nano-formulations for targeted drug delivery and improved absorption. Strategic partnerships between pharmaceutical companies and research institutions are fostering innovation in understanding the complex mechanisms of immunosuppression and dermatological inflammation, leading to new therapeutic applications. Market expansion strategies, focusing on penetrating underserved geographical regions and increasing patient access through affordable pricing models and generic availability, are also key catalysts. The growing body of clinical evidence supporting the long-term efficacy and safety of tacrolimus in various chronic conditions further solidifies its position and drives sustained market expansion.
Key Players Shaping the Tacrolimus Industry Market
- Lupin Pharmaceuticals Inc.
- Glenmark Pharmaceuticals Inc.
- Panacea Biotec
- Astellas Pharma Inc.
- LEO Pharma A/S
- GlaxoSmithKline plc
- Novartis AG
- Biocon Ltd
- Dr Reddy's Laboratories Ltd
- Pfizer Inc.
Notable Milestones in Tacrolimus Industry Sector
- 1984: Discovery of Tacrolimus (FK506).
- 1994: First FDA approval of Tacrolimus for preventing organ rejection in kidney and liver transplants.
- 2000: Introduction of topical Tacrolimus for treating moderate to severe atopic dermatitis.
- 2003: FDA approval for Tacrolimus for preventing graft-versus-host disease after bone marrow transplantation.
- 2010s: Expansion of indications for topical Tacrolimus to other inflammatory skin conditions.
- 2015-2020: Significant increase in the number of generic Tacrolimus formulations entering the market globally, increasing accessibility.
- 2021: Ongoing research into Tacrolimus for vitiligo treatment shows promising results, indicating future market expansion.
- 2023: Advancements in nano-formulations for improved topical delivery and reduced systemic absorption.
In-Depth Tacrolimus Industry Market Outlook
The future outlook for the tacrolimus industry is exceptionally promising, characterized by sustained growth driven by the expanding applications in immunosuppression and the burgeoning field of dermatology. Anticipated market expansion in emerging economies, coupled with advancements in drug delivery and formulation technologies, will be key growth accelerators. Strategic collaborations and a focus on unmet medical needs, particularly in autoimmune and inflammatory conditions, will unlock new opportunities. The continued importance of tacrolimus in organ transplantation, alongside its growing role in treating chronic skin diseases, ensures its enduring relevance and strong market potential in the forecast period.
Tacrolimus Industry Segmentation
-
1. Product Type
- 1.1. Tablets and Capsules
- 1.2. Injections
- 1.3. Others (Ointments, Granules)
-
2. Application
- 2.1. Immunosuppression
- 2.2. Dermatitis
- 2.3. Others (Vitiligo, Eczema)
-
3. End Users
- 3.1. Hospitals
- 3.2. Clinics
- 3.3. Other End Users
Tacrolimus Industry Segmentation By Geography
-
1. North America
- 1.1. United States
- 1.2. Canada
- 1.3. Mexico
-
2. Europe
- 2.1. Germany
- 2.2. United Kingdom
- 2.3. France
- 2.4. Italy
- 2.5. Spain
- 2.6. Rest of Europe
-
3. Asia Pacific
- 3.1. China
- 3.2. Japan
- 3.3. India
- 3.4. Australia
- 3.5. South Korea
- 3.6. Rest of Asia Pacific
-
4. Middle East and Africa
- 4.1. GCC
- 4.2. South Africa
- 4.3. Rest of Middle East and Africa
-
5. South America
- 5.1. Brazil
- 5.2. Argentina
- 5.3. Rest of South America
Tacrolimus Industry Regional Market Share
Geographic Coverage of Tacrolimus Industry
Tacrolimus Industry REPORT HIGHLIGHTS
| Aspects | Details |
|---|---|
| Study Period | 2020-2034 |
| Base Year | 2025 |
| Estimated Year | 2026 |
| Forecast Period | 2026-2034 |
| Historical Period | 2020-2025 |
| Growth Rate | CAGR of 5.15% from 2020-2034 |
| Segmentation |
|
Table of Contents
- 1. Introduction
- 1.1. Research Scope
- 1.2. Market Segmentation
- 1.3. Research Objective
- 1.4. Definitions and Assumptions
- 2. Executive Summary
- 2.1. Market Snapshot
- 3. Market Dynamics
- 3.1. Market Drivers
- 3.2. Market Restrains
- 3.3. Market Trends
- 3.4. Market Opportunities
- 4. Market Factor Analysis
- 4.1. Porters Five Forces
- 4.1.1. Bargaining Power of Suppliers
- 4.1.2. Bargaining Power of Buyers
- 4.1.3. Threat of New Entrants
- 4.1.4. Threat of Substitutes
- 4.1.5. Competitive Rivalry
- 4.2. PESTEL analysis
- 4.3. BCG Analysis
- 4.3.1. Stars (High Growth, High Market Share)
- 4.3.2. Cash Cows (Low Growth, High Market Share)
- 4.3.3. Question Mark (High Growth, Low Market Share)
- 4.3.4. Dogs (Low Growth, Low Market Share)
- 4.4. Ansoff Matrix Analysis
- 4.5. Supply Chain Analysis
- 4.6. Regulatory Landscape
- 4.7. Current Market Potential and Opportunity Assessment (TAM–SAM–SOM Framework)
- 4.8. IMR Analyst Note
- 4.1. Porters Five Forces
- 5. Market Analysis, Insights and Forecast 2021-2033
- 5.1. Market Analysis, Insights and Forecast - by Product Type
- 5.1.1. Tablets and Capsules
- 5.1.2. Injections
- 5.1.3. Others (Ointments, Granules)
- 5.2. Market Analysis, Insights and Forecast - by Application
- 5.2.1. Immunosuppression
- 5.2.2. Dermatitis
- 5.2.3. Others (Vitiligo, Eczema)
- 5.3. Market Analysis, Insights and Forecast - by End Users
- 5.3.1. Hospitals
- 5.3.2. Clinics
- 5.3.3. Other End Users
- 5.4. Market Analysis, Insights and Forecast - by Region
- 5.4.1. North America
- 5.4.2. Europe
- 5.4.3. Asia Pacific
- 5.4.4. Middle East and Africa
- 5.4.5. South America
- 5.1. Market Analysis, Insights and Forecast - by Product Type
- 6. Global Tacrolimus Industry Analysis, Insights and Forecast, 2021-2033
- 6.1. Market Analysis, Insights and Forecast - by Product Type
- 6.1.1. Tablets and Capsules
- 6.1.2. Injections
- 6.1.3. Others (Ointments, Granules)
- 6.2. Market Analysis, Insights and Forecast - by Application
- 6.2.1. Immunosuppression
- 6.2.2. Dermatitis
- 6.2.3. Others (Vitiligo, Eczema)
- 6.3. Market Analysis, Insights and Forecast - by End Users
- 6.3.1. Hospitals
- 6.3.2. Clinics
- 6.3.3. Other End Users
- 6.1. Market Analysis, Insights and Forecast - by Product Type
- 7. North America Tacrolimus Industry Analysis, Insights and Forecast, 2020-2032
- 7.1. Market Analysis, Insights and Forecast - by Product Type
- 7.1.1. Tablets and Capsules
- 7.1.2. Injections
- 7.1.3. Others (Ointments, Granules)
- 7.2. Market Analysis, Insights and Forecast - by Application
- 7.2.1. Immunosuppression
- 7.2.2. Dermatitis
- 7.2.3. Others (Vitiligo, Eczema)
- 7.3. Market Analysis, Insights and Forecast - by End Users
- 7.3.1. Hospitals
- 7.3.2. Clinics
- 7.3.3. Other End Users
- 7.1. Market Analysis, Insights and Forecast - by Product Type
- 8. Europe Tacrolimus Industry Analysis, Insights and Forecast, 2020-2032
- 8.1. Market Analysis, Insights and Forecast - by Product Type
- 8.1.1. Tablets and Capsules
- 8.1.2. Injections
- 8.1.3. Others (Ointments, Granules)
- 8.2. Market Analysis, Insights and Forecast - by Application
- 8.2.1. Immunosuppression
- 8.2.2. Dermatitis
- 8.2.3. Others (Vitiligo, Eczema)
- 8.3. Market Analysis, Insights and Forecast - by End Users
- 8.3.1. Hospitals
- 8.3.2. Clinics
- 8.3.3. Other End Users
- 8.1. Market Analysis, Insights and Forecast - by Product Type
- 9. Asia Pacific Tacrolimus Industry Analysis, Insights and Forecast, 2020-2032
- 9.1. Market Analysis, Insights and Forecast - by Product Type
- 9.1.1. Tablets and Capsules
- 9.1.2. Injections
- 9.1.3. Others (Ointments, Granules)
- 9.2. Market Analysis, Insights and Forecast - by Application
- 9.2.1. Immunosuppression
- 9.2.2. Dermatitis
- 9.2.3. Others (Vitiligo, Eczema)
- 9.3. Market Analysis, Insights and Forecast - by End Users
- 9.3.1. Hospitals
- 9.3.2. Clinics
- 9.3.3. Other End Users
- 9.1. Market Analysis, Insights and Forecast - by Product Type
- 10. Middle East and Africa Tacrolimus Industry Analysis, Insights and Forecast, 2020-2032
- 10.1. Market Analysis, Insights and Forecast - by Product Type
- 10.1.1. Tablets and Capsules
- 10.1.2. Injections
- 10.1.3. Others (Ointments, Granules)
- 10.2. Market Analysis, Insights and Forecast - by Application
- 10.2.1. Immunosuppression
- 10.2.2. Dermatitis
- 10.2.3. Others (Vitiligo, Eczema)
- 10.3. Market Analysis, Insights and Forecast - by End Users
- 10.3.1. Hospitals
- 10.3.2. Clinics
- 10.3.3. Other End Users
- 10.1. Market Analysis, Insights and Forecast - by Product Type
- 11. South America Tacrolimus Industry Analysis, Insights and Forecast, 2020-2032
- 11.1. Market Analysis, Insights and Forecast - by Product Type
- 11.1.1. Tablets and Capsules
- 11.1.2. Injections
- 11.1.3. Others (Ointments, Granules)
- 11.2. Market Analysis, Insights and Forecast - by Application
- 11.2.1. Immunosuppression
- 11.2.2. Dermatitis
- 11.2.3. Others (Vitiligo, Eczema)
- 11.3. Market Analysis, Insights and Forecast - by End Users
- 11.3.1. Hospitals
- 11.3.2. Clinics
- 11.3.3. Other End Users
- 11.1. Market Analysis, Insights and Forecast - by Product Type
- 12. Competitive Analysis
- 12.1. Company Profiles
- 12.1.1 Lupin Pharmaceuticals Inc
- 12.1.1.1. Company Overview
- 12.1.1.2. Products
- 12.1.1.3. Company Financials
- 12.1.1.4. SWOT Analysis
- 12.1.2 Glenmark Pharmaceuticals Inc
- 12.1.2.1. Company Overview
- 12.1.2.2. Products
- 12.1.2.3. Company Financials
- 12.1.2.4. SWOT Analysis
- 12.1.3 Panacea Biotec
- 12.1.3.1. Company Overview
- 12.1.3.2. Products
- 12.1.3.3. Company Financials
- 12.1.3.4. SWOT Analysis
- 12.1.4 Astellas Pharma Inc
- 12.1.4.1. Company Overview
- 12.1.4.2. Products
- 12.1.4.3. Company Financials
- 12.1.4.4. SWOT Analysis
- 12.1.5 LEO Pharma A/S
- 12.1.5.1. Company Overview
- 12.1.5.2. Products
- 12.1.5.3. Company Financials
- 12.1.5.4. SWOT Analysis
- 12.1.6 GlaxoSmithKline plc
- 12.1.6.1. Company Overview
- 12.1.6.2. Products
- 12.1.6.3. Company Financials
- 12.1.6.4. SWOT Analysis
- 12.1.7 Novartis AG
- 12.1.7.1. Company Overview
- 12.1.7.2. Products
- 12.1.7.3. Company Financials
- 12.1.7.4. SWOT Analysis
- 12.1.8 Biocon Ltd
- 12.1.8.1. Company Overview
- 12.1.8.2. Products
- 12.1.8.3. Company Financials
- 12.1.8.4. SWOT Analysis
- 12.1.9 Dr Reddy's Laboratories Ltd
- 12.1.9.1. Company Overview
- 12.1.9.2. Products
- 12.1.9.3. Company Financials
- 12.1.9.4. SWOT Analysis
- 12.1.10 Pfizer Inc
- 12.1.10.1. Company Overview
- 12.1.10.2. Products
- 12.1.10.3. Company Financials
- 12.1.10.4. SWOT Analysis
- 12.1.1 Lupin Pharmaceuticals Inc
- 12.2. Market Entropy
- 12.2.1 Company's Key Areas Served
- 12.2.2 Recent Developments
- 12.3. Company Market Share Analysis 2025
- 12.3.1 Top 5 Companies Market Share Analysis
- 12.3.2 Top 3 Companies Market Share Analysis
- 12.4. List of Potential Customers
- 13. Research Methodology
List of Figures
- Figure 1: Global Tacrolimus Industry Revenue Breakdown (billion, %) by Region 2025 & 2033
- Figure 2: Global Tacrolimus Industry Volume Breakdown (K Unit, %) by Region 2025 & 2033
- Figure 3: North America Tacrolimus Industry Revenue (billion), by Product Type 2025 & 2033
- Figure 4: North America Tacrolimus Industry Volume (K Unit), by Product Type 2025 & 2033
- Figure 5: North America Tacrolimus Industry Revenue Share (%), by Product Type 2025 & 2033
- Figure 6: North America Tacrolimus Industry Volume Share (%), by Product Type 2025 & 2033
- Figure 7: North America Tacrolimus Industry Revenue (billion), by Application 2025 & 2033
- Figure 8: North America Tacrolimus Industry Volume (K Unit), by Application 2025 & 2033
- Figure 9: North America Tacrolimus Industry Revenue Share (%), by Application 2025 & 2033
- Figure 10: North America Tacrolimus Industry Volume Share (%), by Application 2025 & 2033
- Figure 11: North America Tacrolimus Industry Revenue (billion), by End Users 2025 & 2033
- Figure 12: North America Tacrolimus Industry Volume (K Unit), by End Users 2025 & 2033
- Figure 13: North America Tacrolimus Industry Revenue Share (%), by End Users 2025 & 2033
- Figure 14: North America Tacrolimus Industry Volume Share (%), by End Users 2025 & 2033
- Figure 15: North America Tacrolimus Industry Revenue (billion), by Country 2025 & 2033
- Figure 16: North America Tacrolimus Industry Volume (K Unit), by Country 2025 & 2033
- Figure 17: North America Tacrolimus Industry Revenue Share (%), by Country 2025 & 2033
- Figure 18: North America Tacrolimus Industry Volume Share (%), by Country 2025 & 2033
- Figure 19: Europe Tacrolimus Industry Revenue (billion), by Product Type 2025 & 2033
- Figure 20: Europe Tacrolimus Industry Volume (K Unit), by Product Type 2025 & 2033
- Figure 21: Europe Tacrolimus Industry Revenue Share (%), by Product Type 2025 & 2033
- Figure 22: Europe Tacrolimus Industry Volume Share (%), by Product Type 2025 & 2033
- Figure 23: Europe Tacrolimus Industry Revenue (billion), by Application 2025 & 2033
- Figure 24: Europe Tacrolimus Industry Volume (K Unit), by Application 2025 & 2033
- Figure 25: Europe Tacrolimus Industry Revenue Share (%), by Application 2025 & 2033
- Figure 26: Europe Tacrolimus Industry Volume Share (%), by Application 2025 & 2033
- Figure 27: Europe Tacrolimus Industry Revenue (billion), by End Users 2025 & 2033
- Figure 28: Europe Tacrolimus Industry Volume (K Unit), by End Users 2025 & 2033
- Figure 29: Europe Tacrolimus Industry Revenue Share (%), by End Users 2025 & 2033
- Figure 30: Europe Tacrolimus Industry Volume Share (%), by End Users 2025 & 2033
- Figure 31: Europe Tacrolimus Industry Revenue (billion), by Country 2025 & 2033
- Figure 32: Europe Tacrolimus Industry Volume (K Unit), by Country 2025 & 2033
- Figure 33: Europe Tacrolimus Industry Revenue Share (%), by Country 2025 & 2033
- Figure 34: Europe Tacrolimus Industry Volume Share (%), by Country 2025 & 2033
- Figure 35: Asia Pacific Tacrolimus Industry Revenue (billion), by Product Type 2025 & 2033
- Figure 36: Asia Pacific Tacrolimus Industry Volume (K Unit), by Product Type 2025 & 2033
- Figure 37: Asia Pacific Tacrolimus Industry Revenue Share (%), by Product Type 2025 & 2033
- Figure 38: Asia Pacific Tacrolimus Industry Volume Share (%), by Product Type 2025 & 2033
- Figure 39: Asia Pacific Tacrolimus Industry Revenue (billion), by Application 2025 & 2033
- Figure 40: Asia Pacific Tacrolimus Industry Volume (K Unit), by Application 2025 & 2033
- Figure 41: Asia Pacific Tacrolimus Industry Revenue Share (%), by Application 2025 & 2033
- Figure 42: Asia Pacific Tacrolimus Industry Volume Share (%), by Application 2025 & 2033
- Figure 43: Asia Pacific Tacrolimus Industry Revenue (billion), by End Users 2025 & 2033
- Figure 44: Asia Pacific Tacrolimus Industry Volume (K Unit), by End Users 2025 & 2033
- Figure 45: Asia Pacific Tacrolimus Industry Revenue Share (%), by End Users 2025 & 2033
- Figure 46: Asia Pacific Tacrolimus Industry Volume Share (%), by End Users 2025 & 2033
- Figure 47: Asia Pacific Tacrolimus Industry Revenue (billion), by Country 2025 & 2033
- Figure 48: Asia Pacific Tacrolimus Industry Volume (K Unit), by Country 2025 & 2033
- Figure 49: Asia Pacific Tacrolimus Industry Revenue Share (%), by Country 2025 & 2033
- Figure 50: Asia Pacific Tacrolimus Industry Volume Share (%), by Country 2025 & 2033
- Figure 51: Middle East and Africa Tacrolimus Industry Revenue (billion), by Product Type 2025 & 2033
- Figure 52: Middle East and Africa Tacrolimus Industry Volume (K Unit), by Product Type 2025 & 2033
- Figure 53: Middle East and Africa Tacrolimus Industry Revenue Share (%), by Product Type 2025 & 2033
- Figure 54: Middle East and Africa Tacrolimus Industry Volume Share (%), by Product Type 2025 & 2033
- Figure 55: Middle East and Africa Tacrolimus Industry Revenue (billion), by Application 2025 & 2033
- Figure 56: Middle East and Africa Tacrolimus Industry Volume (K Unit), by Application 2025 & 2033
- Figure 57: Middle East and Africa Tacrolimus Industry Revenue Share (%), by Application 2025 & 2033
- Figure 58: Middle East and Africa Tacrolimus Industry Volume Share (%), by Application 2025 & 2033
- Figure 59: Middle East and Africa Tacrolimus Industry Revenue (billion), by End Users 2025 & 2033
- Figure 60: Middle East and Africa Tacrolimus Industry Volume (K Unit), by End Users 2025 & 2033
- Figure 61: Middle East and Africa Tacrolimus Industry Revenue Share (%), by End Users 2025 & 2033
- Figure 62: Middle East and Africa Tacrolimus Industry Volume Share (%), by End Users 2025 & 2033
- Figure 63: Middle East and Africa Tacrolimus Industry Revenue (billion), by Country 2025 & 2033
- Figure 64: Middle East and Africa Tacrolimus Industry Volume (K Unit), by Country 2025 & 2033
- Figure 65: Middle East and Africa Tacrolimus Industry Revenue Share (%), by Country 2025 & 2033
- Figure 66: Middle East and Africa Tacrolimus Industry Volume Share (%), by Country 2025 & 2033
- Figure 67: South America Tacrolimus Industry Revenue (billion), by Product Type 2025 & 2033
- Figure 68: South America Tacrolimus Industry Volume (K Unit), by Product Type 2025 & 2033
- Figure 69: South America Tacrolimus Industry Revenue Share (%), by Product Type 2025 & 2033
- Figure 70: South America Tacrolimus Industry Volume Share (%), by Product Type 2025 & 2033
- Figure 71: South America Tacrolimus Industry Revenue (billion), by Application 2025 & 2033
- Figure 72: South America Tacrolimus Industry Volume (K Unit), by Application 2025 & 2033
- Figure 73: South America Tacrolimus Industry Revenue Share (%), by Application 2025 & 2033
- Figure 74: South America Tacrolimus Industry Volume Share (%), by Application 2025 & 2033
- Figure 75: South America Tacrolimus Industry Revenue (billion), by End Users 2025 & 2033
- Figure 76: South America Tacrolimus Industry Volume (K Unit), by End Users 2025 & 2033
- Figure 77: South America Tacrolimus Industry Revenue Share (%), by End Users 2025 & 2033
- Figure 78: South America Tacrolimus Industry Volume Share (%), by End Users 2025 & 2033
- Figure 79: South America Tacrolimus Industry Revenue (billion), by Country 2025 & 2033
- Figure 80: South America Tacrolimus Industry Volume (K Unit), by Country 2025 & 2033
- Figure 81: South America Tacrolimus Industry Revenue Share (%), by Country 2025 & 2033
- Figure 82: South America Tacrolimus Industry Volume Share (%), by Country 2025 & 2033
List of Tables
- Table 1: Global Tacrolimus Industry Revenue billion Forecast, by Product Type 2020 & 2033
- Table 2: Global Tacrolimus Industry Volume K Unit Forecast, by Product Type 2020 & 2033
- Table 3: Global Tacrolimus Industry Revenue billion Forecast, by Application 2020 & 2033
- Table 4: Global Tacrolimus Industry Volume K Unit Forecast, by Application 2020 & 2033
- Table 5: Global Tacrolimus Industry Revenue billion Forecast, by End Users 2020 & 2033
- Table 6: Global Tacrolimus Industry Volume K Unit Forecast, by End Users 2020 & 2033
- Table 7: Global Tacrolimus Industry Revenue billion Forecast, by Region 2020 & 2033
- Table 8: Global Tacrolimus Industry Volume K Unit Forecast, by Region 2020 & 2033
- Table 9: Global Tacrolimus Industry Revenue billion Forecast, by Product Type 2020 & 2033
- Table 10: Global Tacrolimus Industry Volume K Unit Forecast, by Product Type 2020 & 2033
- Table 11: Global Tacrolimus Industry Revenue billion Forecast, by Application 2020 & 2033
- Table 12: Global Tacrolimus Industry Volume K Unit Forecast, by Application 2020 & 2033
- Table 13: Global Tacrolimus Industry Revenue billion Forecast, by End Users 2020 & 2033
- Table 14: Global Tacrolimus Industry Volume K Unit Forecast, by End Users 2020 & 2033
- Table 15: Global Tacrolimus Industry Revenue billion Forecast, by Country 2020 & 2033
- Table 16: Global Tacrolimus Industry Volume K Unit Forecast, by Country 2020 & 2033
- Table 17: United States Tacrolimus Industry Revenue (billion) Forecast, by Application 2020 & 2033
- Table 18: United States Tacrolimus Industry Volume (K Unit) Forecast, by Application 2020 & 2033
- Table 19: Canada Tacrolimus Industry Revenue (billion) Forecast, by Application 2020 & 2033
- Table 20: Canada Tacrolimus Industry Volume (K Unit) Forecast, by Application 2020 & 2033
- Table 21: Mexico Tacrolimus Industry Revenue (billion) Forecast, by Application 2020 & 2033
- Table 22: Mexico Tacrolimus Industry Volume (K Unit) Forecast, by Application 2020 & 2033
- Table 23: Global Tacrolimus Industry Revenue billion Forecast, by Product Type 2020 & 2033
- Table 24: Global Tacrolimus Industry Volume K Unit Forecast, by Product Type 2020 & 2033
- Table 25: Global Tacrolimus Industry Revenue billion Forecast, by Application 2020 & 2033
- Table 26: Global Tacrolimus Industry Volume K Unit Forecast, by Application 2020 & 2033
- Table 27: Global Tacrolimus Industry Revenue billion Forecast, by End Users 2020 & 2033
- Table 28: Global Tacrolimus Industry Volume K Unit Forecast, by End Users 2020 & 2033
- Table 29: Global Tacrolimus Industry Revenue billion Forecast, by Country 2020 & 2033
- Table 30: Global Tacrolimus Industry Volume K Unit Forecast, by Country 2020 & 2033
- Table 31: Germany Tacrolimus Industry Revenue (billion) Forecast, by Application 2020 & 2033
- Table 32: Germany Tacrolimus Industry Volume (K Unit) Forecast, by Application 2020 & 2033
- Table 33: United Kingdom Tacrolimus Industry Revenue (billion) Forecast, by Application 2020 & 2033
- Table 34: United Kingdom Tacrolimus Industry Volume (K Unit) Forecast, by Application 2020 & 2033
- Table 35: France Tacrolimus Industry Revenue (billion) Forecast, by Application 2020 & 2033
- Table 36: France Tacrolimus Industry Volume (K Unit) Forecast, by Application 2020 & 2033
- Table 37: Italy Tacrolimus Industry Revenue (billion) Forecast, by Application 2020 & 2033
- Table 38: Italy Tacrolimus Industry Volume (K Unit) Forecast, by Application 2020 & 2033
- Table 39: Spain Tacrolimus Industry Revenue (billion) Forecast, by Application 2020 & 2033
- Table 40: Spain Tacrolimus Industry Volume (K Unit) Forecast, by Application 2020 & 2033
- Table 41: Rest of Europe Tacrolimus Industry Revenue (billion) Forecast, by Application 2020 & 2033
- Table 42: Rest of Europe Tacrolimus Industry Volume (K Unit) Forecast, by Application 2020 & 2033
- Table 43: Global Tacrolimus Industry Revenue billion Forecast, by Product Type 2020 & 2033
- Table 44: Global Tacrolimus Industry Volume K Unit Forecast, by Product Type 2020 & 2033
- Table 45: Global Tacrolimus Industry Revenue billion Forecast, by Application 2020 & 2033
- Table 46: Global Tacrolimus Industry Volume K Unit Forecast, by Application 2020 & 2033
- Table 47: Global Tacrolimus Industry Revenue billion Forecast, by End Users 2020 & 2033
- Table 48: Global Tacrolimus Industry Volume K Unit Forecast, by End Users 2020 & 2033
- Table 49: Global Tacrolimus Industry Revenue billion Forecast, by Country 2020 & 2033
- Table 50: Global Tacrolimus Industry Volume K Unit Forecast, by Country 2020 & 2033
- Table 51: China Tacrolimus Industry Revenue (billion) Forecast, by Application 2020 & 2033
- Table 52: China Tacrolimus Industry Volume (K Unit) Forecast, by Application 2020 & 2033
- Table 53: Japan Tacrolimus Industry Revenue (billion) Forecast, by Application 2020 & 2033
- Table 54: Japan Tacrolimus Industry Volume (K Unit) Forecast, by Application 2020 & 2033
- Table 55: India Tacrolimus Industry Revenue (billion) Forecast, by Application 2020 & 2033
- Table 56: India Tacrolimus Industry Volume (K Unit) Forecast, by Application 2020 & 2033
- Table 57: Australia Tacrolimus Industry Revenue (billion) Forecast, by Application 2020 & 2033
- Table 58: Australia Tacrolimus Industry Volume (K Unit) Forecast, by Application 2020 & 2033
- Table 59: South Korea Tacrolimus Industry Revenue (billion) Forecast, by Application 2020 & 2033
- Table 60: South Korea Tacrolimus Industry Volume (K Unit) Forecast, by Application 2020 & 2033
- Table 61: Rest of Asia Pacific Tacrolimus Industry Revenue (billion) Forecast, by Application 2020 & 2033
- Table 62: Rest of Asia Pacific Tacrolimus Industry Volume (K Unit) Forecast, by Application 2020 & 2033
- Table 63: Global Tacrolimus Industry Revenue billion Forecast, by Product Type 2020 & 2033
- Table 64: Global Tacrolimus Industry Volume K Unit Forecast, by Product Type 2020 & 2033
- Table 65: Global Tacrolimus Industry Revenue billion Forecast, by Application 2020 & 2033
- Table 66: Global Tacrolimus Industry Volume K Unit Forecast, by Application 2020 & 2033
- Table 67: Global Tacrolimus Industry Revenue billion Forecast, by End Users 2020 & 2033
- Table 68: Global Tacrolimus Industry Volume K Unit Forecast, by End Users 2020 & 2033
- Table 69: Global Tacrolimus Industry Revenue billion Forecast, by Country 2020 & 2033
- Table 70: Global Tacrolimus Industry Volume K Unit Forecast, by Country 2020 & 2033
- Table 71: GCC Tacrolimus Industry Revenue (billion) Forecast, by Application 2020 & 2033
- Table 72: GCC Tacrolimus Industry Volume (K Unit) Forecast, by Application 2020 & 2033
- Table 73: South Africa Tacrolimus Industry Revenue (billion) Forecast, by Application 2020 & 2033
- Table 74: South Africa Tacrolimus Industry Volume (K Unit) Forecast, by Application 2020 & 2033
- Table 75: Rest of Middle East and Africa Tacrolimus Industry Revenue (billion) Forecast, by Application 2020 & 2033
- Table 76: Rest of Middle East and Africa Tacrolimus Industry Volume (K Unit) Forecast, by Application 2020 & 2033
- Table 77: Global Tacrolimus Industry Revenue billion Forecast, by Product Type 2020 & 2033
- Table 78: Global Tacrolimus Industry Volume K Unit Forecast, by Product Type 2020 & 2033
- Table 79: Global Tacrolimus Industry Revenue billion Forecast, by Application 2020 & 2033
- Table 80: Global Tacrolimus Industry Volume K Unit Forecast, by Application 2020 & 2033
- Table 81: Global Tacrolimus Industry Revenue billion Forecast, by End Users 2020 & 2033
- Table 82: Global Tacrolimus Industry Volume K Unit Forecast, by End Users 2020 & 2033
- Table 83: Global Tacrolimus Industry Revenue billion Forecast, by Country 2020 & 2033
- Table 84: Global Tacrolimus Industry Volume K Unit Forecast, by Country 2020 & 2033
- Table 85: Brazil Tacrolimus Industry Revenue (billion) Forecast, by Application 2020 & 2033
- Table 86: Brazil Tacrolimus Industry Volume (K Unit) Forecast, by Application 2020 & 2033
- Table 87: Argentina Tacrolimus Industry Revenue (billion) Forecast, by Application 2020 & 2033
- Table 88: Argentina Tacrolimus Industry Volume (K Unit) Forecast, by Application 2020 & 2033
- Table 89: Rest of South America Tacrolimus Industry Revenue (billion) Forecast, by Application 2020 & 2033
- Table 90: Rest of South America Tacrolimus Industry Volume (K Unit) Forecast, by Application 2020 & 2033
Frequently Asked Questions
1. What is the projected Compound Annual Growth Rate (CAGR) of the Tacrolimus Industry?
The projected CAGR is approximately 5.15%.
2. Which companies are prominent players in the Tacrolimus Industry?
Key companies in the market include Lupin Pharmaceuticals Inc, Glenmark Pharmaceuticals Inc, Panacea Biotec, Astellas Pharma Inc, LEO Pharma A/S, GlaxoSmithKline plc, Novartis AG, Biocon Ltd, Dr Reddy's Laboratories Ltd, Pfizer Inc.
3. What are the main segments of the Tacrolimus Industry?
The market segments include Product Type, Application, End Users.
4. Can you provide details about the market size?
The market size is estimated to be USD 7.39 billion as of 2022.
5. What are some drivers contributing to market growth?
Increasing Number of Transplants Worldwide; Surge in Research and Development Activities for Immunosuppression.
6. What are the notable trends driving market growth?
Immunosuppression Segment is Expected to Witness Growth over the Forecast Period.
7. Are there any restraints impacting market growth?
Side Effects of the Tacrolimus.
8. Can you provide examples of recent developments in the market?
N/A
9. What pricing options are available for accessing the report?
Pricing options include single-user, multi-user, and enterprise licenses priced at USD 4750, USD 5250, and USD 8750 respectively.
10. Is the market size provided in terms of value or volume?
The market size is provided in terms of value, measured in billion and volume, measured in K Unit.
11. Are there any specific market keywords associated with the report?
Yes, the market keyword associated with the report is "Tacrolimus Industry," which aids in identifying and referencing the specific market segment covered.
12. How do I determine which pricing option suits my needs best?
The pricing options vary based on user requirements and access needs. Individual users may opt for single-user licenses, while businesses requiring broader access may choose multi-user or enterprise licenses for cost-effective access to the report.
13. Are there any additional resources or data provided in the Tacrolimus Industry report?
While the report offers comprehensive insights, it's advisable to review the specific contents or supplementary materials provided to ascertain if additional resources or data are available.
14. How can I stay updated on further developments or reports in the Tacrolimus Industry?
To stay informed about further developments, trends, and reports in the Tacrolimus Industry, consider subscribing to industry newsletters, following relevant companies and organizations, or regularly checking reputable industry news sources and publications.
Methodology
Step 1 - Identification of Relevant Samples Size from Population Database


Step 2 - Approaches for Defining Global Market Size (Value, Volume* & Price*)

Note*: In applicable scenarios
Step 3 - Data Sources
Primary Research
- Web Analytics
- Survey Reports
- Research Institute
- Latest Research Reports
- Opinion Leaders
Secondary Research
- Annual Reports
- White Paper
- Latest Press Release
- Industry Association
- Paid Database
- Investor Presentations

Step 4 - Data Triangulation
Involves using different sources of information in order to increase the validity of a study
These sources are likely to be stakeholders in a program - participants, other researchers, program staff, other community members, and so on.
Then we put all data in single framework & apply various statistical tools to find out the dynamic on the market.
During the analysis stage, feedback from the stakeholder groups would be compared to determine areas of agreement as well as areas of divergence