

Key Insights
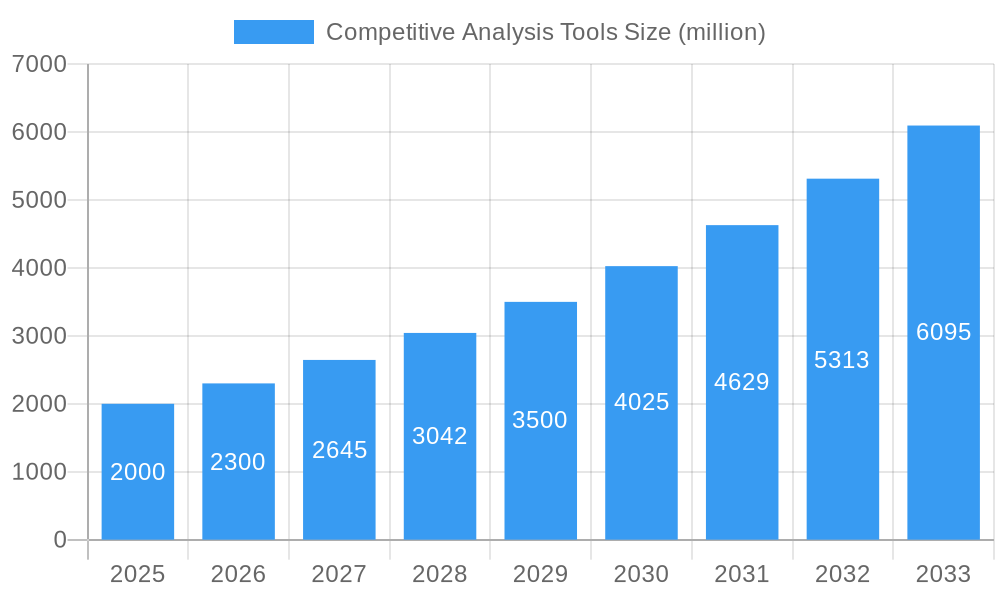
The global competitive analysis tools market is poised for significant expansion, driven by the imperative for businesses to gain strategic insights into their competitive environments and enable data-informed decision-making. The market, valued at $47.32 billion in the base year of 2025, is projected to grow at a Compound Annual Growth Rate (CAGR) of 9.5%, reaching substantial figures by 2033. Key growth drivers include the escalating adoption of digital marketing, necessitating continuous competitor monitoring. Furthermore, enhanced data availability and advanced analytics capabilities within these tools provide deeper insights into competitor strengths, weaknesses, and strategic approaches. The broadening scope of online competition across diverse industries compels businesses to leverage these tools for optimal market positioning and competitive differentiation.
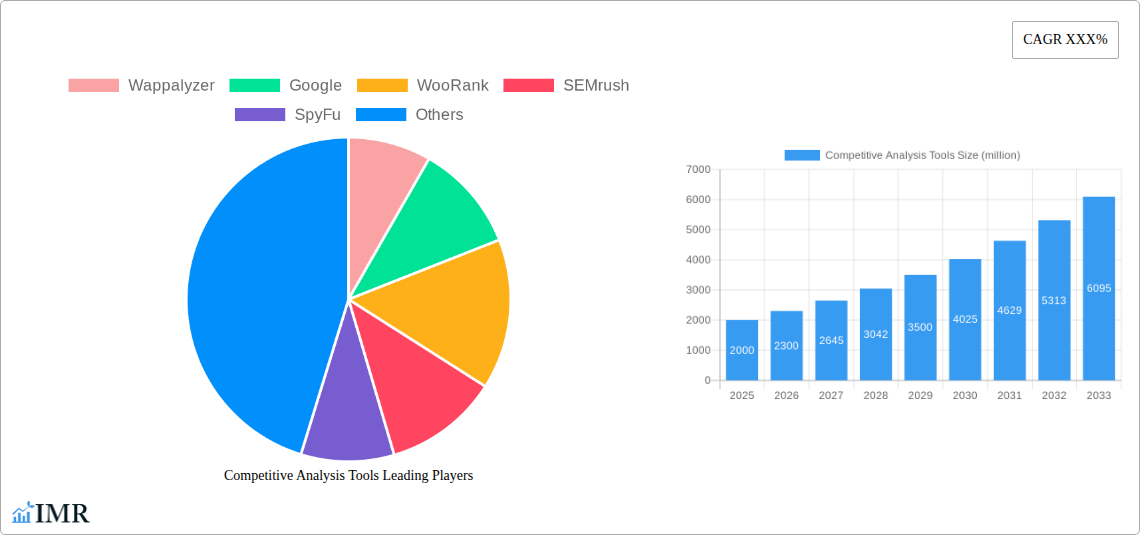
Competitive Analysis Tools Market Size (In Billion)
The market segmentation encompasses tool types (e.g., website analysis, social media analysis, SEO analysis), deployment models (cloud-based, on-premise), and enterprise sizes (small, medium, large). While industry leaders like SEMrush, Ahrefs, and SimilarWeb maintain strong positions, specialized vendors cater to niche requirements, fostering innovation. Challenges include the implementation costs of advanced tools and the requirement for specialized expertise in data interpretation.
Competitive Analysis Tools Company Market Share
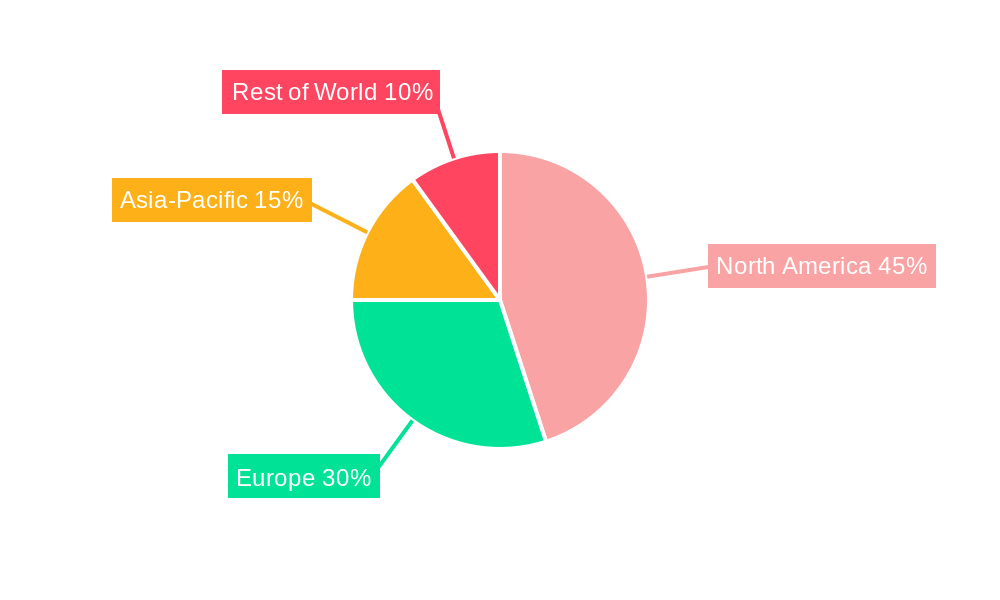
Despite these hurdles, the market's growth trajectory remains robust, propelled by technological advancements and the increasing reliance on data-centric business strategies. The cloud-based segment is expected to outpace on-premise solutions due to its inherent scalability, cost-efficiency, and accessibility. North America and Europe currently command significant market shares, with emerging markets in Asia-Pacific demonstrating considerable growth potential, fueled by increasing digital penetration and the expansion of e-commerce. The competitive landscape is characterized by continuous product innovation, strategic mergers and acquisitions, and the emergence of new market entrants. Businesses are increasingly seeking integrated and comprehensive solutions offering a holistic view of the competitive arena, thereby encouraging vendors to develop cutting-edge tools that utilize AI and machine learning for enhanced analytical accuracy and actionable insights.
Competitive Analysis Tools Market Report: 2019-2033
This comprehensive report provides a detailed analysis of the Competitive Analysis Tools market, encompassing market dynamics, growth trends, regional dominance, product landscape, key players, and future outlook. The study period covers 2019-2033, with 2025 as the base and estimated year. The forecast period spans 2025-2033, and the historical period encompasses 2019-2024. This report is invaluable for industry professionals, investors, and strategic decision-makers seeking actionable insights into this rapidly evolving market. The parent market is the broader market research and analytics industry, while the child market is digital marketing and competitive intelligence tools. The total market size is projected to reach xx million units by 2033.
Competitive Analysis Tools Market Dynamics & Structure
The Competitive Analysis Tools market is characterized by moderate concentration, with several key players holding significant market share. Technological innovation, particularly in AI and machine learning, is a primary driver, enabling more accurate and insightful competitive analysis. Regulatory frameworks, such as data privacy regulations (GDPR, CCPA), significantly impact market operations, prompting increased focus on data security and compliance. Competitive product substitutes include manual competitive analysis methods and less sophisticated tools. The end-user demographic is primarily comprised of marketing professionals, business analysts, and market research firms. M&A activity in the sector has been moderate (approximately xx deals between 2019-2024), primarily driven by the desire to expand capabilities and market reach.
- Market Concentration: Moderately concentrated, with top 5 players holding approximately 65% market share in 2025.
- Technological Innovation: AI-driven insights, automation of data collection, and advanced analytics are key drivers.
- Regulatory Landscape: GDPR, CCPA, and other data privacy regulations are shaping data handling practices.
- M&A Activity: xx deals between 2019-2024, indicating consolidation and expansion strategies.
- End-User Demographics: Primarily marketing, business analytics, and market research professionals.
Competitive Analysis Tools Growth Trends & Insights
The Competitive Analysis Tools market experienced robust growth during the historical period (2019-2024), with a CAGR of xx%. This growth is attributed to increasing demand for data-driven decision-making in business, coupled with the growing adoption of digital marketing strategies. Technological disruptions, such as the rise of AI and big data analytics, have significantly enhanced the capabilities of these tools, leading to increased adoption rates. Consumer behavior shifts towards personalized experiences have further fueled demand for tools that offer deep competitive insights. The market penetration rate was approximately xx% in 2024 and is projected to reach xx% by 2033. Market size is estimated to be xx million units in 2025, with a projected value of xx million units by 2033.
Dominant Regions, Countries, or Segments in Competitive Analysis Tools
North America currently holds the dominant position in the Competitive Analysis Tools market, driven by strong technological infrastructure, high internet penetration, and a mature digital marketing landscape. European markets are also showing significant growth, driven by increasing adoption of digital marketing across various sectors. Within North America, the United States commands the largest market share, while in Europe, the UK and Germany are key markets. Asia-Pacific is also experiencing significant growth, fueled by economic expansion and increasing internet usage.
- Key Drivers (North America): Advanced technological infrastructure, high internet penetration, mature digital marketing sector.
- Key Drivers (Europe): Increasing digital marketing adoption, robust regulatory frameworks.
- Key Drivers (Asia-Pacific): Rapid economic growth, rising internet usage, increasing business competition.
Competitive Analysis Tools Product Landscape
The competitive analysis tools market offers a diverse range of products, from basic website analysis tools to sophisticated platforms offering comprehensive competitive intelligence. Innovations include AI-powered insights, automated reporting, and integration with other marketing platforms. Key performance metrics include accuracy of data, speed of analysis, and ease of use. Unique selling propositions often involve specialized features, such as competitor ranking, keyword analysis, and social media monitoring. Advancements in natural language processing (NLP) and machine learning (ML) are enabling more accurate and nuanced competitive analysis.
Key Drivers, Barriers & Challenges in Competitive Analysis Tools
Key Drivers:
- Growing demand for data-driven decision-making.
- Increased adoption of digital marketing strategies.
- Technological advancements in AI, big data, and NLP.
- Rising competition in the online marketplace.
Key Challenges:
- Data privacy regulations and compliance costs (estimated impact: xx million units reduction in market growth by 2033).
- Maintaining data accuracy and reliability.
- Intense competition and price pressures from new entrants (estimated impact: xx% reduction in average profit margin by 2033).
- Ensuring data security and protecting against cyber threats.
Emerging Opportunities in Competitive Analysis Tools
- Expanding into untapped markets, such as small and medium-sized enterprises (SMEs) in emerging economies.
- Developing niche applications for specific industries (e.g., healthcare, finance).
- Integrating with other marketing automation platforms for seamless workflow.
- Leveraging advanced analytics to provide predictive insights.
Growth Accelerators in the Competitive Analysis Tools Industry
Strategic partnerships between competitive analysis tools providers and other technology companies, such as CRM or marketing automation platforms, are driving market growth. Expansion into new geographical regions and the development of innovative functionalities to cater to evolving consumer needs will continue to fuel market expansion. Technological breakthroughs in AI and machine learning will play a pivotal role in enhancing accuracy, efficiency, and insights generated from these tools.
Key Players Shaping the Competitive Analysis Tools Market
- Wappalyzer
- WooRank
- SEMrush
- SpyFu
- Owletter
- SimilarWeb
- Moz
- Ahrefs
Notable Milestones in Competitive Analysis Tools Sector
- 2020: SEMrush launched its enhanced competitor analysis module.
- 2021: Ahrefs integrated AI-powered keyword research capabilities.
- 2022: SimilarWeb expanded its API access for enhanced data integration.
- 2023: Several smaller companies merged, indicating consolidation.
In-Depth Competitive Analysis Tools Market Outlook
The Competitive Analysis Tools market is poised for continued growth driven by increasing demand for data-driven decision-making and technological innovation. Strategic partnerships, market expansion, and the development of AI-powered insights will be key growth drivers. Opportunities exist in untapped markets and niche applications, while challenges remain in navigating data privacy regulations and ensuring data accuracy. The market's future potential is substantial, offering significant opportunities for both established players and new entrants.
Competitive Analysis Tools Segmentation
-
1. Application
- 1.1. Small and Medium Enterprises (SMEs)
- 1.2. Large Enterprises
-
2. Type
- 2.1. Cloud-based
- 2.2. On-premises
Competitive Analysis Tools Segmentation By Geography
-
1. North America
- 1.1. United States
- 1.2. Canada
- 1.3. Mexico
-
2. South America
- 2.1. Brazil
- 2.2. Argentina
- 2.3. Rest of South America
-
3. Europe
- 3.1. United Kingdom
- 3.2. Germany
- 3.3. France
- 3.4. Italy
- 3.5. Spain
- 3.6. Russia
- 3.7. Benelux
- 3.8. Nordics
- 3.9. Rest of Europe
-
4. Middle East & Africa
- 4.1. Turkey
- 4.2. Israel
- 4.3. GCC
- 4.4. North Africa
- 4.5. South Africa
- 4.6. Rest of Middle East & Africa
-
5. Asia Pacific
- 5.1. China
- 5.2. India
- 5.3. Japan
- 5.4. South Korea
- 5.5. ASEAN
- 5.6. Oceania
- 5.7. Rest of Asia Pacific
Competitive Analysis Tools Regional Market Share
Geographic Coverage of Competitive Analysis Tools
Competitive Analysis Tools REPORT HIGHLIGHTS
| Aspects | Details |
|---|---|
| Study Period | 2020-2034 |
| Base Year | 2025 |
| Estimated Year | 2026 |
| Forecast Period | 2026-2034 |
| Historical Period | 2020-2025 |
| Growth Rate | CAGR of 9.5% from 2020-2034 |
| Segmentation |
|
Table of Contents
- 1. Introduction
- 1.1. Research Scope
- 1.2. Market Segmentation
- 1.3. Research Objective
- 1.4. Definitions and Assumptions
- 2. Executive Summary
- 2.1. Market Snapshot
- 3. Market Dynamics
- 3.1. Market Drivers
- 3.2. Market Restrains
- 3.3. Market Trends
- 3.4. Market Opportunities
- 4. Market Factor Analysis
- 4.1. Porters Five Forces
- 4.1.1. Bargaining Power of Suppliers
- 4.1.2. Bargaining Power of Buyers
- 4.1.3. Threat of New Entrants
- 4.1.4. Threat of Substitutes
- 4.1.5. Competitive Rivalry
- 4.2. PESTEL analysis
- 4.3. BCG Analysis
- 4.3.1. Stars (High Growth, High Market Share)
- 4.3.2. Cash Cows (Low Growth, High Market Share)
- 4.3.3. Question Mark (High Growth, Low Market Share)
- 4.3.4. Dogs (Low Growth, Low Market Share)
- 4.4. Ansoff Matrix Analysis
- 4.5. Supply Chain Analysis
- 4.6. Regulatory Landscape
- 4.7. Current Market Potential and Opportunity Assessment (TAM–SAM–SOM Framework)
- 4.8. IMR Analyst Note
- 4.1. Porters Five Forces
- 5. Market Analysis, Insights and Forecast 2021-2033
- 5.1. Market Analysis, Insights and Forecast - by Application
- 5.1.1. Small and Medium Enterprises (SMEs)
- 5.1.2. Large Enterprises
- 5.2. Market Analysis, Insights and Forecast - by Type
- 5.2.1. Cloud-based
- 5.2.2. On-premises
- 5.3. Market Analysis, Insights and Forecast - by Region
- 5.3.1. North America
- 5.3.2. South America
- 5.3.3. Europe
- 5.3.4. Middle East & Africa
- 5.3.5. Asia Pacific
- 5.1. Market Analysis, Insights and Forecast - by Application
- 6. Global Competitive Analysis Tools Analysis, Insights and Forecast, 2021-2033
- 6.1. Market Analysis, Insights and Forecast - by Application
- 6.1.1. Small and Medium Enterprises (SMEs)
- 6.1.2. Large Enterprises
- 6.2. Market Analysis, Insights and Forecast - by Type
- 6.2.1. Cloud-based
- 6.2.2. On-premises
- 6.1. Market Analysis, Insights and Forecast - by Application
- 7. North America Competitive Analysis Tools Analysis, Insights and Forecast, 2020-2032
- 7.1. Market Analysis, Insights and Forecast - by Application
- 7.1.1. Small and Medium Enterprises (SMEs)
- 7.1.2. Large Enterprises
- 7.2. Market Analysis, Insights and Forecast - by Type
- 7.2.1. Cloud-based
- 7.2.2. On-premises
- 7.1. Market Analysis, Insights and Forecast - by Application
- 8. South America Competitive Analysis Tools Analysis, Insights and Forecast, 2020-2032
- 8.1. Market Analysis, Insights and Forecast - by Application
- 8.1.1. Small and Medium Enterprises (SMEs)
- 8.1.2. Large Enterprises
- 8.2. Market Analysis, Insights and Forecast - by Type
- 8.2.1. Cloud-based
- 8.2.2. On-premises
- 8.1. Market Analysis, Insights and Forecast - by Application
- 9. Europe Competitive Analysis Tools Analysis, Insights and Forecast, 2020-2032
- 9.1. Market Analysis, Insights and Forecast - by Application
- 9.1.1. Small and Medium Enterprises (SMEs)
- 9.1.2. Large Enterprises
- 9.2. Market Analysis, Insights and Forecast - by Type
- 9.2.1. Cloud-based
- 9.2.2. On-premises
- 9.1. Market Analysis, Insights and Forecast - by Application
- 10. Middle East & Africa Competitive Analysis Tools Analysis, Insights and Forecast, 2020-2032
- 10.1. Market Analysis, Insights and Forecast - by Application
- 10.1.1. Small and Medium Enterprises (SMEs)
- 10.1.2. Large Enterprises
- 10.2. Market Analysis, Insights and Forecast - by Type
- 10.2.1. Cloud-based
- 10.2.2. On-premises
- 10.1. Market Analysis, Insights and Forecast - by Application
- 11. Asia Pacific Competitive Analysis Tools Analysis, Insights and Forecast, 2020-2032
- 11.1. Market Analysis, Insights and Forecast - by Application
- 11.1.1. Small and Medium Enterprises (SMEs)
- 11.1.2. Large Enterprises
- 11.2. Market Analysis, Insights and Forecast - by Type
- 11.2.1. Cloud-based
- 11.2.2. On-premises
- 11.1. Market Analysis, Insights and Forecast - by Application
- 12. Competitive Analysis
- 12.1. Company Profiles
- 12.1.1 Wappalyzer
- 12.1.1.1. Company Overview
- 12.1.1.2. Products
- 12.1.1.3. Company Financials
- 12.1.1.4. SWOT Analysis
- 12.1.2 Google
- 12.1.2.1. Company Overview
- 12.1.2.2. Products
- 12.1.2.3. Company Financials
- 12.1.2.4. SWOT Analysis
- 12.1.3 WooRank
- 12.1.3.1. Company Overview
- 12.1.3.2. Products
- 12.1.3.3. Company Financials
- 12.1.3.4. SWOT Analysis
- 12.1.4 SEMrush
- 12.1.4.1. Company Overview
- 12.1.4.2. Products
- 12.1.4.3. Company Financials
- 12.1.4.4. SWOT Analysis
- 12.1.5 SpyFu
- 12.1.5.1. Company Overview
- 12.1.5.2. Products
- 12.1.5.3. Company Financials
- 12.1.5.4. SWOT Analysis
- 12.1.6 Owletter
- 12.1.6.1. Company Overview
- 12.1.6.2. Products
- 12.1.6.3. Company Financials
- 12.1.6.4. SWOT Analysis
- 12.1.7 SimilarWeb
- 12.1.7.1. Company Overview
- 12.1.7.2. Products
- 12.1.7.3. Company Financials
- 12.1.7.4. SWOT Analysis
- 12.1.8 Moz
- 12.1.8.1. Company Overview
- 12.1.8.2. Products
- 12.1.8.3. Company Financials
- 12.1.8.4. SWOT Analysis
- 12.1.9 Ahrefs
- 12.1.9.1. Company Overview
- 12.1.9.2. Products
- 12.1.9.3. Company Financials
- 12.1.9.4. SWOT Analysis
- 12.1.1 Wappalyzer
- 12.2. Market Entropy
- 12.2.1 Company's Key Areas Served
- 12.2.2 Recent Developments
- 12.3. Company Market Share Analysis 2025
- 12.3.1 Top 5 Companies Market Share Analysis
- 12.3.2 Top 3 Companies Market Share Analysis
- 12.4. List of Potential Customers
- 13. Research Methodology
List of Figures
- Figure 1: Global Competitive Analysis Tools Revenue Breakdown (billion, %) by Region 2025 & 2033
- Figure 2: North America Competitive Analysis Tools Revenue (billion), by Application 2025 & 2033
- Figure 3: North America Competitive Analysis Tools Revenue Share (%), by Application 2025 & 2033
- Figure 4: North America Competitive Analysis Tools Revenue (billion), by Type 2025 & 2033
- Figure 5: North America Competitive Analysis Tools Revenue Share (%), by Type 2025 & 2033
- Figure 6: North America Competitive Analysis Tools Revenue (billion), by Country 2025 & 2033
- Figure 7: North America Competitive Analysis Tools Revenue Share (%), by Country 2025 & 2033
- Figure 8: South America Competitive Analysis Tools Revenue (billion), by Application 2025 & 2033
- Figure 9: South America Competitive Analysis Tools Revenue Share (%), by Application 2025 & 2033
- Figure 10: South America Competitive Analysis Tools Revenue (billion), by Type 2025 & 2033
- Figure 11: South America Competitive Analysis Tools Revenue Share (%), by Type 2025 & 2033
- Figure 12: South America Competitive Analysis Tools Revenue (billion), by Country 2025 & 2033
- Figure 13: South America Competitive Analysis Tools Revenue Share (%), by Country 2025 & 2033
- Figure 14: Europe Competitive Analysis Tools Revenue (billion), by Application 2025 & 2033
- Figure 15: Europe Competitive Analysis Tools Revenue Share (%), by Application 2025 & 2033
- Figure 16: Europe Competitive Analysis Tools Revenue (billion), by Type 2025 & 2033
- Figure 17: Europe Competitive Analysis Tools Revenue Share (%), by Type 2025 & 2033
- Figure 18: Europe Competitive Analysis Tools Revenue (billion), by Country 2025 & 2033
- Figure 19: Europe Competitive Analysis Tools Revenue Share (%), by Country 2025 & 2033
- Figure 20: Middle East & Africa Competitive Analysis Tools Revenue (billion), by Application 2025 & 2033
- Figure 21: Middle East & Africa Competitive Analysis Tools Revenue Share (%), by Application 2025 & 2033
- Figure 22: Middle East & Africa Competitive Analysis Tools Revenue (billion), by Type 2025 & 2033
- Figure 23: Middle East & Africa Competitive Analysis Tools Revenue Share (%), by Type 2025 & 2033
- Figure 24: Middle East & Africa Competitive Analysis Tools Revenue (billion), by Country 2025 & 2033
- Figure 25: Middle East & Africa Competitive Analysis Tools Revenue Share (%), by Country 2025 & 2033
- Figure 26: Asia Pacific Competitive Analysis Tools Revenue (billion), by Application 2025 & 2033
- Figure 27: Asia Pacific Competitive Analysis Tools Revenue Share (%), by Application 2025 & 2033
- Figure 28: Asia Pacific Competitive Analysis Tools Revenue (billion), by Type 2025 & 2033
- Figure 29: Asia Pacific Competitive Analysis Tools Revenue Share (%), by Type 2025 & 2033
- Figure 30: Asia Pacific Competitive Analysis Tools Revenue (billion), by Country 2025 & 2033
- Figure 31: Asia Pacific Competitive Analysis Tools Revenue Share (%), by Country 2025 & 2033
List of Tables
- Table 1: Global Competitive Analysis Tools Revenue billion Forecast, by Application 2020 & 2033
- Table 2: Global Competitive Analysis Tools Revenue billion Forecast, by Type 2020 & 2033
- Table 3: Global Competitive Analysis Tools Revenue billion Forecast, by Region 2020 & 2033
- Table 4: Global Competitive Analysis Tools Revenue billion Forecast, by Application 2020 & 2033
- Table 5: Global Competitive Analysis Tools Revenue billion Forecast, by Type 2020 & 2033
- Table 6: Global Competitive Analysis Tools Revenue billion Forecast, by Country 2020 & 2033
- Table 7: United States Competitive Analysis Tools Revenue (billion) Forecast, by Application 2020 & 2033
- Table 8: Canada Competitive Analysis Tools Revenue (billion) Forecast, by Application 2020 & 2033
- Table 9: Mexico Competitive Analysis Tools Revenue (billion) Forecast, by Application 2020 & 2033
- Table 10: Global Competitive Analysis Tools Revenue billion Forecast, by Application 2020 & 2033
- Table 11: Global Competitive Analysis Tools Revenue billion Forecast, by Type 2020 & 2033
- Table 12: Global Competitive Analysis Tools Revenue billion Forecast, by Country 2020 & 2033
- Table 13: Brazil Competitive Analysis Tools Revenue (billion) Forecast, by Application 2020 & 2033
- Table 14: Argentina Competitive Analysis Tools Revenue (billion) Forecast, by Application 2020 & 2033
- Table 15: Rest of South America Competitive Analysis Tools Revenue (billion) Forecast, by Application 2020 & 2033
- Table 16: Global Competitive Analysis Tools Revenue billion Forecast, by Application 2020 & 2033
- Table 17: Global Competitive Analysis Tools Revenue billion Forecast, by Type 2020 & 2033
- Table 18: Global Competitive Analysis Tools Revenue billion Forecast, by Country 2020 & 2033
- Table 19: United Kingdom Competitive Analysis Tools Revenue (billion) Forecast, by Application 2020 & 2033
- Table 20: Germany Competitive Analysis Tools Revenue (billion) Forecast, by Application 2020 & 2033
- Table 21: France Competitive Analysis Tools Revenue (billion) Forecast, by Application 2020 & 2033
- Table 22: Italy Competitive Analysis Tools Revenue (billion) Forecast, by Application 2020 & 2033
- Table 23: Spain Competitive Analysis Tools Revenue (billion) Forecast, by Application 2020 & 2033
- Table 24: Russia Competitive Analysis Tools Revenue (billion) Forecast, by Application 2020 & 2033
- Table 25: Benelux Competitive Analysis Tools Revenue (billion) Forecast, by Application 2020 & 2033
- Table 26: Nordics Competitive Analysis Tools Revenue (billion) Forecast, by Application 2020 & 2033
- Table 27: Rest of Europe Competitive Analysis Tools Revenue (billion) Forecast, by Application 2020 & 2033
- Table 28: Global Competitive Analysis Tools Revenue billion Forecast, by Application 2020 & 2033
- Table 29: Global Competitive Analysis Tools Revenue billion Forecast, by Type 2020 & 2033
- Table 30: Global Competitive Analysis Tools Revenue billion Forecast, by Country 2020 & 2033
- Table 31: Turkey Competitive Analysis Tools Revenue (billion) Forecast, by Application 2020 & 2033
- Table 32: Israel Competitive Analysis Tools Revenue (billion) Forecast, by Application 2020 & 2033
- Table 33: GCC Competitive Analysis Tools Revenue (billion) Forecast, by Application 2020 & 2033
- Table 34: North Africa Competitive Analysis Tools Revenue (billion) Forecast, by Application 2020 & 2033
- Table 35: South Africa Competitive Analysis Tools Revenue (billion) Forecast, by Application 2020 & 2033
- Table 36: Rest of Middle East & Africa Competitive Analysis Tools Revenue (billion) Forecast, by Application 2020 & 2033
- Table 37: Global Competitive Analysis Tools Revenue billion Forecast, by Application 2020 & 2033
- Table 38: Global Competitive Analysis Tools Revenue billion Forecast, by Type 2020 & 2033
- Table 39: Global Competitive Analysis Tools Revenue billion Forecast, by Country 2020 & 2033
- Table 40: China Competitive Analysis Tools Revenue (billion) Forecast, by Application 2020 & 2033
- Table 41: India Competitive Analysis Tools Revenue (billion) Forecast, by Application 2020 & 2033
- Table 42: Japan Competitive Analysis Tools Revenue (billion) Forecast, by Application 2020 & 2033
- Table 43: South Korea Competitive Analysis Tools Revenue (billion) Forecast, by Application 2020 & 2033
- Table 44: ASEAN Competitive Analysis Tools Revenue (billion) Forecast, by Application 2020 & 2033
- Table 45: Oceania Competitive Analysis Tools Revenue (billion) Forecast, by Application 2020 & 2033
- Table 46: Rest of Asia Pacific Competitive Analysis Tools Revenue (billion) Forecast, by Application 2020 & 2033
Frequently Asked Questions
1. What is the projected Compound Annual Growth Rate (CAGR) of the Competitive Analysis Tools?
The projected CAGR is approximately 9.5%.
2. Which companies are prominent players in the Competitive Analysis Tools?
Key companies in the market include Wappalyzer, Google, WooRank, SEMrush, SpyFu, Owletter, SimilarWeb, Moz, Ahrefs.
3. What are the main segments of the Competitive Analysis Tools?
The market segments include Application, Type.
4. Can you provide details about the market size?
The market size is estimated to be USD 47.32 billion as of 2022.
5. What are some drivers contributing to market growth?
N/A
6. What are the notable trends driving market growth?
N/A
7. Are there any restraints impacting market growth?
N/A
8. Can you provide examples of recent developments in the market?
N/A
9. What pricing options are available for accessing the report?
Pricing options include single-user, multi-user, and enterprise licenses priced at USD 4250.00, USD 6375.00, and USD 8500.00 respectively.
10. Is the market size provided in terms of value or volume?
The market size is provided in terms of value, measured in billion.
11. Are there any specific market keywords associated with the report?
Yes, the market keyword associated with the report is "Competitive Analysis Tools," which aids in identifying and referencing the specific market segment covered.
12. How do I determine which pricing option suits my needs best?
The pricing options vary based on user requirements and access needs. Individual users may opt for single-user licenses, while businesses requiring broader access may choose multi-user or enterprise licenses for cost-effective access to the report.
13. Are there any additional resources or data provided in the Competitive Analysis Tools report?
While the report offers comprehensive insights, it's advisable to review the specific contents or supplementary materials provided to ascertain if additional resources or data are available.
14. How can I stay updated on further developments or reports in the Competitive Analysis Tools?
To stay informed about further developments, trends, and reports in the Competitive Analysis Tools, consider subscribing to industry newsletters, following relevant companies and organizations, or regularly checking reputable industry news sources and publications.
Methodology
Step 1 - Identification of Relevant Samples Size from Population Database


Step 2 - Approaches for Defining Global Market Size (Value, Volume* & Price*)

Note*: In applicable scenarios
Step 3 - Data Sources
Primary Research
- Web Analytics
- Survey Reports
- Research Institute
- Latest Research Reports
- Opinion Leaders
Secondary Research
- Annual Reports
- White Paper
- Latest Press Release
- Industry Association
- Paid Database
- Investor Presentations

Step 4 - Data Triangulation
Involves using different sources of information in order to increase the validity of a study
These sources are likely to be stakeholders in a program - participants, other researchers, program staff, other community members, and so on.
Then we put all data in single framework & apply various statistical tools to find out the dynamic on the market.
During the analysis stage, feedback from the stakeholder groups would be compared to determine areas of agreement as well as areas of divergence