

Key Insights
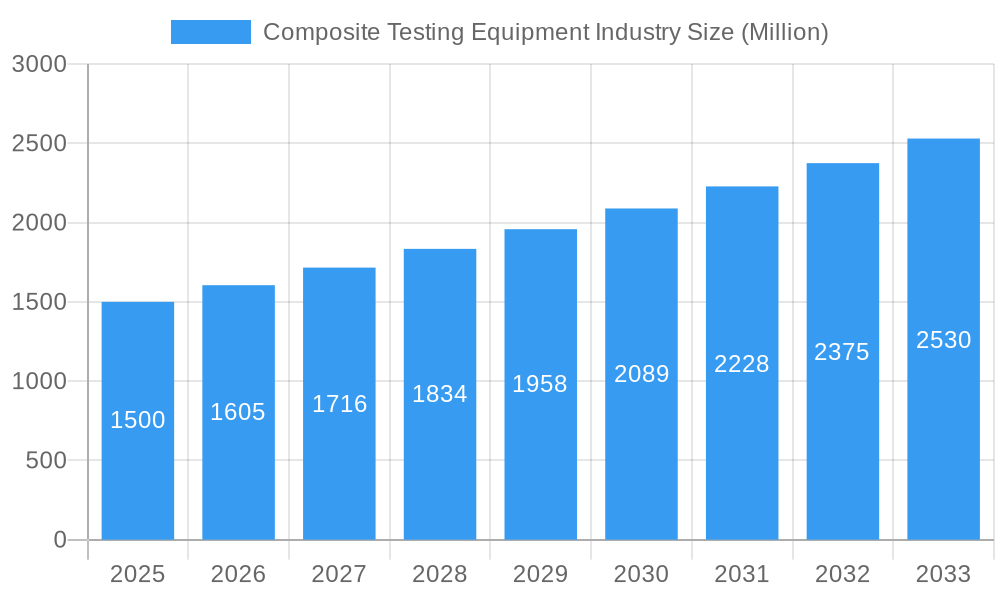
The global composite testing equipment market, valued at approximately $2.58 billion in 2025, is projected to grow at a robust compound annual growth rate (CAGR) of 7.16% from 2025 to 2033. This expansion is primarily driven by the aerospace and defense sectors' increasing reliance on advanced composite materials for lightweight, high-strength applications. The automotive industry's growing adoption of electric vehicles (EVs), where composites are crucial for weight reduction and enhanced efficiency, also significantly contributes to market growth. Furthermore, advancements in construction techniques utilizing composites for improved durability and longevity, coupled with the demand for high-performance electronics requiring lightweight, robust components, are key market expansion drivers. The market is segmented by product type (Ceramic Matrix Composites, Continuous Fiber Composites, Discontinuous Fiber Composites, Polymer Matrix Composites, Other Composites), testing method (Destructive, Non-destructive), and application (Aerospace & Defense, Automotive, Building & Construction, Electricals & Electronics, Others). Key industry players, including Henkel AG & Co KGaA, Intertek Group PLC, and Element Materials Technology, are actively investing in research and development to enhance testing methodologies and expand their product portfolios, thereby shaping market dynamics.
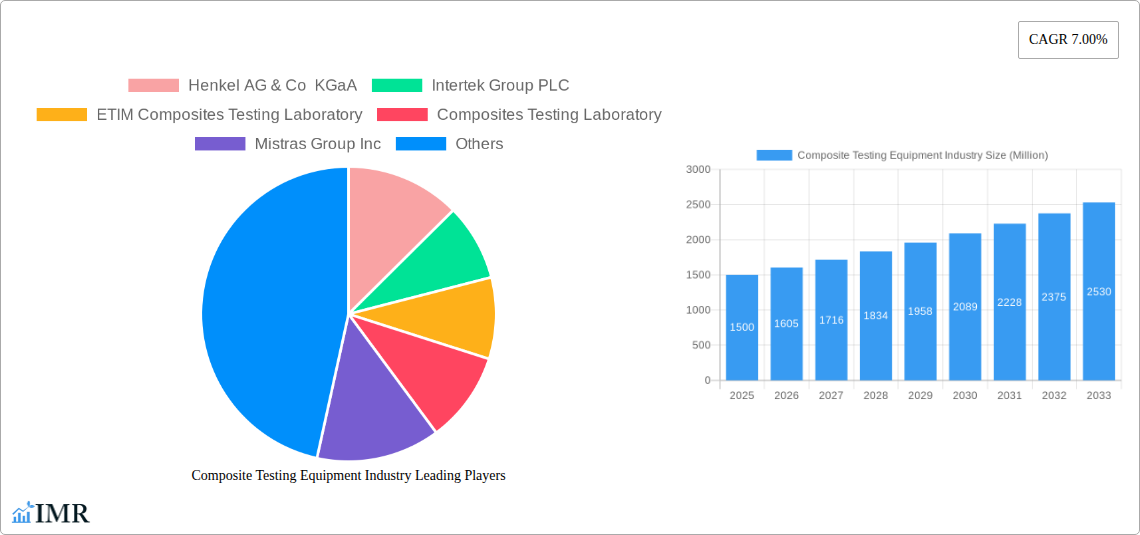
Composite Testing Equipment Industry Market Size (In Billion)
Market restraints include high initial investment costs for advanced composite testing equipment and the requirement for skilled personnel. However, the long-term benefits of ensuring composite material quality and reliability outweigh these initial hurdles. The market is witnessing a trend towards non-destructive testing methods due to their cost-effectiveness and ability to maintain component integrity. Moreover, the integration of automation and data analytics in testing processes is streamlining workflows and improving accuracy. The Asia-Pacific region is anticipated to exhibit significant growth potential due to rapid industrialization and increased infrastructure investment, while North America and Europe will remain substantial markets, supported by their established aerospace and automotive industries. The forecast period of 2025-2033 presents considerable opportunities for composite testing equipment manufacturers to capitalize on these trends and expand their market share.
Composite Testing Equipment Industry Company Market Share
Composite Testing Equipment Industry Market Report: 2019-2033
This comprehensive report provides an in-depth analysis of the Composite Testing Equipment market, encompassing market dynamics, growth trends, regional dominance, product landscape, and key players. The study period covers 2019-2033, with 2025 as the base and estimated year. The forecast period extends from 2025-2033, and the historical period analyzed is 2019-2024. The market is segmented by product type (Ceramic Matrix Composites, Continuous Fiber Composites, Discontinuous Fiber Composites, Polymer Matrix Composites, Other Composites), testing method (Destructive, Non-destructive), and application (Aerospace and Defense, Automotive, Building & Construction, Electricals & Electronics, Others). The total market size is projected to reach xx Million by 2033.
Composite Testing Equipment Industry Market Dynamics & Structure
The Composite Testing Equipment market is characterized by moderate concentration, with a few major players holding significant market share. Technological innovation, particularly in non-destructive testing methods and advanced material characterization, is a key driver. Stringent regulatory frameworks regarding composite material safety and performance in various applications influence market growth. The market witnesses competitive pressure from substitute testing methods and the emergence of new technologies. End-user demographics, particularly in the automotive and aerospace sectors, significantly impact demand. Mergers and acquisitions (M&A) activity is relatively moderate, with strategic partnerships and technology acquisitions being common strategies.
- Market Concentration: Moderately concentrated, with top 5 players holding approximately xx% market share in 2025.
- Technological Innovation: Focus on automation, AI-powered analysis, and miniaturization of testing equipment.
- Regulatory Frameworks: Compliance with industry standards (e.g., ASTM, ISO) drives adoption of advanced testing equipment.
- Competitive Substitutes: Traditional testing methods and emerging technologies create competitive pressures.
- M&A Activity: xx M&A deals recorded between 2019-2024, primarily focused on technology acquisition and market expansion.
Composite Testing Equipment Industry Growth Trends & Insights
The Composite Testing Equipment market experienced significant growth during the historical period (2019-2024), driven by increasing demand from key end-use sectors like aerospace and automotive. The adoption rate of advanced testing methods, particularly non-destructive techniques, is steadily rising. Technological disruptions, such as the integration of AI and machine learning in data analysis, are transforming the industry. Consumer behavior shifts toward lighter, stronger, and more sustainable materials are boosting demand for composite materials, indirectly fueling the testing equipment market. The market is expected to register a CAGR of xx% during the forecast period (2025-2033). Market penetration in emerging economies is expected to increase significantly.
- Market Size Evolution: Market size grew from xx Million in 2019 to xx Million in 2024, demonstrating strong growth potential.
- Adoption Rates: Adoption of non-destructive testing methods is growing at a CAGR of xx%.
- Technological Disruptions: AI integration in data analysis is improving efficiency and accuracy.
- Consumer Behavior Shifts: Demand for high-performance composite materials in various sectors drives market expansion.
Dominant Regions, Countries, or Segments in Composite Testing Equipment Industry
North America currently dominates the Composite Testing Equipment market, driven by strong demand from the aerospace and defense sector and the presence of established players. Within product types, Polymer Matrix Composites hold the largest market share due to their widespread application across various industries. The non-destructive testing method segment is growing rapidly due to its cost-effectiveness and non-invasive nature. The automotive industry is a significant driver of growth in the Asia-Pacific region, while Europe shows considerable growth potential in the building & construction sector.
- Leading Region: North America, with a market share of xx% in 2025.
- Key Drivers (North America): Strong aerospace & defense sector, presence of major equipment manufacturers.
- Key Drivers (Asia-Pacific): Rapid growth of the automotive industry, increasing infrastructure development.
- Key Drivers (Europe): Growth in the building & construction sector, focus on sustainable materials.
- Largest Segment (Product Type): Polymer Matrix Composites, with a market share of xx% in 2025.
- Fastest Growing Segment (Testing Method): Non-destructive testing, driven by cost-effectiveness and efficiency.
Composite Testing Equipment Industry Product Landscape
The composite testing equipment market offers a wide range of products, including tensile testers, compression testers, impact testers, fatigue testers, and specialized equipment for non-destructive testing (NDT), such as ultrasonic testing (UT), radiographic testing (RT), and eddy current testing (ECT). These products are designed to meet the diverse testing needs of various industries. Recent innovations focus on improved accuracy, faster testing times, automation, and data analysis capabilities. Unique selling propositions often include enhanced precision, user-friendly interfaces, and robust data management systems.
Key Drivers, Barriers & Challenges in Composite Testing Equipment Industry
Key Drivers: Increasing demand for high-performance composites in various sectors (aerospace, automotive, renewable energy), stringent quality control requirements, advancements in testing technologies (e.g., AI-driven analysis), and supportive government regulations.
Key Challenges: High initial investment costs for advanced equipment, the need for skilled personnel to operate and interpret test results, intense competition among manufacturers, and supply chain disruptions impacting the availability of raw materials and components. The market experienced a xx% decline in sales in 2020 due to supply chain disruptions.
Emerging Opportunities in Composite Testing Equipment Industry
Emerging opportunities include the adoption of digital twin technologies for virtual testing, expansion into emerging markets with growing composite material usage, development of specialized equipment for advanced composite materials (e.g., carbon nanotubes), and increased demand for non-destructive testing techniques to ensure structural integrity. The growing interest in sustainable composites also presents a significant opportunity for equipment manufacturers.
Growth Accelerators in the Composite Testing Equipment Industry
Technological breakthroughs, such as the development of advanced sensors and data analytics tools, are accelerating market growth. Strategic partnerships between equipment manufacturers and material suppliers enable the development of specialized testing solutions. Expansion into new geographical markets, particularly in emerging economies, and the focus on providing customized testing services further contribute to market expansion.
Key Players Shaping the Composite Testing Equipment Industry Market
- Henkel AG & Co KGaA
- Intertek Group PLC
- ETIM Composites Testing Laboratory
- Composites Testing Laboratory
- Mistras Group Inc
- Westmoreland Mechanical Testing & Research Inc
- Element Materials Technology
- Matrix Composites Inc (ITT Inc)
- Instron Corporation (Illinois Tool Works Inc)
Notable Milestones in Composite Testing Equipment Industry Sector
- 2021: Introduction of AI-powered data analysis software by Instron Corporation.
- 2022: Acquisition of a smaller testing equipment company by Intertek Group PLC.
- 2023: Launch of a new line of non-destructive testing equipment by Henkel AG & Co KGaA.
In-Depth Composite Testing Equipment Industry Market Outlook
The Composite Testing Equipment market is poised for continued strong growth, driven by technological advancements and expanding applications across diverse industries. Strategic partnerships, expansion into new geographical markets, and a focus on sustainable testing practices will be key to success. The market is expected to witness significant consolidation in the coming years, with major players acquiring smaller companies to expand their product portfolio and market reach. The long-term potential is substantial, especially with the increasing adoption of composite materials in various sectors.
Composite Testing Equipment Industry Segmentation
-
1. Product Type
- 1.1. Ceramic Matrix Composites
- 1.2. Continuous Fiber Composites
- 1.3. Discontinuous Fiber Composites
- 1.4. Polymer Matrix Composites
- 1.5. Other Composites
-
2. Testing Method
- 2.1. Destructive
- 2.2. Non-destructive
-
3. Application
- 3.1. Aerospace and Defense
- 3.2. Automotive
- 3.3. Building & Construction
- 3.4. Electricals & Electronics
- 3.5. Others (Sporting Goods, Wind Energy, etc. )
Composite Testing Equipment Industry Segmentation By Geography
- 1. North America
- 2. Europe
- 3. Asia Pacific
- 4. Latin America
- 5. Middle East

Composite Testing Equipment Industry Regional Market Share
Geographic Coverage of Composite Testing Equipment Industry
Composite Testing Equipment Industry REPORT HIGHLIGHTS
| Aspects | Details |
|---|---|
| Study Period | 2020-2034 |
| Base Year | 2025 |
| Estimated Year | 2026 |
| Forecast Period | 2026-2034 |
| Historical Period | 2020-2025 |
| Growth Rate | CAGR of 7.16% from 2020-2034 |
| Segmentation |
|
Table of Contents
- 1. Introduction
- 1.1. Research Scope
- 1.2. Market Segmentation
- 1.3. Research Objective
- 1.4. Definitions and Assumptions
- 2. Executive Summary
- 2.1. Market Snapshot
- 3. Market Dynamics
- 3.1. Market Drivers
- 3.2. Market Restrains
- 3.3. Market Trends
- 3.4. Market Opportunities
- 4. Market Factor Analysis
- 4.1. Porters Five Forces
- 4.1.1. Bargaining Power of Suppliers
- 4.1.2. Bargaining Power of Buyers
- 4.1.3. Threat of New Entrants
- 4.1.4. Threat of Substitutes
- 4.1.5. Competitive Rivalry
- 4.2. PESTEL analysis
- 4.3. BCG Analysis
- 4.3.1. Stars (High Growth, High Market Share)
- 4.3.2. Cash Cows (Low Growth, High Market Share)
- 4.3.3. Question Mark (High Growth, Low Market Share)
- 4.3.4. Dogs (Low Growth, Low Market Share)
- 4.4. Ansoff Matrix Analysis
- 4.5. Supply Chain Analysis
- 4.6. Regulatory Landscape
- 4.7. Current Market Potential and Opportunity Assessment (TAM–SAM–SOM Framework)
- 4.8. IMR Analyst Note
- 4.1. Porters Five Forces
- 5. Market Analysis, Insights and Forecast 2021-2033
- 5.1. Market Analysis, Insights and Forecast - by Product Type
- 5.1.1. Ceramic Matrix Composites
- 5.1.2. Continuous Fiber Composites
- 5.1.3. Discontinuous Fiber Composites
- 5.1.4. Polymer Matrix Composites
- 5.1.5. Other Composites
- 5.2. Market Analysis, Insights and Forecast - by Testing Method
- 5.2.1. Destructive
- 5.2.2. Non-destructive
- 5.3. Market Analysis, Insights and Forecast - by Application
- 5.3.1. Aerospace and Defense
- 5.3.2. Automotive
- 5.3.3. Building & Construction
- 5.3.4. Electricals & Electronics
- 5.3.5. Others (Sporting Goods, Wind Energy, etc. )
- 5.4. Market Analysis, Insights and Forecast - by Region
- 5.4.1. North America
- 5.4.2. Europe
- 5.4.3. Asia Pacific
- 5.4.4. Latin America
- 5.4.5. Middle East
- 5.1. Market Analysis, Insights and Forecast - by Product Type
- 6. Global Composite Testing Equipment Industry Analysis, Insights and Forecast, 2021-2033
- 6.1. Market Analysis, Insights and Forecast - by Product Type
- 6.1.1. Ceramic Matrix Composites
- 6.1.2. Continuous Fiber Composites
- 6.1.3. Discontinuous Fiber Composites
- 6.1.4. Polymer Matrix Composites
- 6.1.5. Other Composites
- 6.2. Market Analysis, Insights and Forecast - by Testing Method
- 6.2.1. Destructive
- 6.2.2. Non-destructive
- 6.3. Market Analysis, Insights and Forecast - by Application
- 6.3.1. Aerospace and Defense
- 6.3.2. Automotive
- 6.3.3. Building & Construction
- 6.3.4. Electricals & Electronics
- 6.3.5. Others (Sporting Goods, Wind Energy, etc. )
- 6.1. Market Analysis, Insights and Forecast - by Product Type
- 7. North America Composite Testing Equipment Industry Analysis, Insights and Forecast, 2020-2032
- 7.1. Market Analysis, Insights and Forecast - by Product Type
- 7.1.1. Ceramic Matrix Composites
- 7.1.2. Continuous Fiber Composites
- 7.1.3. Discontinuous Fiber Composites
- 7.1.4. Polymer Matrix Composites
- 7.1.5. Other Composites
- 7.2. Market Analysis, Insights and Forecast - by Testing Method
- 7.2.1. Destructive
- 7.2.2. Non-destructive
- 7.3. Market Analysis, Insights and Forecast - by Application
- 7.3.1. Aerospace and Defense
- 7.3.2. Automotive
- 7.3.3. Building & Construction
- 7.3.4. Electricals & Electronics
- 7.3.5. Others (Sporting Goods, Wind Energy, etc. )
- 7.1. Market Analysis, Insights and Forecast - by Product Type
- 8. Europe Composite Testing Equipment Industry Analysis, Insights and Forecast, 2020-2032
- 8.1. Market Analysis, Insights and Forecast - by Product Type
- 8.1.1. Ceramic Matrix Composites
- 8.1.2. Continuous Fiber Composites
- 8.1.3. Discontinuous Fiber Composites
- 8.1.4. Polymer Matrix Composites
- 8.1.5. Other Composites
- 8.2. Market Analysis, Insights and Forecast - by Testing Method
- 8.2.1. Destructive
- 8.2.2. Non-destructive
- 8.3. Market Analysis, Insights and Forecast - by Application
- 8.3.1. Aerospace and Defense
- 8.3.2. Automotive
- 8.3.3. Building & Construction
- 8.3.4. Electricals & Electronics
- 8.3.5. Others (Sporting Goods, Wind Energy, etc. )
- 8.1. Market Analysis, Insights and Forecast - by Product Type
- 9. Asia Pacific Composite Testing Equipment Industry Analysis, Insights and Forecast, 2020-2032
- 9.1. Market Analysis, Insights and Forecast - by Product Type
- 9.1.1. Ceramic Matrix Composites
- 9.1.2. Continuous Fiber Composites
- 9.1.3. Discontinuous Fiber Composites
- 9.1.4. Polymer Matrix Composites
- 9.1.5. Other Composites
- 9.2. Market Analysis, Insights and Forecast - by Testing Method
- 9.2.1. Destructive
- 9.2.2. Non-destructive
- 9.3. Market Analysis, Insights and Forecast - by Application
- 9.3.1. Aerospace and Defense
- 9.3.2. Automotive
- 9.3.3. Building & Construction
- 9.3.4. Electricals & Electronics
- 9.3.5. Others (Sporting Goods, Wind Energy, etc. )
- 9.1. Market Analysis, Insights and Forecast - by Product Type
- 10. Latin America Composite Testing Equipment Industry Analysis, Insights and Forecast, 2020-2032
- 10.1. Market Analysis, Insights and Forecast - by Product Type
- 10.1.1. Ceramic Matrix Composites
- 10.1.2. Continuous Fiber Composites
- 10.1.3. Discontinuous Fiber Composites
- 10.1.4. Polymer Matrix Composites
- 10.1.5. Other Composites
- 10.2. Market Analysis, Insights and Forecast - by Testing Method
- 10.2.1. Destructive
- 10.2.2. Non-destructive
- 10.3. Market Analysis, Insights and Forecast - by Application
- 10.3.1. Aerospace and Defense
- 10.3.2. Automotive
- 10.3.3. Building & Construction
- 10.3.4. Electricals & Electronics
- 10.3.5. Others (Sporting Goods, Wind Energy, etc. )
- 10.1. Market Analysis, Insights and Forecast - by Product Type
- 11. Middle East Composite Testing Equipment Industry Analysis, Insights and Forecast, 2020-2032
- 11.1. Market Analysis, Insights and Forecast - by Product Type
- 11.1.1. Ceramic Matrix Composites
- 11.1.2. Continuous Fiber Composites
- 11.1.3. Discontinuous Fiber Composites
- 11.1.4. Polymer Matrix Composites
- 11.1.5. Other Composites
- 11.2. Market Analysis, Insights and Forecast - by Testing Method
- 11.2.1. Destructive
- 11.2.2. Non-destructive
- 11.3. Market Analysis, Insights and Forecast - by Application
- 11.3.1. Aerospace and Defense
- 11.3.2. Automotive
- 11.3.3. Building & Construction
- 11.3.4. Electricals & Electronics
- 11.3.5. Others (Sporting Goods, Wind Energy, etc. )
- 11.1. Market Analysis, Insights and Forecast - by Product Type
- 12. Competitive Analysis
- 12.1. Company Profiles
- 12.1.1 Henkel AG & Co KGaA
- 12.1.1.1. Company Overview
- 12.1.1.2. Products
- 12.1.1.3. Company Financials
- 12.1.1.4. SWOT Analysis
- 12.1.2 Intertek Group PLC
- 12.1.2.1. Company Overview
- 12.1.2.2. Products
- 12.1.2.3. Company Financials
- 12.1.2.4. SWOT Analysis
- 12.1.3 ETIM Composites Testing Laboratory
- 12.1.3.1. Company Overview
- 12.1.3.2. Products
- 12.1.3.3. Company Financials
- 12.1.3.4. SWOT Analysis
- 12.1.4 Composites Testing Laboratory
- 12.1.4.1. Company Overview
- 12.1.4.2. Products
- 12.1.4.3. Company Financials
- 12.1.4.4. SWOT Analysis
- 12.1.5 Mistras Group Inc
- 12.1.5.1. Company Overview
- 12.1.5.2. Products
- 12.1.5.3. Company Financials
- 12.1.5.4. SWOT Analysis
- 12.1.6 Westmoreland Mechanical Testing & Research Inc
- 12.1.6.1. Company Overview
- 12.1.6.2. Products
- 12.1.6.3. Company Financials
- 12.1.6.4. SWOT Analysis
- 12.1.7 Element Materials Technology
- 12.1.7.1. Company Overview
- 12.1.7.2. Products
- 12.1.7.3. Company Financials
- 12.1.7.4. SWOT Analysis
- 12.1.8 Matrix Composites Inc (ITT Inc )
- 12.1.8.1. Company Overview
- 12.1.8.2. Products
- 12.1.8.3. Company Financials
- 12.1.8.4. SWOT Analysis
- 12.1.9 Instron Corporation (Illinois Tool Works Inc )
- 12.1.9.1. Company Overview
- 12.1.9.2. Products
- 12.1.9.3. Company Financials
- 12.1.9.4. SWOT Analysis
- 12.1.1 Henkel AG & Co KGaA
- 12.2. Market Entropy
- 12.2.1 Company's Key Areas Served
- 12.2.2 Recent Developments
- 12.3. Company Market Share Analysis 2025
- 12.3.1 Top 5 Companies Market Share Analysis
- 12.3.2 Top 3 Companies Market Share Analysis
- 12.4. List of Potential Customers
- 13. Research Methodology
List of Figures
- Figure 1: Global Composite Testing Equipment Industry Revenue Breakdown (billion, %) by Region 2025 & 2033
- Figure 2: Global Composite Testing Equipment Industry Volume Breakdown (K Unit, %) by Region 2025 & 2033
- Figure 3: North America Composite Testing Equipment Industry Revenue (billion), by Product Type 2025 & 2033
- Figure 4: North America Composite Testing Equipment Industry Volume (K Unit), by Product Type 2025 & 2033
- Figure 5: North America Composite Testing Equipment Industry Revenue Share (%), by Product Type 2025 & 2033
- Figure 6: North America Composite Testing Equipment Industry Volume Share (%), by Product Type 2025 & 2033
- Figure 7: North America Composite Testing Equipment Industry Revenue (billion), by Testing Method 2025 & 2033
- Figure 8: North America Composite Testing Equipment Industry Volume (K Unit), by Testing Method 2025 & 2033
- Figure 9: North America Composite Testing Equipment Industry Revenue Share (%), by Testing Method 2025 & 2033
- Figure 10: North America Composite Testing Equipment Industry Volume Share (%), by Testing Method 2025 & 2033
- Figure 11: North America Composite Testing Equipment Industry Revenue (billion), by Application 2025 & 2033
- Figure 12: North America Composite Testing Equipment Industry Volume (K Unit), by Application 2025 & 2033
- Figure 13: North America Composite Testing Equipment Industry Revenue Share (%), by Application 2025 & 2033
- Figure 14: North America Composite Testing Equipment Industry Volume Share (%), by Application 2025 & 2033
- Figure 15: North America Composite Testing Equipment Industry Revenue (billion), by Country 2025 & 2033
- Figure 16: North America Composite Testing Equipment Industry Volume (K Unit), by Country 2025 & 2033
- Figure 17: North America Composite Testing Equipment Industry Revenue Share (%), by Country 2025 & 2033
- Figure 18: North America Composite Testing Equipment Industry Volume Share (%), by Country 2025 & 2033
- Figure 19: Europe Composite Testing Equipment Industry Revenue (billion), by Product Type 2025 & 2033
- Figure 20: Europe Composite Testing Equipment Industry Volume (K Unit), by Product Type 2025 & 2033
- Figure 21: Europe Composite Testing Equipment Industry Revenue Share (%), by Product Type 2025 & 2033
- Figure 22: Europe Composite Testing Equipment Industry Volume Share (%), by Product Type 2025 & 2033
- Figure 23: Europe Composite Testing Equipment Industry Revenue (billion), by Testing Method 2025 & 2033
- Figure 24: Europe Composite Testing Equipment Industry Volume (K Unit), by Testing Method 2025 & 2033
- Figure 25: Europe Composite Testing Equipment Industry Revenue Share (%), by Testing Method 2025 & 2033
- Figure 26: Europe Composite Testing Equipment Industry Volume Share (%), by Testing Method 2025 & 2033
- Figure 27: Europe Composite Testing Equipment Industry Revenue (billion), by Application 2025 & 2033
- Figure 28: Europe Composite Testing Equipment Industry Volume (K Unit), by Application 2025 & 2033
- Figure 29: Europe Composite Testing Equipment Industry Revenue Share (%), by Application 2025 & 2033
- Figure 30: Europe Composite Testing Equipment Industry Volume Share (%), by Application 2025 & 2033
- Figure 31: Europe Composite Testing Equipment Industry Revenue (billion), by Country 2025 & 2033
- Figure 32: Europe Composite Testing Equipment Industry Volume (K Unit), by Country 2025 & 2033
- Figure 33: Europe Composite Testing Equipment Industry Revenue Share (%), by Country 2025 & 2033
- Figure 34: Europe Composite Testing Equipment Industry Volume Share (%), by Country 2025 & 2033
- Figure 35: Asia Pacific Composite Testing Equipment Industry Revenue (billion), by Product Type 2025 & 2033
- Figure 36: Asia Pacific Composite Testing Equipment Industry Volume (K Unit), by Product Type 2025 & 2033
- Figure 37: Asia Pacific Composite Testing Equipment Industry Revenue Share (%), by Product Type 2025 & 2033
- Figure 38: Asia Pacific Composite Testing Equipment Industry Volume Share (%), by Product Type 2025 & 2033
- Figure 39: Asia Pacific Composite Testing Equipment Industry Revenue (billion), by Testing Method 2025 & 2033
- Figure 40: Asia Pacific Composite Testing Equipment Industry Volume (K Unit), by Testing Method 2025 & 2033
- Figure 41: Asia Pacific Composite Testing Equipment Industry Revenue Share (%), by Testing Method 2025 & 2033
- Figure 42: Asia Pacific Composite Testing Equipment Industry Volume Share (%), by Testing Method 2025 & 2033
- Figure 43: Asia Pacific Composite Testing Equipment Industry Revenue (billion), by Application 2025 & 2033
- Figure 44: Asia Pacific Composite Testing Equipment Industry Volume (K Unit), by Application 2025 & 2033
- Figure 45: Asia Pacific Composite Testing Equipment Industry Revenue Share (%), by Application 2025 & 2033
- Figure 46: Asia Pacific Composite Testing Equipment Industry Volume Share (%), by Application 2025 & 2033
- Figure 47: Asia Pacific Composite Testing Equipment Industry Revenue (billion), by Country 2025 & 2033
- Figure 48: Asia Pacific Composite Testing Equipment Industry Volume (K Unit), by Country 2025 & 2033
- Figure 49: Asia Pacific Composite Testing Equipment Industry Revenue Share (%), by Country 2025 & 2033
- Figure 50: Asia Pacific Composite Testing Equipment Industry Volume Share (%), by Country 2025 & 2033
- Figure 51: Latin America Composite Testing Equipment Industry Revenue (billion), by Product Type 2025 & 2033
- Figure 52: Latin America Composite Testing Equipment Industry Volume (K Unit), by Product Type 2025 & 2033
- Figure 53: Latin America Composite Testing Equipment Industry Revenue Share (%), by Product Type 2025 & 2033
- Figure 54: Latin America Composite Testing Equipment Industry Volume Share (%), by Product Type 2025 & 2033
- Figure 55: Latin America Composite Testing Equipment Industry Revenue (billion), by Testing Method 2025 & 2033
- Figure 56: Latin America Composite Testing Equipment Industry Volume (K Unit), by Testing Method 2025 & 2033
- Figure 57: Latin America Composite Testing Equipment Industry Revenue Share (%), by Testing Method 2025 & 2033
- Figure 58: Latin America Composite Testing Equipment Industry Volume Share (%), by Testing Method 2025 & 2033
- Figure 59: Latin America Composite Testing Equipment Industry Revenue (billion), by Application 2025 & 2033
- Figure 60: Latin America Composite Testing Equipment Industry Volume (K Unit), by Application 2025 & 2033
- Figure 61: Latin America Composite Testing Equipment Industry Revenue Share (%), by Application 2025 & 2033
- Figure 62: Latin America Composite Testing Equipment Industry Volume Share (%), by Application 2025 & 2033
- Figure 63: Latin America Composite Testing Equipment Industry Revenue (billion), by Country 2025 & 2033
- Figure 64: Latin America Composite Testing Equipment Industry Volume (K Unit), by Country 2025 & 2033
- Figure 65: Latin America Composite Testing Equipment Industry Revenue Share (%), by Country 2025 & 2033
- Figure 66: Latin America Composite Testing Equipment Industry Volume Share (%), by Country 2025 & 2033
- Figure 67: Middle East Composite Testing Equipment Industry Revenue (billion), by Product Type 2025 & 2033
- Figure 68: Middle East Composite Testing Equipment Industry Volume (K Unit), by Product Type 2025 & 2033
- Figure 69: Middle East Composite Testing Equipment Industry Revenue Share (%), by Product Type 2025 & 2033
- Figure 70: Middle East Composite Testing Equipment Industry Volume Share (%), by Product Type 2025 & 2033
- Figure 71: Middle East Composite Testing Equipment Industry Revenue (billion), by Testing Method 2025 & 2033
- Figure 72: Middle East Composite Testing Equipment Industry Volume (K Unit), by Testing Method 2025 & 2033
- Figure 73: Middle East Composite Testing Equipment Industry Revenue Share (%), by Testing Method 2025 & 2033
- Figure 74: Middle East Composite Testing Equipment Industry Volume Share (%), by Testing Method 2025 & 2033
- Figure 75: Middle East Composite Testing Equipment Industry Revenue (billion), by Application 2025 & 2033
- Figure 76: Middle East Composite Testing Equipment Industry Volume (K Unit), by Application 2025 & 2033
- Figure 77: Middle East Composite Testing Equipment Industry Revenue Share (%), by Application 2025 & 2033
- Figure 78: Middle East Composite Testing Equipment Industry Volume Share (%), by Application 2025 & 2033
- Figure 79: Middle East Composite Testing Equipment Industry Revenue (billion), by Country 2025 & 2033
- Figure 80: Middle East Composite Testing Equipment Industry Volume (K Unit), by Country 2025 & 2033
- Figure 81: Middle East Composite Testing Equipment Industry Revenue Share (%), by Country 2025 & 2033
- Figure 82: Middle East Composite Testing Equipment Industry Volume Share (%), by Country 2025 & 2033
List of Tables
- Table 1: Global Composite Testing Equipment Industry Revenue billion Forecast, by Product Type 2020 & 2033
- Table 2: Global Composite Testing Equipment Industry Volume K Unit Forecast, by Product Type 2020 & 2033
- Table 3: Global Composite Testing Equipment Industry Revenue billion Forecast, by Testing Method 2020 & 2033
- Table 4: Global Composite Testing Equipment Industry Volume K Unit Forecast, by Testing Method 2020 & 2033
- Table 5: Global Composite Testing Equipment Industry Revenue billion Forecast, by Application 2020 & 2033
- Table 6: Global Composite Testing Equipment Industry Volume K Unit Forecast, by Application 2020 & 2033
- Table 7: Global Composite Testing Equipment Industry Revenue billion Forecast, by Region 2020 & 2033
- Table 8: Global Composite Testing Equipment Industry Volume K Unit Forecast, by Region 2020 & 2033
- Table 9: Global Composite Testing Equipment Industry Revenue billion Forecast, by Product Type 2020 & 2033
- Table 10: Global Composite Testing Equipment Industry Volume K Unit Forecast, by Product Type 2020 & 2033
- Table 11: Global Composite Testing Equipment Industry Revenue billion Forecast, by Testing Method 2020 & 2033
- Table 12: Global Composite Testing Equipment Industry Volume K Unit Forecast, by Testing Method 2020 & 2033
- Table 13: Global Composite Testing Equipment Industry Revenue billion Forecast, by Application 2020 & 2033
- Table 14: Global Composite Testing Equipment Industry Volume K Unit Forecast, by Application 2020 & 2033
- Table 15: Global Composite Testing Equipment Industry Revenue billion Forecast, by Country 2020 & 2033
- Table 16: Global Composite Testing Equipment Industry Volume K Unit Forecast, by Country 2020 & 2033
- Table 17: Global Composite Testing Equipment Industry Revenue billion Forecast, by Product Type 2020 & 2033
- Table 18: Global Composite Testing Equipment Industry Volume K Unit Forecast, by Product Type 2020 & 2033
- Table 19: Global Composite Testing Equipment Industry Revenue billion Forecast, by Testing Method 2020 & 2033
- Table 20: Global Composite Testing Equipment Industry Volume K Unit Forecast, by Testing Method 2020 & 2033
- Table 21: Global Composite Testing Equipment Industry Revenue billion Forecast, by Application 2020 & 2033
- Table 22: Global Composite Testing Equipment Industry Volume K Unit Forecast, by Application 2020 & 2033
- Table 23: Global Composite Testing Equipment Industry Revenue billion Forecast, by Country 2020 & 2033
- Table 24: Global Composite Testing Equipment Industry Volume K Unit Forecast, by Country 2020 & 2033
- Table 25: Global Composite Testing Equipment Industry Revenue billion Forecast, by Product Type 2020 & 2033
- Table 26: Global Composite Testing Equipment Industry Volume K Unit Forecast, by Product Type 2020 & 2033
- Table 27: Global Composite Testing Equipment Industry Revenue billion Forecast, by Testing Method 2020 & 2033
- Table 28: Global Composite Testing Equipment Industry Volume K Unit Forecast, by Testing Method 2020 & 2033
- Table 29: Global Composite Testing Equipment Industry Revenue billion Forecast, by Application 2020 & 2033
- Table 30: Global Composite Testing Equipment Industry Volume K Unit Forecast, by Application 2020 & 2033
- Table 31: Global Composite Testing Equipment Industry Revenue billion Forecast, by Country 2020 & 2033
- Table 32: Global Composite Testing Equipment Industry Volume K Unit Forecast, by Country 2020 & 2033
- Table 33: Global Composite Testing Equipment Industry Revenue billion Forecast, by Product Type 2020 & 2033
- Table 34: Global Composite Testing Equipment Industry Volume K Unit Forecast, by Product Type 2020 & 2033
- Table 35: Global Composite Testing Equipment Industry Revenue billion Forecast, by Testing Method 2020 & 2033
- Table 36: Global Composite Testing Equipment Industry Volume K Unit Forecast, by Testing Method 2020 & 2033
- Table 37: Global Composite Testing Equipment Industry Revenue billion Forecast, by Application 2020 & 2033
- Table 38: Global Composite Testing Equipment Industry Volume K Unit Forecast, by Application 2020 & 2033
- Table 39: Global Composite Testing Equipment Industry Revenue billion Forecast, by Country 2020 & 2033
- Table 40: Global Composite Testing Equipment Industry Volume K Unit Forecast, by Country 2020 & 2033
- Table 41: Global Composite Testing Equipment Industry Revenue billion Forecast, by Product Type 2020 & 2033
- Table 42: Global Composite Testing Equipment Industry Volume K Unit Forecast, by Product Type 2020 & 2033
- Table 43: Global Composite Testing Equipment Industry Revenue billion Forecast, by Testing Method 2020 & 2033
- Table 44: Global Composite Testing Equipment Industry Volume K Unit Forecast, by Testing Method 2020 & 2033
- Table 45: Global Composite Testing Equipment Industry Revenue billion Forecast, by Application 2020 & 2033
- Table 46: Global Composite Testing Equipment Industry Volume K Unit Forecast, by Application 2020 & 2033
- Table 47: Global Composite Testing Equipment Industry Revenue billion Forecast, by Country 2020 & 2033
- Table 48: Global Composite Testing Equipment Industry Volume K Unit Forecast, by Country 2020 & 2033
Frequently Asked Questions
1. What is the projected Compound Annual Growth Rate (CAGR) of the Composite Testing Equipment Industry?
The projected CAGR is approximately 7.16%.
2. Which companies are prominent players in the Composite Testing Equipment Industry?
Key companies in the market include Henkel AG & Co KGaA, Intertek Group PLC, ETIM Composites Testing Laboratory, Composites Testing Laboratory, Mistras Group Inc, Westmoreland Mechanical Testing & Research Inc , Element Materials Technology, Matrix Composites Inc (ITT Inc ), Instron Corporation (Illinois Tool Works Inc ).
3. What are the main segments of the Composite Testing Equipment Industry?
The market segments include Product Type, Testing Method, Application.
4. Can you provide details about the market size?
The market size is estimated to be USD 2.58 billion as of 2022.
5. What are some drivers contributing to market growth?
; Large Investments on Composites Testing Facilities in Asia-Pacific; Increasing Demand for Composite Testing From Automotive and Aerospace & Defense; Growing Demand for Testing of Hydraulic Frames in Aerospace & Defense Application.
6. What are the notable trends driving market growth?
Building and Construction Segment Expected to Show Significant Growth in Application.
7. Are there any restraints impacting market growth?
; Lack of Trained Operators and Expertise in Developing Regions; Issues Related to Recyclability of Composites.
8. Can you provide examples of recent developments in the market?
N/A
9. What pricing options are available for accessing the report?
Pricing options include single-user, multi-user, and enterprise licenses priced at USD 4750, USD 5250, and USD 8750 respectively.
10. Is the market size provided in terms of value or volume?
The market size is provided in terms of value, measured in billion and volume, measured in K Unit.
11. Are there any specific market keywords associated with the report?
Yes, the market keyword associated with the report is "Composite Testing Equipment Industry," which aids in identifying and referencing the specific market segment covered.
12. How do I determine which pricing option suits my needs best?
The pricing options vary based on user requirements and access needs. Individual users may opt for single-user licenses, while businesses requiring broader access may choose multi-user or enterprise licenses for cost-effective access to the report.
13. Are there any additional resources or data provided in the Composite Testing Equipment Industry report?
While the report offers comprehensive insights, it's advisable to review the specific contents or supplementary materials provided to ascertain if additional resources or data are available.
14. How can I stay updated on further developments or reports in the Composite Testing Equipment Industry?
To stay informed about further developments, trends, and reports in the Composite Testing Equipment Industry, consider subscribing to industry newsletters, following relevant companies and organizations, or regularly checking reputable industry news sources and publications.
Methodology
Step 1 - Identification of Relevant Samples Size from Population Database


Step 2 - Approaches for Defining Global Market Size (Value, Volume* & Price*)

Note*: In applicable scenarios
Step 3 - Data Sources
Primary Research
- Web Analytics
- Survey Reports
- Research Institute
- Latest Research Reports
- Opinion Leaders
Secondary Research
- Annual Reports
- White Paper
- Latest Press Release
- Industry Association
- Paid Database
- Investor Presentations

Step 4 - Data Triangulation
Involves using different sources of information in order to increase the validity of a study
These sources are likely to be stakeholders in a program - participants, other researchers, program staff, other community members, and so on.
Then we put all data in single framework & apply various statistical tools to find out the dynamic on the market.
During the analysis stage, feedback from the stakeholder groups would be compared to determine areas of agreement as well as areas of divergence