

Key Insights
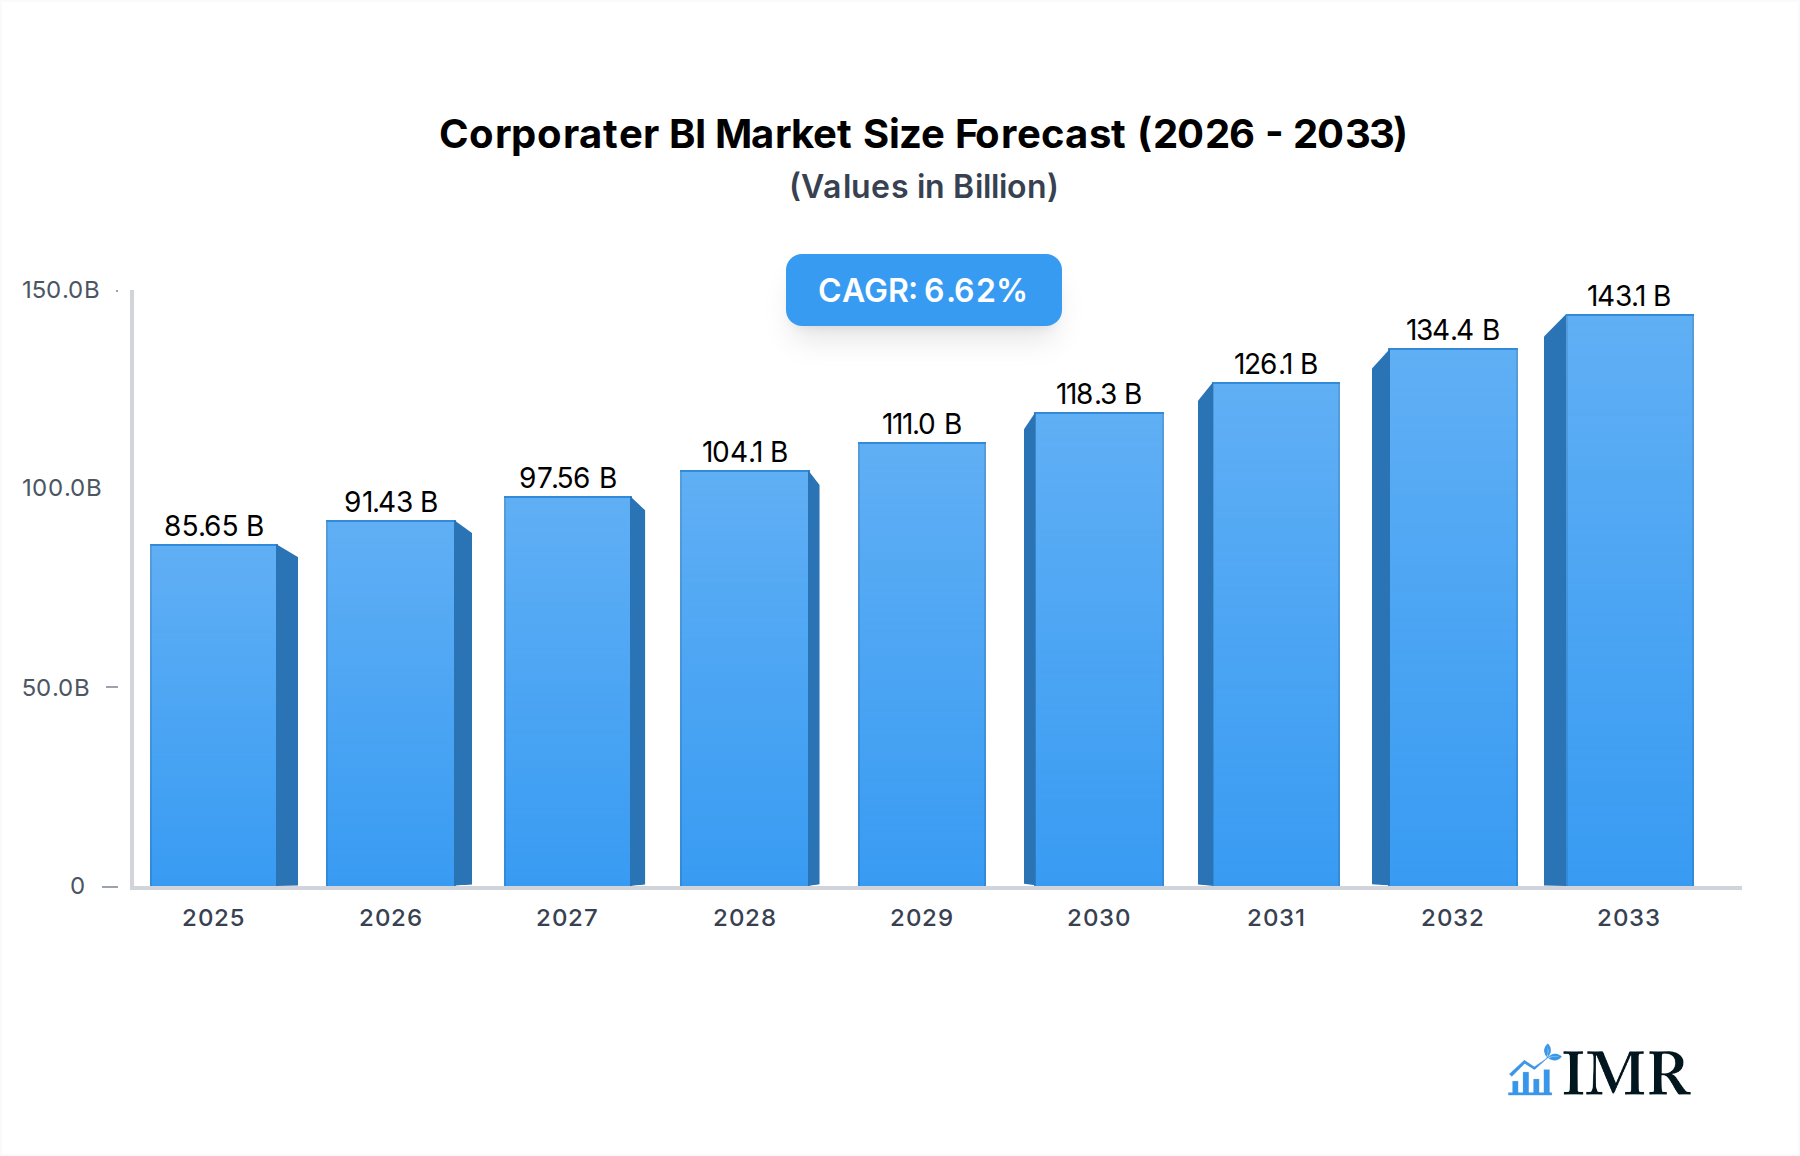
The Corporate Business Intelligence (BI) & Analytics Software market is poised for substantial growth, projected to reach $85.65 billion in 2025 and expand at a robust Compound Annual Growth Rate (CAGR) of 6.7% through 2033. This upward trajectory is fueled by a confluence of powerful drivers. The increasing volume and complexity of data generated by businesses globally necessitate sophisticated BI and analytics tools for informed decision-making, operational efficiency, and competitive advantage. Organizations across all sectors are recognizing the imperative to leverage data for customer insights, risk management, and strategic planning. The burgeoning adoption of cloud-based solutions, offering scalability and cost-effectiveness, is further accelerating market penetration, especially among small and medium-sized enterprises (SMEs) who benefit from reduced upfront infrastructure investments. The demand for real-time analytics and predictive capabilities to anticipate market shifts and customer behavior is also a significant catalyst, pushing the boundaries of traditional BI.

Corporater BI & Analytics Software Market Size (In Billion)
Key trends shaping this dynamic market include the pervasive integration of Artificial Intelligence (AI) and Machine Learning (ML) into BI platforms, enabling automated insights, natural language querying, and advanced data discovery. The rise of embedded analytics, where BI capabilities are integrated directly into other business applications, is democratizing data access and empowering a wider range of users. Furthermore, a growing emphasis on data governance and security, coupled with the need for self-service BI solutions that empower business users without extensive IT involvement, are critical developments. While the market enjoys strong growth, certain restraints exist, such as the high cost of implementation and integration for some advanced solutions, potential data privacy concerns, and the ongoing challenge of a shortage of skilled data analysts. Nonetheless, the overarching trend indicates a continued expansion as businesses worldwide increasingly prioritize data-driven strategies to thrive in an evolving economic landscape.
Corporater BI & Analytics Software Company Market Share
This in-depth report provides a complete overview of the global Corporater BI & Analytics Software market, offering critical insights for stakeholders seeking to understand market dynamics, growth trajectories, and competitive landscapes. With a study period spanning from 2019 to 2033, including a base year of 2025 and a forecast period of 2025–2033, this analysis equips you with the data and foresight needed to navigate this rapidly evolving sector. We delve into the intricacies of market structure, key growth trends, regional dominance, product innovations, and the strategic maneuvers of leading industry players.
Corporater BI & Analytics Software Market Dynamics & Structure
The Corporater BI & Analytics Software market is characterized by a moderate to high concentration, with major players like Microsoft, IBM, SAP, and Oracle holding significant market shares. Technological innovation remains a primary driver, fueled by advancements in artificial intelligence (AI), machine learning (ML), and cloud computing, enabling more sophisticated data processing and predictive analytics capabilities. Regulatory frameworks, while varying by region, are increasingly focusing on data privacy and security, influencing software development and deployment strategies. Competitive product substitutes include broader enterprise resource planning (ERP) systems with integrated BI modules and specialized data visualization tools. End-user demographics are diversifying, with a growing demand from small and medium-sized enterprises (SMEs) alongside large enterprises seeking to leverage data for strategic decision-making. Mergers and acquisitions (M&A) trends are prevalent as larger companies aim to expand their analytics portfolios and acquire innovative technologies. For instance, in the historical period (2019-2024), there were approximately 50 M&A deals in the broader BI and analytics space, with an estimated aggregate value of $50 billion. Barriers to innovation include high R&D costs and the complexity of integrating new technologies with legacy systems.
- Market Concentration: Moderate to High, driven by a few dominant global players.
- Technological Innovation Drivers: AI, ML, Cloud Computing, Big Data analytics, Augmented Analytics.
- Regulatory Frameworks: Data privacy (e.g., GDPR, CCPA), data security compliance.
- Competitive Product Substitutes: ERP modules, specialized visualization tools, open-source BI solutions.
- End-User Demographics: Expanding from large enterprises to SMEs, across various industries.
- M&A Trends: Active consolidation for technology acquisition and market expansion.
Corporater BI & Analytics Software Growth Trends & Insights
The global Corporater BI & Analytics Software market is poised for robust growth, projected to expand significantly in value from an estimated $100 billion in the base year 2025 to over $200 billion by 2033. This substantial expansion is underpinned by an accelerating adoption rate across industries, driven by the imperative for data-driven decision-making and the pursuit of operational efficiencies. The compound annual growth rate (CAGR) for the forecast period is estimated at 10.5%. Technological disruptions, particularly the integration of AI and ML into BI platforms, are transforming how businesses interact with their data, enabling automated insights, predictive modeling, and prescriptive analytics. This shift is making sophisticated analytical capabilities more accessible to a broader range of users. Consumer behavior is also evolving, with a heightened expectation for real-time data access and intuitive dashboards that simplify complex information. The increasing volume, velocity, and variety of data generated by businesses worldwide necessitate powerful and scalable BI solutions, further fueling market penetration. For instance, the adoption of cloud-based BI solutions has surged by an estimated 30% from 2019 to 2024, demonstrating a clear trend towards on-demand accessibility and scalability. The market penetration for advanced analytics features is expected to reach 75% of all BI deployments by 2033. The increasing demand for self-service BI tools empowers non-technical users to explore data independently, thus democratizing data analytics within organizations. This trend is particularly strong among SMEs who are increasingly recognizing the competitive advantages derived from data insights. The convergence of BI with other enterprise technologies, such as CRM and ERP systems, is also creating new avenues for integrated data analysis and business intelligence.
Dominant Regions, Countries, or Segments in Corporater BI & Analytics Software
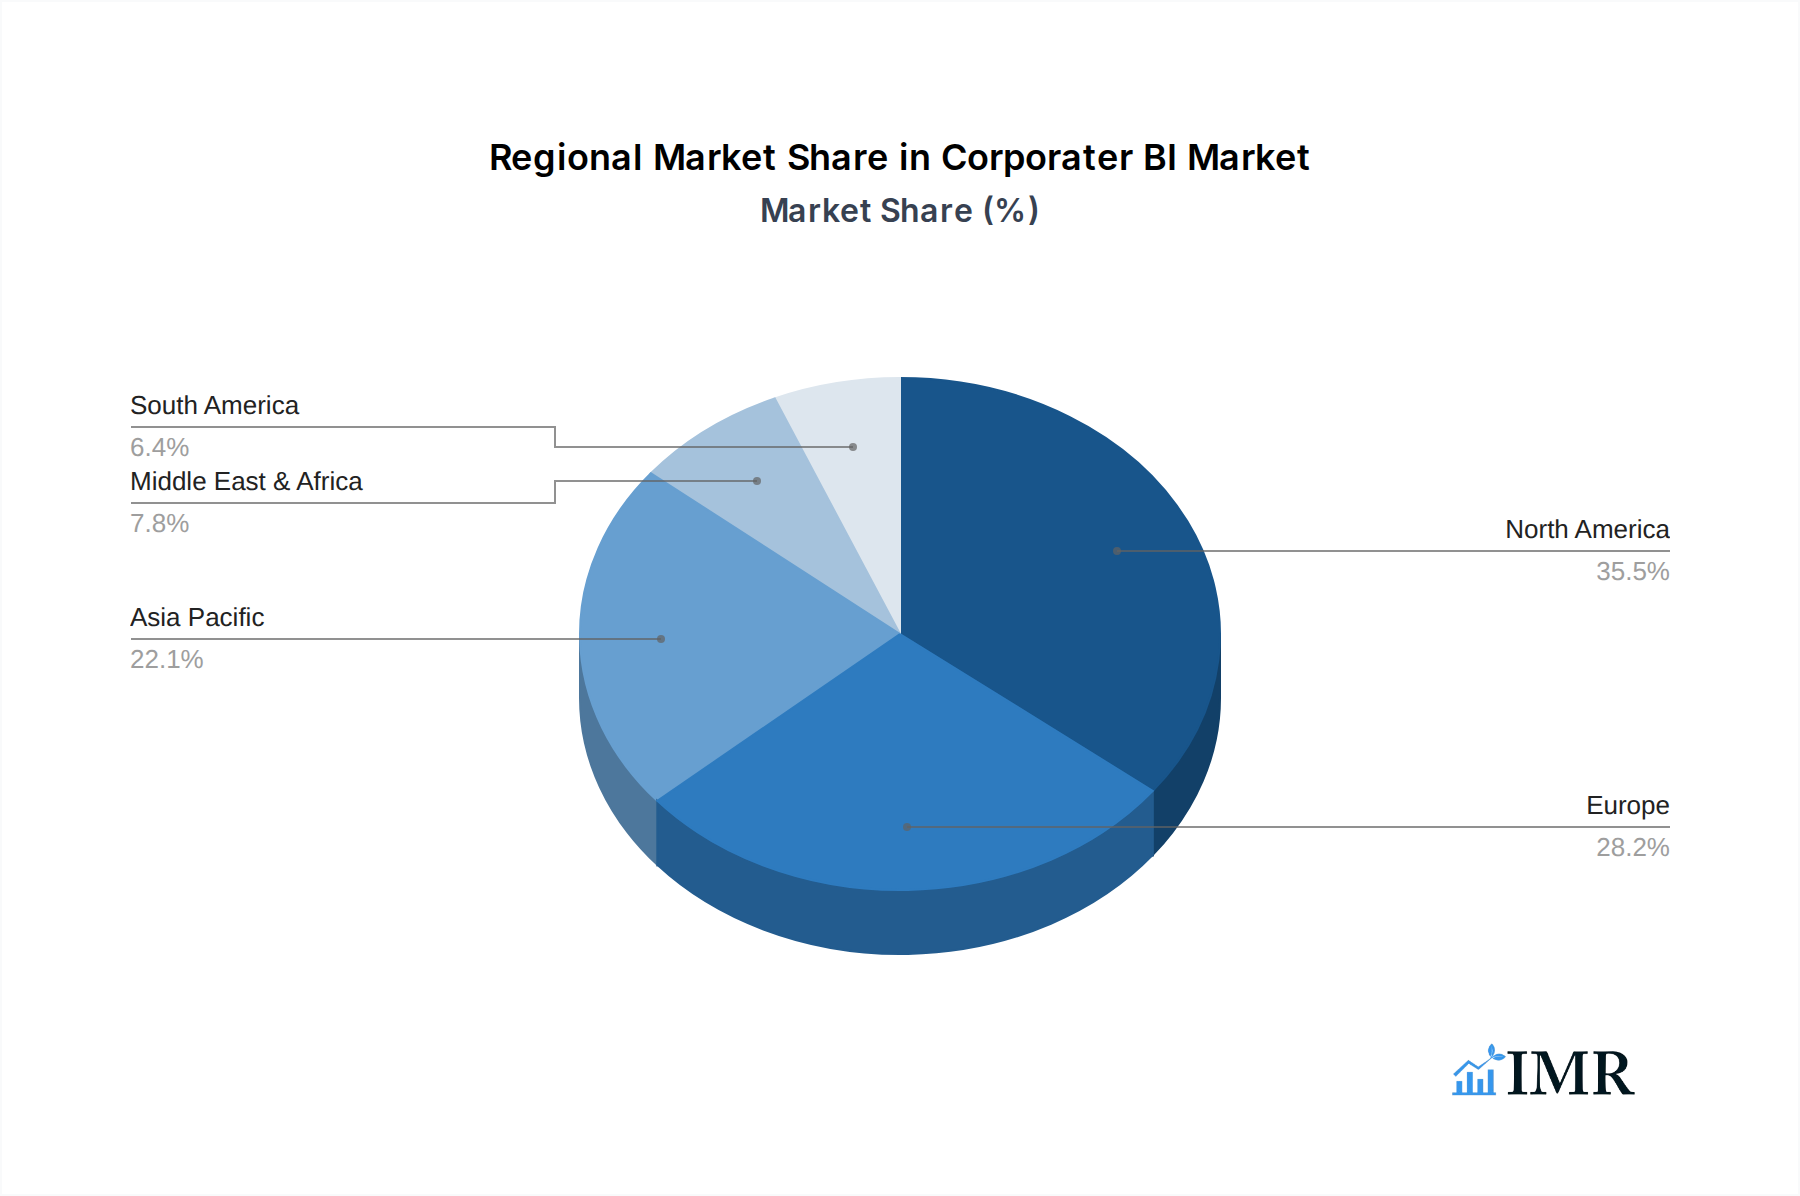
North America is anticipated to remain the dominant region in the Corporater BI & Analytics Software market throughout the forecast period, driven by its mature technological infrastructure, high adoption rates of advanced analytics, and the presence of a significant number of leading technology companies and innovative startups. The United States, in particular, will continue to be a powerhouse, contributing an estimated 40% of the global market revenue in 2025, projected to reach $40 billion. Key drivers include robust investment in R&D, a strong emphasis on data-driven business strategies across sectors, and favorable government initiatives promoting digital transformation. The large enterprise segment is currently the largest consumer of BI and analytics software, accounting for an estimated 65% of the market in 2025, with a projected market value of $65 billion. This dominance stems from their extensive data volumes, complex operational needs, and greater financial capacity to invest in comprehensive BI solutions. However, the small and medium-sized enterprises (SMEs) segment is exhibiting a higher CAGR, projected at 12%, due to the increasing affordability and accessibility of cloud-based solutions and a growing realization of the competitive edge data insights can provide. The "On-demand" (cloud-based) deployment type is rapidly outpacing "On-premises" solutions, capturing an estimated 70% of the market in 2025, valued at $70 billion. This shift is attributed to the benefits of scalability, flexibility, reduced IT overhead, and faster deployment offered by cloud solutions. For instance, the growth of Software-as-a-Service (SaaS) BI platforms has been exponential, with an estimated 40% year-over-year growth observed in the historical period (2019-2024). Infrastructure advancements, strong economic policies supporting technological adoption, and a skilled workforce further bolster North America's leadership. The region's proactive approach to data governance and security also instills confidence among businesses investing in BI solutions.
- Dominant Region: North America (especially the United States).
- Key Drivers in North America: Technological advancement, R&D investment, data-driven culture, government support for digital transformation.
- Dominant Application Segment: Large Enterprises (but SMEs showing higher growth).
- Dominant Type Segment: On-demand (Cloud-based) solutions.
- Market Share (2025 Estimate): North America ($40 billion), Large Enterprises ($65 billion), On-demand ($70 billion).
- Growth Potential: High for SMEs and On-demand solutions.
Corporater BI & Analytics Software Product Landscape
The Corporater BI & Analytics Software product landscape is continuously evolving with a strong emphasis on user-friendliness, advanced analytical capabilities, and seamless integration. Innovations such as augmented analytics, which leverages AI to automate data preparation, insight discovery, and explanation, are becoming standard features. Natural language processing (NLP) allows users to query data using conversational language, democratizing access to insights. Embedded analytics, where BI functionalities are integrated directly into other business applications, is also gaining traction, providing contextual insights at the point of need. Performance metrics are increasingly focused on real-time data processing, predictive accuracy, and the ability to handle massive datasets efficiently. Unique selling propositions often revolve around specialized industry solutions, robust data governance features, and advanced visualization options that can effectively communicate complex information.
Key Drivers, Barriers & Challenges in Corporater BI & Analytics Software
Key Drivers:
- Exponential Data Growth: The sheer volume of data generated by businesses necessitates sophisticated BI tools for analysis and decision-making.
- Demand for Data-Driven Decision Making: Organizations across all sectors are increasingly relying on data to inform strategic choices and gain a competitive edge.
- Technological Advancements: AI, ML, and cloud computing are enabling more powerful, accessible, and real-time analytical capabilities.
- Cost-Effectiveness of Cloud Solutions: On-demand BI platforms offer scalability and affordability, particularly for SMEs.
Barriers & Challenges:
- Data Quality and Governance: Ensuring data accuracy, consistency, and adherence to privacy regulations remains a significant hurdle.
- Talent Shortage: A lack of skilled data scientists and analysts can hinder the effective implementation and utilization of BI tools.
- Integration Complexity: Integrating new BI solutions with existing legacy IT systems can be challenging and time-consuming.
- Cybersecurity Threats: Protecting sensitive data from cyberattacks is a paramount concern for organizations.
- Resistance to Change: Overcoming organizational inertia and fostering a data-centric culture can be difficult. The estimated cost of data breaches related to BI systems can range from millions to billions of dollars annually.
Emerging Opportunities in Corporater BI & Analytics Software
Emerging opportunities lie in the continued advancement of augmented and predictive analytics, particularly in forecasting future trends and identifying potential risks. The growth of the Internet of Things (IoT) presents a vast untapped market for real-time data analysis, enabling businesses to monitor and optimize operations through connected devices. The demand for personalized customer experiences is driving the need for advanced customer analytics, allowing businesses to segment audiences and tailor offerings. Furthermore, the increasing adoption of AI in industries like healthcare for diagnostic support and in finance for fraud detection offers significant growth potential. The expansion of BI solutions into emerging economies with rapidly growing digital infrastructures also represents a substantial opportunity.
Growth Accelerators in the Corporater BI & Analytics Software Industry
Several catalysts are propelling the long-term growth of the Corporater BI & Analytics Software industry. Technological breakthroughs in areas like explainable AI (XAI) are increasing trust and adoption of AI-driven analytics. Strategic partnerships between BI vendors and cloud providers (e.g., Microsoft Azure, AWS, Google Cloud) are enhancing scalability and accessibility. The proliferation of data-driven cultures within organizations, supported by executive leadership, is a critical accelerator. Furthermore, the development of industry-specific BI solutions that address unique challenges and opportunities within sectors like retail, manufacturing, and healthcare is driving deeper market penetration and value realization. The rise of data marketplaces and the increasing emphasis on data democratization are also fostering innovation and broader adoption.
Key Players Shaping the Corporater BI & Analytics Software Market
- Microsoft
- IBM
- SAP
- Oracle
- Tableau Software
- SAS Institute
- Qlik
- MicroStrategy
- Information Builders
- TIBCO Software
- Pentaho
- Yellowfin
- Sisense
- Panorama
- Zoho Analytics
- Salesforce
- ThoughtSpot
- Dundas
- Teradata Corporation
- Informatica
Notable Milestones in Corporater BI & Analytics Software Sector
- 2019: Increased adoption of AI and ML for predictive analytics in enterprise BI platforms.
- 2020: Significant growth in cloud-based BI solutions driven by remote work trends.
- 2021: Major vendors invest heavily in augmented analytics and natural language query capabilities.
- 2022: Enhanced focus on data governance and privacy features due to evolving regulations.
- 2023: Emergence of embedded analytics as a key trend, integrating BI into everyday business workflows.
- 2024: Rise of data storytelling and interactive dashboards for wider audience engagement.
In-Depth Corporater BI & Analytics Software Market Outlook
The outlook for the Corporater BI & Analytics Software market remains exceptionally strong, driven by continued technological innovation and an escalating global demand for data-driven insights. Growth accelerators such as the pervasive adoption of AI and ML for advanced predictive and prescriptive analytics, coupled with the increasing accessibility of cloud-based solutions, will continue to fuel market expansion. Strategic partnerships, the democratization of data through self-service BI tools, and the development of specialized solutions for emerging industries and economies present significant opportunities for sustained growth. The market is expected to witness a CAGR of approximately 10.5% from 2025 to 2033, with a projected market value to reach over $200 billion by 2033. The ongoing digital transformation across all sectors ensures that BI and analytics software will remain indispensable tools for competitive advantage and operational excellence.
Corporater BI & Analytics Software Segmentation
-
1. Application
- 1.1. Small and medium-sized enterprises
- 1.2. Large enterprises
-
2. Types
- 2.1. On-premises
- 2.2. On-demand
Corporater BI & Analytics Software Segmentation By Geography
-
1. North America
- 1.1. United States
- 1.2. Canada
- 1.3. Mexico
-
2. South America
- 2.1. Brazil
- 2.2. Argentina
- 2.3. Rest of South America
-
3. Europe
- 3.1. United Kingdom
- 3.2. Germany
- 3.3. France
- 3.4. Italy
- 3.5. Spain
- 3.6. Russia
- 3.7. Benelux
- 3.8. Nordics
- 3.9. Rest of Europe
-
4. Middle East & Africa
- 4.1. Turkey
- 4.2. Israel
- 4.3. GCC
- 4.4. North Africa
- 4.5. South Africa
- 4.6. Rest of Middle East & Africa
-
5. Asia Pacific
- 5.1. China
- 5.2. India
- 5.3. Japan
- 5.4. South Korea
- 5.5. ASEAN
- 5.6. Oceania
- 5.7. Rest of Asia Pacific
Corporater BI & Analytics Software Regional Market Share
Geographic Coverage of Corporater BI & Analytics Software
Corporater BI & Analytics Software REPORT HIGHLIGHTS
| Aspects | Details |
|---|---|
| Study Period | 2020-2034 |
| Base Year | 2025 |
| Estimated Year | 2026 |
| Forecast Period | 2026-2034 |
| Historical Period | 2020-2025 |
| Growth Rate | CAGR of 6.7% from 2020-2034 |
| Segmentation |
|
Table of Contents
- 1. Introduction
- 1.1. Research Scope
- 1.2. Market Segmentation
- 1.3. Research Objective
- 1.4. Definitions and Assumptions
- 2. Executive Summary
- 2.1. Market Snapshot
- 3. Market Dynamics
- 3.1. Market Drivers
- 3.2. Market Restrains
- 3.3. Market Trends
- 3.4. Market Opportunities
- 4. Market Factor Analysis
- 4.1. Porters Five Forces
- 4.1.1. Bargaining Power of Suppliers
- 4.1.2. Bargaining Power of Buyers
- 4.1.3. Threat of New Entrants
- 4.1.4. Threat of Substitutes
- 4.1.5. Competitive Rivalry
- 4.2. PESTEL analysis
- 4.3. BCG Analysis
- 4.3.1. Stars (High Growth, High Market Share)
- 4.3.2. Cash Cows (Low Growth, High Market Share)
- 4.3.3. Question Mark (High Growth, Low Market Share)
- 4.3.4. Dogs (Low Growth, Low Market Share)
- 4.4. Ansoff Matrix Analysis
- 4.5. Supply Chain Analysis
- 4.6. Regulatory Landscape
- 4.7. Current Market Potential and Opportunity Assessment (TAM–SAM–SOM Framework)
- 4.8. IMR Analyst Note
- 4.1. Porters Five Forces
- 5. Market Analysis, Insights and Forecast 2021-2033
- 5.1. Market Analysis, Insights and Forecast - by Application
- 5.1.1. Small and medium-sized enterprises
- 5.1.2. Large enterprises
- 5.2. Market Analysis, Insights and Forecast - by Types
- 5.2.1. On-premises
- 5.2.2. On-demand
- 5.3. Market Analysis, Insights and Forecast - by Region
- 5.3.1. North America
- 5.3.2. South America
- 5.3.3. Europe
- 5.3.4. Middle East & Africa
- 5.3.5. Asia Pacific
- 5.1. Market Analysis, Insights and Forecast - by Application
- 6. Global Corporater BI & Analytics Software Analysis, Insights and Forecast, 2021-2033
- 6.1. Market Analysis, Insights and Forecast - by Application
- 6.1.1. Small and medium-sized enterprises
- 6.1.2. Large enterprises
- 6.2. Market Analysis, Insights and Forecast - by Types
- 6.2.1. On-premises
- 6.2.2. On-demand
- 6.1. Market Analysis, Insights and Forecast - by Application
- 7. North America Corporater BI & Analytics Software Analysis, Insights and Forecast, 2020-2032
- 7.1. Market Analysis, Insights and Forecast - by Application
- 7.1.1. Small and medium-sized enterprises
- 7.1.2. Large enterprises
- 7.2. Market Analysis, Insights and Forecast - by Types
- 7.2.1. On-premises
- 7.2.2. On-demand
- 7.1. Market Analysis, Insights and Forecast - by Application
- 8. South America Corporater BI & Analytics Software Analysis, Insights and Forecast, 2020-2032
- 8.1. Market Analysis, Insights and Forecast - by Application
- 8.1.1. Small and medium-sized enterprises
- 8.1.2. Large enterprises
- 8.2. Market Analysis, Insights and Forecast - by Types
- 8.2.1. On-premises
- 8.2.2. On-demand
- 8.1. Market Analysis, Insights and Forecast - by Application
- 9. Europe Corporater BI & Analytics Software Analysis, Insights and Forecast, 2020-2032
- 9.1. Market Analysis, Insights and Forecast - by Application
- 9.1.1. Small and medium-sized enterprises
- 9.1.2. Large enterprises
- 9.2. Market Analysis, Insights and Forecast - by Types
- 9.2.1. On-premises
- 9.2.2. On-demand
- 9.1. Market Analysis, Insights and Forecast - by Application
- 10. Middle East & Africa Corporater BI & Analytics Software Analysis, Insights and Forecast, 2020-2032
- 10.1. Market Analysis, Insights and Forecast - by Application
- 10.1.1. Small and medium-sized enterprises
- 10.1.2. Large enterprises
- 10.2. Market Analysis, Insights and Forecast - by Types
- 10.2.1. On-premises
- 10.2.2. On-demand
- 10.1. Market Analysis, Insights and Forecast - by Application
- 11. Asia Pacific Corporater BI & Analytics Software Analysis, Insights and Forecast, 2020-2032
- 11.1. Market Analysis, Insights and Forecast - by Application
- 11.1.1. Small and medium-sized enterprises
- 11.1.2. Large enterprises
- 11.2. Market Analysis, Insights and Forecast - by Types
- 11.2.1. On-premises
- 11.2.2. On-demand
- 11.1. Market Analysis, Insights and Forecast - by Application
- 12. Competitive Analysis
- 12.1. Company Profiles
- 12.1.1 Microsoft
- 12.1.1.1. Company Overview
- 12.1.1.2. Products
- 12.1.1.3. Company Financials
- 12.1.1.4. SWOT Analysis
- 12.1.2 IBM
- 12.1.2.1. Company Overview
- 12.1.2.2. Products
- 12.1.2.3. Company Financials
- 12.1.2.4. SWOT Analysis
- 12.1.3 SAP
- 12.1.3.1. Company Overview
- 12.1.3.2. Products
- 12.1.3.3. Company Financials
- 12.1.3.4. SWOT Analysis
- 12.1.4 Oracle
- 12.1.4.1. Company Overview
- 12.1.4.2. Products
- 12.1.4.3. Company Financials
- 12.1.4.4. SWOT Analysis
- 12.1.5 Tableau Software
- 12.1.5.1. Company Overview
- 12.1.5.2. Products
- 12.1.5.3. Company Financials
- 12.1.5.4. SWOT Analysis
- 12.1.6 SAS Institute
- 12.1.6.1. Company Overview
- 12.1.6.2. Products
- 12.1.6.3. Company Financials
- 12.1.6.4. SWOT Analysis
- 12.1.7 Qlik
- 12.1.7.1. Company Overview
- 12.1.7.2. Products
- 12.1.7.3. Company Financials
- 12.1.7.4. SWOT Analysis
- 12.1.8 MicroStrategy
- 12.1.8.1. Company Overview
- 12.1.8.2. Products
- 12.1.8.3. Company Financials
- 12.1.8.4. SWOT Analysis
- 12.1.9 Information Builders
- 12.1.9.1. Company Overview
- 12.1.9.2. Products
- 12.1.9.3. Company Financials
- 12.1.9.4. SWOT Analysis
- 12.1.10 TIBCO Software
- 12.1.10.1. Company Overview
- 12.1.10.2. Products
- 12.1.10.3. Company Financials
- 12.1.10.4. SWOT Analysis
- 12.1.11 Pentaho
- 12.1.11.1. Company Overview
- 12.1.11.2. Products
- 12.1.11.3. Company Financials
- 12.1.11.4. SWOT Analysis
- 12.1.12 Yellowfin
- 12.1.12.1. Company Overview
- 12.1.12.2. Products
- 12.1.12.3. Company Financials
- 12.1.12.4. SWOT Analysis
- 12.1.13 Sisense
- 12.1.13.1. Company Overview
- 12.1.13.2. Products
- 12.1.13.3. Company Financials
- 12.1.13.4. SWOT Analysis
- 12.1.14 Panorama
- 12.1.14.1. Company Overview
- 12.1.14.2. Products
- 12.1.14.3. Company Financials
- 12.1.14.4. SWOT Analysis
- 12.1.15 Zoho Analytics
- 12.1.15.1. Company Overview
- 12.1.15.2. Products
- 12.1.15.3. Company Financials
- 12.1.15.4. SWOT Analysis
- 12.1.16 Salesforce
- 12.1.16.1. Company Overview
- 12.1.16.2. Products
- 12.1.16.3. Company Financials
- 12.1.16.4. SWOT Analysis
- 12.1.17 ThoughtSpot
- 12.1.17.1. Company Overview
- 12.1.17.2. Products
- 12.1.17.3. Company Financials
- 12.1.17.4. SWOT Analysis
- 12.1.18 Dundas
- 12.1.18.1. Company Overview
- 12.1.18.2. Products
- 12.1.18.3. Company Financials
- 12.1.18.4. SWOT Analysis
- 12.1.19 Teradata Corporation
- 12.1.19.1. Company Overview
- 12.1.19.2. Products
- 12.1.19.3. Company Financials
- 12.1.19.4. SWOT Analysis
- 12.1.20 Informatica
- 12.1.20.1. Company Overview
- 12.1.20.2. Products
- 12.1.20.3. Company Financials
- 12.1.20.4. SWOT Analysis
- 12.1.1 Microsoft
- 12.2. Market Entropy
- 12.2.1 Company's Key Areas Served
- 12.2.2 Recent Developments
- 12.3. Company Market Share Analysis 2025
- 12.3.1 Top 5 Companies Market Share Analysis
- 12.3.2 Top 3 Companies Market Share Analysis
- 12.4. List of Potential Customers
- 13. Research Methodology
List of Figures
- Figure 1: Global Corporater BI & Analytics Software Revenue Breakdown (billion, %) by Region 2025 & 2033
- Figure 2: North America Corporater BI & Analytics Software Revenue (billion), by Application 2025 & 2033
- Figure 3: North America Corporater BI & Analytics Software Revenue Share (%), by Application 2025 & 2033
- Figure 4: North America Corporater BI & Analytics Software Revenue (billion), by Types 2025 & 2033
- Figure 5: North America Corporater BI & Analytics Software Revenue Share (%), by Types 2025 & 2033
- Figure 6: North America Corporater BI & Analytics Software Revenue (billion), by Country 2025 & 2033
- Figure 7: North America Corporater BI & Analytics Software Revenue Share (%), by Country 2025 & 2033
- Figure 8: South America Corporater BI & Analytics Software Revenue (billion), by Application 2025 & 2033
- Figure 9: South America Corporater BI & Analytics Software Revenue Share (%), by Application 2025 & 2033
- Figure 10: South America Corporater BI & Analytics Software Revenue (billion), by Types 2025 & 2033
- Figure 11: South America Corporater BI & Analytics Software Revenue Share (%), by Types 2025 & 2033
- Figure 12: South America Corporater BI & Analytics Software Revenue (billion), by Country 2025 & 2033
- Figure 13: South America Corporater BI & Analytics Software Revenue Share (%), by Country 2025 & 2033
- Figure 14: Europe Corporater BI & Analytics Software Revenue (billion), by Application 2025 & 2033
- Figure 15: Europe Corporater BI & Analytics Software Revenue Share (%), by Application 2025 & 2033
- Figure 16: Europe Corporater BI & Analytics Software Revenue (billion), by Types 2025 & 2033
- Figure 17: Europe Corporater BI & Analytics Software Revenue Share (%), by Types 2025 & 2033
- Figure 18: Europe Corporater BI & Analytics Software Revenue (billion), by Country 2025 & 2033
- Figure 19: Europe Corporater BI & Analytics Software Revenue Share (%), by Country 2025 & 2033
- Figure 20: Middle East & Africa Corporater BI & Analytics Software Revenue (billion), by Application 2025 & 2033
- Figure 21: Middle East & Africa Corporater BI & Analytics Software Revenue Share (%), by Application 2025 & 2033
- Figure 22: Middle East & Africa Corporater BI & Analytics Software Revenue (billion), by Types 2025 & 2033
- Figure 23: Middle East & Africa Corporater BI & Analytics Software Revenue Share (%), by Types 2025 & 2033
- Figure 24: Middle East & Africa Corporater BI & Analytics Software Revenue (billion), by Country 2025 & 2033
- Figure 25: Middle East & Africa Corporater BI & Analytics Software Revenue Share (%), by Country 2025 & 2033
- Figure 26: Asia Pacific Corporater BI & Analytics Software Revenue (billion), by Application 2025 & 2033
- Figure 27: Asia Pacific Corporater BI & Analytics Software Revenue Share (%), by Application 2025 & 2033
- Figure 28: Asia Pacific Corporater BI & Analytics Software Revenue (billion), by Types 2025 & 2033
- Figure 29: Asia Pacific Corporater BI & Analytics Software Revenue Share (%), by Types 2025 & 2033
- Figure 30: Asia Pacific Corporater BI & Analytics Software Revenue (billion), by Country 2025 & 2033
- Figure 31: Asia Pacific Corporater BI & Analytics Software Revenue Share (%), by Country 2025 & 2033
List of Tables
- Table 1: Global Corporater BI & Analytics Software Revenue billion Forecast, by Application 2020 & 2033
- Table 2: Global Corporater BI & Analytics Software Revenue billion Forecast, by Types 2020 & 2033
- Table 3: Global Corporater BI & Analytics Software Revenue billion Forecast, by Region 2020 & 2033
- Table 4: Global Corporater BI & Analytics Software Revenue billion Forecast, by Application 2020 & 2033
- Table 5: Global Corporater BI & Analytics Software Revenue billion Forecast, by Types 2020 & 2033
- Table 6: Global Corporater BI & Analytics Software Revenue billion Forecast, by Country 2020 & 2033
- Table 7: United States Corporater BI & Analytics Software Revenue (billion) Forecast, by Application 2020 & 2033
- Table 8: Canada Corporater BI & Analytics Software Revenue (billion) Forecast, by Application 2020 & 2033
- Table 9: Mexico Corporater BI & Analytics Software Revenue (billion) Forecast, by Application 2020 & 2033
- Table 10: Global Corporater BI & Analytics Software Revenue billion Forecast, by Application 2020 & 2033
- Table 11: Global Corporater BI & Analytics Software Revenue billion Forecast, by Types 2020 & 2033
- Table 12: Global Corporater BI & Analytics Software Revenue billion Forecast, by Country 2020 & 2033
- Table 13: Brazil Corporater BI & Analytics Software Revenue (billion) Forecast, by Application 2020 & 2033
- Table 14: Argentina Corporater BI & Analytics Software Revenue (billion) Forecast, by Application 2020 & 2033
- Table 15: Rest of South America Corporater BI & Analytics Software Revenue (billion) Forecast, by Application 2020 & 2033
- Table 16: Global Corporater BI & Analytics Software Revenue billion Forecast, by Application 2020 & 2033
- Table 17: Global Corporater BI & Analytics Software Revenue billion Forecast, by Types 2020 & 2033
- Table 18: Global Corporater BI & Analytics Software Revenue billion Forecast, by Country 2020 & 2033
- Table 19: United Kingdom Corporater BI & Analytics Software Revenue (billion) Forecast, by Application 2020 & 2033
- Table 20: Germany Corporater BI & Analytics Software Revenue (billion) Forecast, by Application 2020 & 2033
- Table 21: France Corporater BI & Analytics Software Revenue (billion) Forecast, by Application 2020 & 2033
- Table 22: Italy Corporater BI & Analytics Software Revenue (billion) Forecast, by Application 2020 & 2033
- Table 23: Spain Corporater BI & Analytics Software Revenue (billion) Forecast, by Application 2020 & 2033
- Table 24: Russia Corporater BI & Analytics Software Revenue (billion) Forecast, by Application 2020 & 2033
- Table 25: Benelux Corporater BI & Analytics Software Revenue (billion) Forecast, by Application 2020 & 2033
- Table 26: Nordics Corporater BI & Analytics Software Revenue (billion) Forecast, by Application 2020 & 2033
- Table 27: Rest of Europe Corporater BI & Analytics Software Revenue (billion) Forecast, by Application 2020 & 2033
- Table 28: Global Corporater BI & Analytics Software Revenue billion Forecast, by Application 2020 & 2033
- Table 29: Global Corporater BI & Analytics Software Revenue billion Forecast, by Types 2020 & 2033
- Table 30: Global Corporater BI & Analytics Software Revenue billion Forecast, by Country 2020 & 2033
- Table 31: Turkey Corporater BI & Analytics Software Revenue (billion) Forecast, by Application 2020 & 2033
- Table 32: Israel Corporater BI & Analytics Software Revenue (billion) Forecast, by Application 2020 & 2033
- Table 33: GCC Corporater BI & Analytics Software Revenue (billion) Forecast, by Application 2020 & 2033
- Table 34: North Africa Corporater BI & Analytics Software Revenue (billion) Forecast, by Application 2020 & 2033
- Table 35: South Africa Corporater BI & Analytics Software Revenue (billion) Forecast, by Application 2020 & 2033
- Table 36: Rest of Middle East & Africa Corporater BI & Analytics Software Revenue (billion) Forecast, by Application 2020 & 2033
- Table 37: Global Corporater BI & Analytics Software Revenue billion Forecast, by Application 2020 & 2033
- Table 38: Global Corporater BI & Analytics Software Revenue billion Forecast, by Types 2020 & 2033
- Table 39: Global Corporater BI & Analytics Software Revenue billion Forecast, by Country 2020 & 2033
- Table 40: China Corporater BI & Analytics Software Revenue (billion) Forecast, by Application 2020 & 2033
- Table 41: India Corporater BI & Analytics Software Revenue (billion) Forecast, by Application 2020 & 2033
- Table 42: Japan Corporater BI & Analytics Software Revenue (billion) Forecast, by Application 2020 & 2033
- Table 43: South Korea Corporater BI & Analytics Software Revenue (billion) Forecast, by Application 2020 & 2033
- Table 44: ASEAN Corporater BI & Analytics Software Revenue (billion) Forecast, by Application 2020 & 2033
- Table 45: Oceania Corporater BI & Analytics Software Revenue (billion) Forecast, by Application 2020 & 2033
- Table 46: Rest of Asia Pacific Corporater BI & Analytics Software Revenue (billion) Forecast, by Application 2020 & 2033
Frequently Asked Questions
1. What is the projected Compound Annual Growth Rate (CAGR) of the Corporater BI & Analytics Software?
The projected CAGR is approximately 6.7%.
2. Which companies are prominent players in the Corporater BI & Analytics Software?
Key companies in the market include Microsoft, IBM, SAP, Oracle, Tableau Software, SAS Institute, Qlik, MicroStrategy, Information Builders, TIBCO Software, Pentaho, Yellowfin, Sisense, Panorama, Zoho Analytics, Salesforce, ThoughtSpot, Dundas, Teradata Corporation, Informatica.
3. What are the main segments of the Corporater BI & Analytics Software?
The market segments include Application, Types.
4. Can you provide details about the market size?
The market size is estimated to be USD 85.65 billion as of 2022.
5. What are some drivers contributing to market growth?
N/A
6. What are the notable trends driving market growth?
N/A
7. Are there any restraints impacting market growth?
N/A
8. Can you provide examples of recent developments in the market?
N/A
9. What pricing options are available for accessing the report?
Pricing options include single-user, multi-user, and enterprise licenses priced at USD 3350.00, USD 5025.00, and USD 6700.00 respectively.
10. Is the market size provided in terms of value or volume?
The market size is provided in terms of value, measured in billion.
11. Are there any specific market keywords associated with the report?
Yes, the market keyword associated with the report is "Corporater BI & Analytics Software," which aids in identifying and referencing the specific market segment covered.
12. How do I determine which pricing option suits my needs best?
The pricing options vary based on user requirements and access needs. Individual users may opt for single-user licenses, while businesses requiring broader access may choose multi-user or enterprise licenses for cost-effective access to the report.
13. Are there any additional resources or data provided in the Corporater BI & Analytics Software report?
While the report offers comprehensive insights, it's advisable to review the specific contents or supplementary materials provided to ascertain if additional resources or data are available.
14. How can I stay updated on further developments or reports in the Corporater BI & Analytics Software?
To stay informed about further developments, trends, and reports in the Corporater BI & Analytics Software, consider subscribing to industry newsletters, following relevant companies and organizations, or regularly checking reputable industry news sources and publications.
Methodology
Step 1 - Identification of Relevant Samples Size from Population Database


Step 2 - Approaches for Defining Global Market Size (Value, Volume* & Price*)

Note*: In applicable scenarios
Step 3 - Data Sources
Primary Research
- Web Analytics
- Survey Reports
- Research Institute
- Latest Research Reports
- Opinion Leaders
Secondary Research
- Annual Reports
- White Paper
- Latest Press Release
- Industry Association
- Paid Database
- Investor Presentations

Step 4 - Data Triangulation
Involves using different sources of information in order to increase the validity of a study
These sources are likely to be stakeholders in a program - participants, other researchers, program staff, other community members, and so on.
Then we put all data in single framework & apply various statistical tools to find out the dynamic on the market.
During the analysis stage, feedback from the stakeholder groups would be compared to determine areas of agreement as well as areas of divergence