

Key Insights
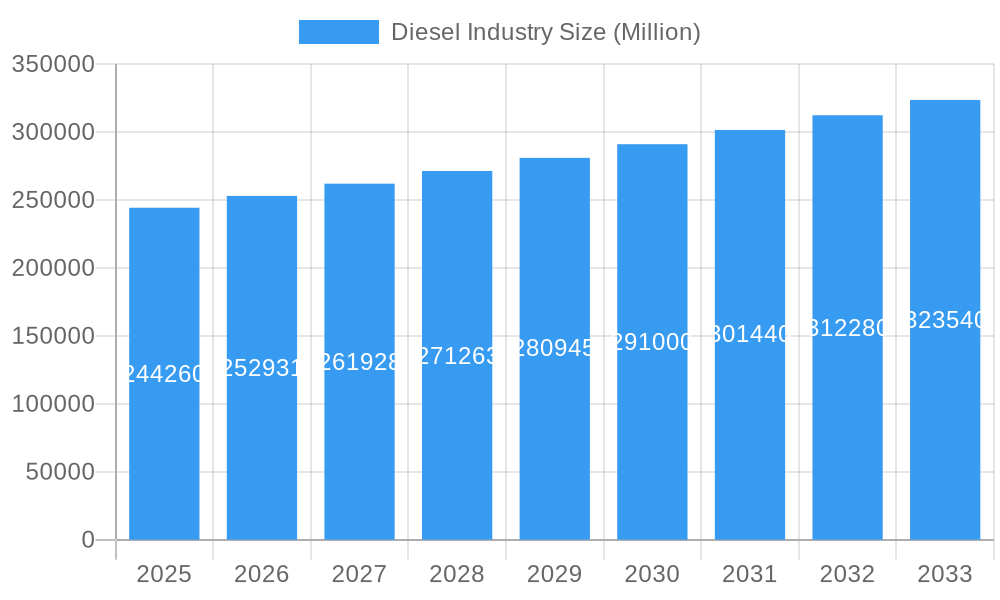
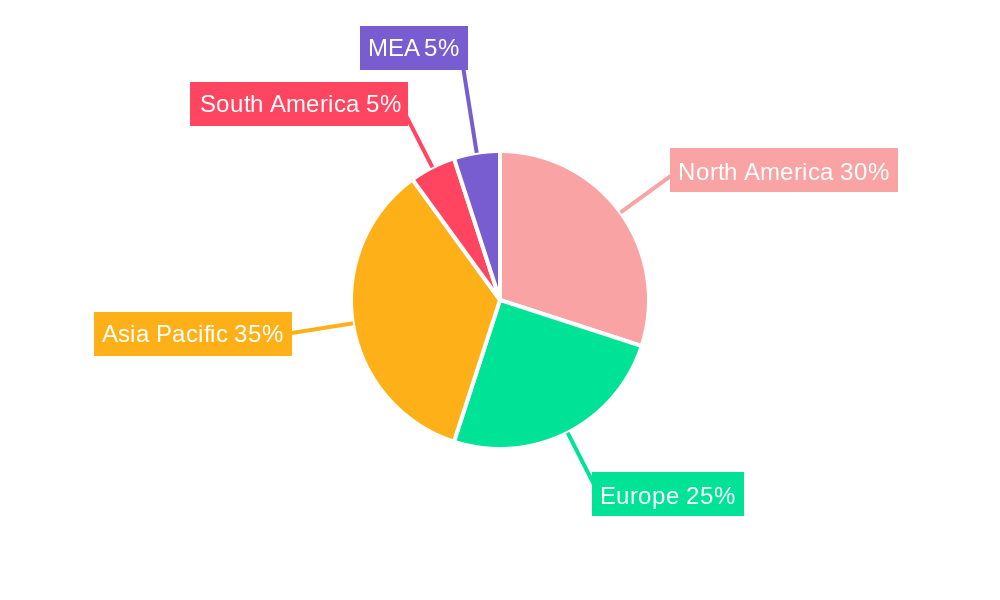
The global diesel fuel market, currently valued at $244.26 billion (2025), is projected to experience steady growth, exhibiting a Compound Annual Growth Rate (CAGR) of 3.50% from 2025 to 2033. This growth is primarily driven by the persistent demand from the transportation sector, particularly heavy-duty vehicles like trucks and buses, which rely heavily on diesel for their power needs. The industrial sector, encompassing construction, agriculture, and manufacturing, also contributes significantly to diesel consumption, further fueling market expansion. Emerging trends such as the increasing adoption of more fuel-efficient diesel engines and advancements in biodiesel technology are expected to positively influence market dynamics. However, growing environmental concerns regarding diesel emissions, stringent government regulations aimed at reducing carbon footprints, and the gradual shift towards alternative fuels like electricity and natural gas present considerable restraints to market growth. The market is segmented geographically, with North America, Europe, and Asia Pacific representing major consumer regions. Key players such as BP plc, Reliance Industries Ltd, Exxon Mobil Corporation, and Shell Plc dominate the market landscape, employing strategies focused on enhancing production efficiency, expanding distribution networks, and developing advanced diesel formulations.
Diesel Industry Market Size (In Billion)
The forecast period (2025-2033) suggests a continued, albeit moderate, expansion of the diesel market. Factors like economic growth in developing nations, particularly in Asia Pacific, and increasing industrialization will continue to bolster demand. However, the pace of growth will likely be influenced by the success of governmental initiatives aimed at promoting alternative fuels and stricter emission standards. Competition among major players will remain intense, with companies focusing on technological innovation, strategic partnerships, and geographical expansion to maintain market share. The evolution of diesel technology, including the development of cleaner-burning fuels and advanced engine designs, will significantly influence the market's trajectory in the long term. A focus on sustainable practices and the integration of renewable resources into diesel production will likely become increasingly crucial in mitigating environmental concerns and ensuring future market viability.
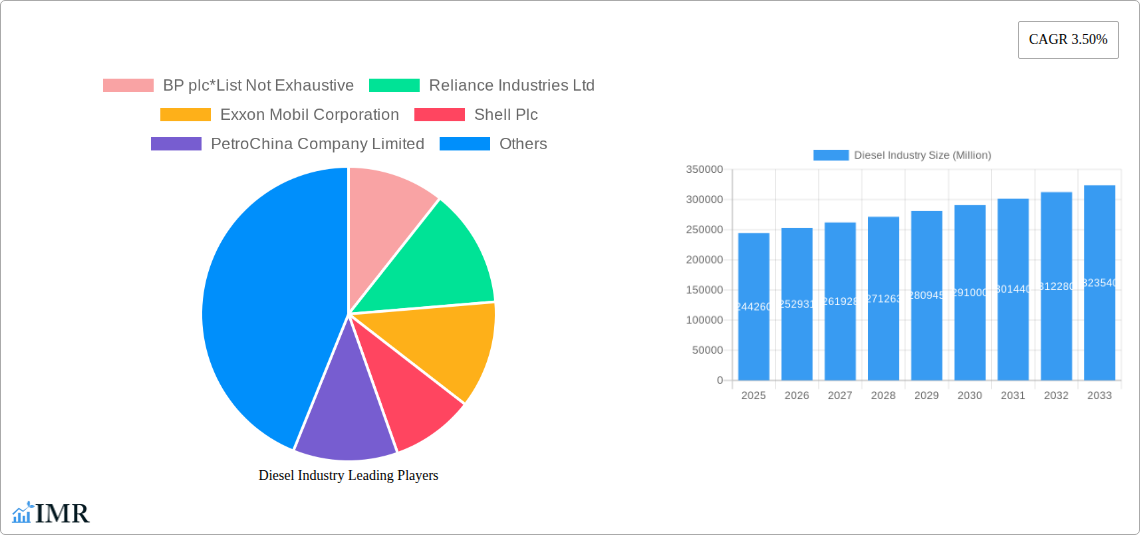
Diesel Industry Company Market Share
Diesel Industry Market Report: 2019-2033
This comprehensive report provides an in-depth analysis of the global diesel industry, encompassing market dynamics, growth trends, regional dominance, product landscape, key players, and future outlook. The study period covers 2019-2033, with a base year of 2025 and a forecast period of 2025-2033. This report is crucial for industry professionals, investors, and strategists seeking to navigate the evolving landscape of the diesel market. The report values are presented in million units.
Diesel Industry Market Dynamics & Structure
The diesel industry is characterized by a concentrated market structure, with a few major players holding significant market share. Global market concentration is estimated at xx% in 2025. Technological innovation, driven by stricter emission regulations and the pursuit of efficiency gains, is a key dynamic. The regulatory environment is increasingly stringent, pushing companies towards cleaner and more sustainable solutions. Biodiesel and other alternative fuels pose a significant competitive threat, while the end-user demographic is shifting towards larger commercial and industrial applications. Mergers and acquisitions (M&A) activity remains significant, with an estimated xx billion USD in deal volume in 2024.
- Market Concentration: xx% dominated by top 5 players in 2025
- Technological Innovation: Focus on emission reduction technologies, fuel efficiency improvements.
- Regulatory Landscape: Stringent emission standards globally impacting production and distribution.
- Competitive Substitutes: Growing adoption of biofuels and alternative fuels poses a challenge.
- End-User Demographics: Increasing demand from commercial transportation and industrial sectors.
- M&A Activity: xx billion USD in deal volume in 2024, consolidating market share.
Diesel Industry Growth Trends & Insights
The global diesel industry experienced a period of [mention overall trend - growth/decline] during the historical period (2019-2024). Factors such as [mention specific factors like economic growth, industrial activity, etc.] influenced the market size. However, the forecast period (2025-2033) is projected to show [mention projected trend - growth/decline] with a compound annual growth rate (CAGR) of xx%. Technological advancements such as improved fuel efficiency and emission control technologies are driving market expansion. Consumer behavior is also shifting, with increased focus on sustainability and environmental concerns. Market penetration of advanced diesel technologies is anticipated to reach xx% by 2033.
Dominant Regions, Countries, or Segments in Diesel Industry
The transportation segment is the dominant end-user, accounting for xx% of the market in 2025. [Mention specific region/country] is the leading region/country, driven by [mention reasons - strong industrial sector, high vehicle ownership, robust infrastructure etc.]. The industrial segment exhibits significant growth potential, particularly in [mention specific emerging economies].
- Key Drivers in Transportation: Strong economic growth in developing nations, high vehicle ownership rates.
- Key Drivers in Industrial: Increasing industrialization, demand for heavy-duty vehicles.
- Market Share: Transportation segment holds xx% market share in 2025, followed by industrial at xx%.
- Growth Potential: Industrial segment shows highest growth potential, reaching xx% market share by 2033.
Diesel Industry Product Landscape
Diesel fuel continues to dominate the market, with advancements focusing on reducing emissions and enhancing fuel efficiency. Innovations include ultra-low sulfur diesel (ULSD) and biodiesel blends. Performance metrics are increasingly focused on reducing particulate matter and nitrogen oxide emissions, meeting stricter environmental regulations. The unique selling proposition lies in high energy density and established infrastructure.
Key Drivers, Barriers & Challenges in Diesel Industry
Key Drivers: Growing industrialization in developing countries, increasing demand for heavy-duty vehicles, ongoing advancements in fuel efficiency and emission control technologies.
Key Challenges: Stringent environmental regulations leading to higher production costs, increased competition from alternative fuels (xx% market share by 2033), potential fluctuations in crude oil prices impacting profitability.
Emerging Opportunities in Diesel Industry
Emerging opportunities exist in the development and adoption of cleaner diesel technologies, including the use of renewable feedstocks for biodiesel production and the integration of advanced emission control systems. The growing adoption of alternative fuels presents both challenges and opportunities. Untapped markets in developing economies offer significant growth potential.
Growth Accelerators in the Diesel Industry Industry
Long-term growth is driven by strategic partnerships to develop advanced technologies and sustainable fuels, expansion into new markets, and government policies promoting cleaner fuels and efficient transportation solutions. Technological breakthroughs in emission control and fuel efficiency play a major role.
Key Players Shaping the Diesel Industry Market
- BP plc
- Reliance Industries Ltd
- Exxon Mobil Corporation
- Shell Plc
- PetroChina Company Limited
- NK Rosneft' PAO
- Chevron Corporation
- Saudi Arabian Oil Co
- Qatar Petroleum
- SK energy Co Ltd
Notable Milestones in Diesel Industry Sector
- May 2023: Petrobras' revised fuel pricing policy led to a nearly 13% reduction in gasoline and diesel prices in Brazil.
- February 2023: Europe's ban on new petrol and diesel cars from 2035 significantly impacts future demand.
In-Depth Diesel Industry Market Outlook
The diesel industry is expected to witness [mention overall trend - growth/decline] in the coming years. Opportunities lie in sustainable fuel development, technological innovations, and strategic partnerships. The long-term outlook is dependent on governmental policies and consumer preferences regarding environmental concerns and sustainable transportation solutions. The market presents both significant challenges and attractive opportunities for companies that adapt and innovate.
Diesel Industry Segmentation
-
1. End-User
- 1.1. Transporation
- 1.2. Industrial
- 1.3. Others
Diesel Industry Segmentation By Geography
-
1. North America
- 1.1. United States
- 1.2. Canada
- 1.3. Rest of North America
-
2. Europe
- 2.1. United Kingdom
- 2.2. Russia
- 2.3. Germany
- 2.4. Norway
- 2.5. Rest of Europe
-
3. Asia Pacific
- 3.1. China
- 3.2. India
- 3.3. Indonesia
- 3.4. Malaysia
- 3.5. Vietnam
-
4. Middle East and Africa
- 4.1. Saudi Arabia
- 4.2. United Arab Emirates
- 4.3. South Africa
- 4.4. Nigeria
- 4.5. Egypt
- 4.6. Rest of Middle East and Africa
-
5. South America
- 5.1. Argentina
- 5.2. Brazil
- 5.3. Venezuela
- 5.4. Rest of South America
Diesel Industry Regional Market Share
Geographic Coverage of Diesel Industry
Diesel Industry REPORT HIGHLIGHTS
| Aspects | Details |
|---|---|
| Study Period | 2020-2034 |
| Base Year | 2025 |
| Estimated Year | 2026 |
| Forecast Period | 2026-2034 |
| Historical Period | 2020-2025 |
| Growth Rate | CAGR of 3.50% from 2020-2034 |
| Segmentation |
|
Table of Contents
- 1. Introduction
- 1.1. Research Scope
- 1.2. Market Segmentation
- 1.3. Research Objective
- 1.4. Definitions and Assumptions
- 2. Executive Summary
- 2.1. Market Snapshot
- 3. Market Dynamics
- 3.1. Market Drivers
- 3.2. Market Restrains
- 3.3. Market Trends
- 3.4. Market Opportunities
- 4. Market Factor Analysis
- 4.1. Porters Five Forces
- 4.1.1. Bargaining Power of Suppliers
- 4.1.2. Bargaining Power of Buyers
- 4.1.3. Threat of New Entrants
- 4.1.4. Threat of Substitutes
- 4.1.5. Competitive Rivalry
- 4.2. PESTEL analysis
- 4.3. BCG Analysis
- 4.3.1. Stars (High Growth, High Market Share)
- 4.3.2. Cash Cows (Low Growth, High Market Share)
- 4.3.3. Question Mark (High Growth, Low Market Share)
- 4.3.4. Dogs (Low Growth, Low Market Share)
- 4.4. Ansoff Matrix Analysis
- 4.5. Supply Chain Analysis
- 4.6. Regulatory Landscape
- 4.7. Current Market Potential and Opportunity Assessment (TAM–SAM–SOM Framework)
- 4.8. IMR Analyst Note
- 4.1. Porters Five Forces
- 5. Market Analysis, Insights and Forecast 2021-2033
- 5.1. Market Analysis, Insights and Forecast - by End-User
- 5.1.1. Transporation
- 5.1.2. Industrial
- 5.1.3. Others
- 5.2. Market Analysis, Insights and Forecast - by Region
- 5.2.1. North America
- 5.2.2. Europe
- 5.2.3. Asia Pacific
- 5.2.4. Middle East and Africa
- 5.2.5. South America
- 5.1. Market Analysis, Insights and Forecast - by End-User
- 6. Global Diesel Industry Analysis, Insights and Forecast, 2021-2033
- 6.1. Market Analysis, Insights and Forecast - by End-User
- 6.1.1. Transporation
- 6.1.2. Industrial
- 6.1.3. Others
- 6.1. Market Analysis, Insights and Forecast - by End-User
- 7. North America Diesel Industry Analysis, Insights and Forecast, 2020-2032
- 7.1. Market Analysis, Insights and Forecast - by End-User
- 7.1.1. Transporation
- 7.1.2. Industrial
- 7.1.3. Others
- 7.1. Market Analysis, Insights and Forecast - by End-User
- 8. Europe Diesel Industry Analysis, Insights and Forecast, 2020-2032
- 8.1. Market Analysis, Insights and Forecast - by End-User
- 8.1.1. Transporation
- 8.1.2. Industrial
- 8.1.3. Others
- 8.1. Market Analysis, Insights and Forecast - by End-User
- 9. Asia Pacific Diesel Industry Analysis, Insights and Forecast, 2020-2032
- 9.1. Market Analysis, Insights and Forecast - by End-User
- 9.1.1. Transporation
- 9.1.2. Industrial
- 9.1.3. Others
- 9.1. Market Analysis, Insights and Forecast - by End-User
- 10. Middle East and Africa Diesel Industry Analysis, Insights and Forecast, 2020-2032
- 10.1. Market Analysis, Insights and Forecast - by End-User
- 10.1.1. Transporation
- 10.1.2. Industrial
- 10.1.3. Others
- 10.1. Market Analysis, Insights and Forecast - by End-User
- 11. South America Diesel Industry Analysis, Insights and Forecast, 2020-2032
- 11.1. Market Analysis, Insights and Forecast - by End-User
- 11.1.1. Transporation
- 11.1.2. Industrial
- 11.1.3. Others
- 11.1. Market Analysis, Insights and Forecast - by End-User
- 12. Competitive Analysis
- 12.1. Company Profiles
- 12.1.1 BP plc*List Not Exhaustive
- 12.1.1.1. Company Overview
- 12.1.1.2. Products
- 12.1.1.3. Company Financials
- 12.1.1.4. SWOT Analysis
- 12.1.2 Reliance Industries Ltd
- 12.1.2.1. Company Overview
- 12.1.2.2. Products
- 12.1.2.3. Company Financials
- 12.1.2.4. SWOT Analysis
- 12.1.3 Exxon Mobil Corporation
- 12.1.3.1. Company Overview
- 12.1.3.2. Products
- 12.1.3.3. Company Financials
- 12.1.3.4. SWOT Analysis
- 12.1.4 Shell Plc
- 12.1.4.1. Company Overview
- 12.1.4.2. Products
- 12.1.4.3. Company Financials
- 12.1.4.4. SWOT Analysis
- 12.1.5 PetroChina Company Limited
- 12.1.5.1. Company Overview
- 12.1.5.2. Products
- 12.1.5.3. Company Financials
- 12.1.5.4. SWOT Analysis
- 12.1.6 NK Rosneft' PAO
- 12.1.6.1. Company Overview
- 12.1.6.2. Products
- 12.1.6.3. Company Financials
- 12.1.6.4. SWOT Analysis
- 12.1.7 Chevron Corporation
- 12.1.7.1. Company Overview
- 12.1.7.2. Products
- 12.1.7.3. Company Financials
- 12.1.7.4. SWOT Analysis
- 12.1.8 Saudi Arabian Oil Co
- 12.1.8.1. Company Overview
- 12.1.8.2. Products
- 12.1.8.3. Company Financials
- 12.1.8.4. SWOT Analysis
- 12.1.9 Qatar Petroleum
- 12.1.9.1. Company Overview
- 12.1.9.2. Products
- 12.1.9.3. Company Financials
- 12.1.9.4. SWOT Analysis
- 12.1.10 SK energy Co Ltd
- 12.1.10.1. Company Overview
- 12.1.10.2. Products
- 12.1.10.3. Company Financials
- 12.1.10.4. SWOT Analysis
- 12.1.1 BP plc*List Not Exhaustive
- 12.2. Market Entropy
- 12.2.1 Company's Key Areas Served
- 12.2.2 Recent Developments
- 12.3. Company Market Share Analysis 2025
- 12.3.1 Top 5 Companies Market Share Analysis
- 12.3.2 Top 3 Companies Market Share Analysis
- 12.4. List of Potential Customers
- 13. Research Methodology
List of Figures
- Figure 1: Global Diesel Industry Revenue Breakdown (Million, %) by Region 2025 & 2033
- Figure 2: Global Diesel Industry Volume Breakdown (Litre, %) by Region 2025 & 2033
- Figure 3: North America Diesel Industry Revenue (Million), by End-User 2025 & 2033
- Figure 4: North America Diesel Industry Volume (Litre), by End-User 2025 & 2033
- Figure 5: North America Diesel Industry Revenue Share (%), by End-User 2025 & 2033
- Figure 6: North America Diesel Industry Volume Share (%), by End-User 2025 & 2033
- Figure 7: North America Diesel Industry Revenue (Million), by Country 2025 & 2033
- Figure 8: North America Diesel Industry Volume (Litre), by Country 2025 & 2033
- Figure 9: North America Diesel Industry Revenue Share (%), by Country 2025 & 2033
- Figure 10: North America Diesel Industry Volume Share (%), by Country 2025 & 2033
- Figure 11: Europe Diesel Industry Revenue (Million), by End-User 2025 & 2033
- Figure 12: Europe Diesel Industry Volume (Litre), by End-User 2025 & 2033
- Figure 13: Europe Diesel Industry Revenue Share (%), by End-User 2025 & 2033
- Figure 14: Europe Diesel Industry Volume Share (%), by End-User 2025 & 2033
- Figure 15: Europe Diesel Industry Revenue (Million), by Country 2025 & 2033
- Figure 16: Europe Diesel Industry Volume (Litre), by Country 2025 & 2033
- Figure 17: Europe Diesel Industry Revenue Share (%), by Country 2025 & 2033
- Figure 18: Europe Diesel Industry Volume Share (%), by Country 2025 & 2033
- Figure 19: Asia Pacific Diesel Industry Revenue (Million), by End-User 2025 & 2033
- Figure 20: Asia Pacific Diesel Industry Volume (Litre), by End-User 2025 & 2033
- Figure 21: Asia Pacific Diesel Industry Revenue Share (%), by End-User 2025 & 2033
- Figure 22: Asia Pacific Diesel Industry Volume Share (%), by End-User 2025 & 2033
- Figure 23: Asia Pacific Diesel Industry Revenue (Million), by Country 2025 & 2033
- Figure 24: Asia Pacific Diesel Industry Volume (Litre), by Country 2025 & 2033
- Figure 25: Asia Pacific Diesel Industry Revenue Share (%), by Country 2025 & 2033
- Figure 26: Asia Pacific Diesel Industry Volume Share (%), by Country 2025 & 2033
- Figure 27: Middle East and Africa Diesel Industry Revenue (Million), by End-User 2025 & 2033
- Figure 28: Middle East and Africa Diesel Industry Volume (Litre), by End-User 2025 & 2033
- Figure 29: Middle East and Africa Diesel Industry Revenue Share (%), by End-User 2025 & 2033
- Figure 30: Middle East and Africa Diesel Industry Volume Share (%), by End-User 2025 & 2033
- Figure 31: Middle East and Africa Diesel Industry Revenue (Million), by Country 2025 & 2033
- Figure 32: Middle East and Africa Diesel Industry Volume (Litre), by Country 2025 & 2033
- Figure 33: Middle East and Africa Diesel Industry Revenue Share (%), by Country 2025 & 2033
- Figure 34: Middle East and Africa Diesel Industry Volume Share (%), by Country 2025 & 2033
- Figure 35: South America Diesel Industry Revenue (Million), by End-User 2025 & 2033
- Figure 36: South America Diesel Industry Volume (Litre), by End-User 2025 & 2033
- Figure 37: South America Diesel Industry Revenue Share (%), by End-User 2025 & 2033
- Figure 38: South America Diesel Industry Volume Share (%), by End-User 2025 & 2033
- Figure 39: South America Diesel Industry Revenue (Million), by Country 2025 & 2033
- Figure 40: South America Diesel Industry Volume (Litre), by Country 2025 & 2033
- Figure 41: South America Diesel Industry Revenue Share (%), by Country 2025 & 2033
- Figure 42: South America Diesel Industry Volume Share (%), by Country 2025 & 2033
List of Tables
- Table 1: Global Diesel Industry Revenue Million Forecast, by End-User 2020 & 2033
- Table 2: Global Diesel Industry Volume Litre Forecast, by End-User 2020 & 2033
- Table 3: Global Diesel Industry Revenue Million Forecast, by Region 2020 & 2033
- Table 4: Global Diesel Industry Volume Litre Forecast, by Region 2020 & 2033
- Table 5: Global Diesel Industry Revenue Million Forecast, by End-User 2020 & 2033
- Table 6: Global Diesel Industry Volume Litre Forecast, by End-User 2020 & 2033
- Table 7: Global Diesel Industry Revenue Million Forecast, by Country 2020 & 2033
- Table 8: Global Diesel Industry Volume Litre Forecast, by Country 2020 & 2033
- Table 9: United States Diesel Industry Revenue (Million) Forecast, by Application 2020 & 2033
- Table 10: United States Diesel Industry Volume (Litre) Forecast, by Application 2020 & 2033
- Table 11: Canada Diesel Industry Revenue (Million) Forecast, by Application 2020 & 2033
- Table 12: Canada Diesel Industry Volume (Litre) Forecast, by Application 2020 & 2033
- Table 13: Rest of North America Diesel Industry Revenue (Million) Forecast, by Application 2020 & 2033
- Table 14: Rest of North America Diesel Industry Volume (Litre) Forecast, by Application 2020 & 2033
- Table 15: Global Diesel Industry Revenue Million Forecast, by End-User 2020 & 2033
- Table 16: Global Diesel Industry Volume Litre Forecast, by End-User 2020 & 2033
- Table 17: Global Diesel Industry Revenue Million Forecast, by Country 2020 & 2033
- Table 18: Global Diesel Industry Volume Litre Forecast, by Country 2020 & 2033
- Table 19: United Kingdom Diesel Industry Revenue (Million) Forecast, by Application 2020 & 2033
- Table 20: United Kingdom Diesel Industry Volume (Litre) Forecast, by Application 2020 & 2033
- Table 21: Russia Diesel Industry Revenue (Million) Forecast, by Application 2020 & 2033
- Table 22: Russia Diesel Industry Volume (Litre) Forecast, by Application 2020 & 2033
- Table 23: Germany Diesel Industry Revenue (Million) Forecast, by Application 2020 & 2033
- Table 24: Germany Diesel Industry Volume (Litre) Forecast, by Application 2020 & 2033
- Table 25: Norway Diesel Industry Revenue (Million) Forecast, by Application 2020 & 2033
- Table 26: Norway Diesel Industry Volume (Litre) Forecast, by Application 2020 & 2033
- Table 27: Rest of Europe Diesel Industry Revenue (Million) Forecast, by Application 2020 & 2033
- Table 28: Rest of Europe Diesel Industry Volume (Litre) Forecast, by Application 2020 & 2033
- Table 29: Global Diesel Industry Revenue Million Forecast, by End-User 2020 & 2033
- Table 30: Global Diesel Industry Volume Litre Forecast, by End-User 2020 & 2033
- Table 31: Global Diesel Industry Revenue Million Forecast, by Country 2020 & 2033
- Table 32: Global Diesel Industry Volume Litre Forecast, by Country 2020 & 2033
- Table 33: China Diesel Industry Revenue (Million) Forecast, by Application 2020 & 2033
- Table 34: China Diesel Industry Volume (Litre) Forecast, by Application 2020 & 2033
- Table 35: India Diesel Industry Revenue (Million) Forecast, by Application 2020 & 2033
- Table 36: India Diesel Industry Volume (Litre) Forecast, by Application 2020 & 2033
- Table 37: Indonesia Diesel Industry Revenue (Million) Forecast, by Application 2020 & 2033
- Table 38: Indonesia Diesel Industry Volume (Litre) Forecast, by Application 2020 & 2033
- Table 39: Malaysia Diesel Industry Revenue (Million) Forecast, by Application 2020 & 2033
- Table 40: Malaysia Diesel Industry Volume (Litre) Forecast, by Application 2020 & 2033
- Table 41: Vietnam Diesel Industry Revenue (Million) Forecast, by Application 2020 & 2033
- Table 42: Vietnam Diesel Industry Volume (Litre) Forecast, by Application 2020 & 2033
- Table 43: Global Diesel Industry Revenue Million Forecast, by End-User 2020 & 2033
- Table 44: Global Diesel Industry Volume Litre Forecast, by End-User 2020 & 2033
- Table 45: Global Diesel Industry Revenue Million Forecast, by Country 2020 & 2033
- Table 46: Global Diesel Industry Volume Litre Forecast, by Country 2020 & 2033
- Table 47: Saudi Arabia Diesel Industry Revenue (Million) Forecast, by Application 2020 & 2033
- Table 48: Saudi Arabia Diesel Industry Volume (Litre) Forecast, by Application 2020 & 2033
- Table 49: United Arab Emirates Diesel Industry Revenue (Million) Forecast, by Application 2020 & 2033
- Table 50: United Arab Emirates Diesel Industry Volume (Litre) Forecast, by Application 2020 & 2033
- Table 51: South Africa Diesel Industry Revenue (Million) Forecast, by Application 2020 & 2033
- Table 52: South Africa Diesel Industry Volume (Litre) Forecast, by Application 2020 & 2033
- Table 53: Nigeria Diesel Industry Revenue (Million) Forecast, by Application 2020 & 2033
- Table 54: Nigeria Diesel Industry Volume (Litre) Forecast, by Application 2020 & 2033
- Table 55: Egypt Diesel Industry Revenue (Million) Forecast, by Application 2020 & 2033
- Table 56: Egypt Diesel Industry Volume (Litre) Forecast, by Application 2020 & 2033
- Table 57: Rest of Middle East and Africa Diesel Industry Revenue (Million) Forecast, by Application 2020 & 2033
- Table 58: Rest of Middle East and Africa Diesel Industry Volume (Litre) Forecast, by Application 2020 & 2033
- Table 59: Global Diesel Industry Revenue Million Forecast, by End-User 2020 & 2033
- Table 60: Global Diesel Industry Volume Litre Forecast, by End-User 2020 & 2033
- Table 61: Global Diesel Industry Revenue Million Forecast, by Country 2020 & 2033
- Table 62: Global Diesel Industry Volume Litre Forecast, by Country 2020 & 2033
- Table 63: Argentina Diesel Industry Revenue (Million) Forecast, by Application 2020 & 2033
- Table 64: Argentina Diesel Industry Volume (Litre) Forecast, by Application 2020 & 2033
- Table 65: Brazil Diesel Industry Revenue (Million) Forecast, by Application 2020 & 2033
- Table 66: Brazil Diesel Industry Volume (Litre) Forecast, by Application 2020 & 2033
- Table 67: Venezuela Diesel Industry Revenue (Million) Forecast, by Application 2020 & 2033
- Table 68: Venezuela Diesel Industry Volume (Litre) Forecast, by Application 2020 & 2033
- Table 69: Rest of South America Diesel Industry Revenue (Million) Forecast, by Application 2020 & 2033
- Table 70: Rest of South America Diesel Industry Volume (Litre) Forecast, by Application 2020 & 2033
Frequently Asked Questions
1. What is the projected Compound Annual Growth Rate (CAGR) of the Diesel Industry?
The projected CAGR is approximately 3.50%.
2. Which companies are prominent players in the Diesel Industry?
Key companies in the market include BP plc*List Not Exhaustive, Reliance Industries Ltd, Exxon Mobil Corporation, Shell Plc, PetroChina Company Limited, NK Rosneft' PAO, Chevron Corporation, Saudi Arabian Oil Co, Qatar Petroleum, SK energy Co Ltd.
3. What are the main segments of the Diesel Industry?
The market segments include End-User.
4. Can you provide details about the market size?
The market size is estimated to be USD 244.26 Million as of 2022.
5. What are some drivers contributing to market growth?
Increasing Demand from Industrial Applications4.; Growing Infrastructure Across the World.
6. What are the notable trends driving market growth?
Transportation Segment is to Expected to Dominate in the Market.
7. Are there any restraints impacting market growth?
A Rise in Concerns Related to Carbon Emissions and A Shift Towards Electric Vehicles and Renewable Sources of Energy.
8. Can you provide examples of recent developments in the market?
May 2023: Petrobras, the state oil company of Brazil, gave the green light to a revised fuel pricing policy that will result in significant cost reductions for drivers. As per the newly approved strategy, gasoline, and diesel prices will experience a considerable decline, with a nearly 13% reduction.
9. What pricing options are available for accessing the report?
Pricing options include single-user, multi-user, and enterprise licenses priced at USD 4750, USD 5250, and USD 8750 respectively.
10. Is the market size provided in terms of value or volume?
The market size is provided in terms of value, measured in Million and volume, measured in Litre.
11. Are there any specific market keywords associated with the report?
Yes, the market keyword associated with the report is "Diesel Industry," which aids in identifying and referencing the specific market segment covered.
12. How do I determine which pricing option suits my needs best?
The pricing options vary based on user requirements and access needs. Individual users may opt for single-user licenses, while businesses requiring broader access may choose multi-user or enterprise licenses for cost-effective access to the report.
13. Are there any additional resources or data provided in the Diesel Industry report?
While the report offers comprehensive insights, it's advisable to review the specific contents or supplementary materials provided to ascertain if additional resources or data are available.
14. How can I stay updated on further developments or reports in the Diesel Industry?
To stay informed about further developments, trends, and reports in the Diesel Industry, consider subscribing to industry newsletters, following relevant companies and organizations, or regularly checking reputable industry news sources and publications.
Methodology
Step 1 - Identification of Relevant Samples Size from Population Database


Step 2 - Approaches for Defining Global Market Size (Value, Volume* & Price*)

Note*: In applicable scenarios
Step 3 - Data Sources
Primary Research
- Web Analytics
- Survey Reports
- Research Institute
- Latest Research Reports
- Opinion Leaders
Secondary Research
- Annual Reports
- White Paper
- Latest Press Release
- Industry Association
- Paid Database
- Investor Presentations

Step 4 - Data Triangulation
Involves using different sources of information in order to increase the validity of a study
These sources are likely to be stakeholders in a program - participants, other researchers, program staff, other community members, and so on.
Then we put all data in single framework & apply various statistical tools to find out the dynamic on the market.
During the analysis stage, feedback from the stakeholder groups would be compared to determine areas of agreement as well as areas of divergence