

Key Insights
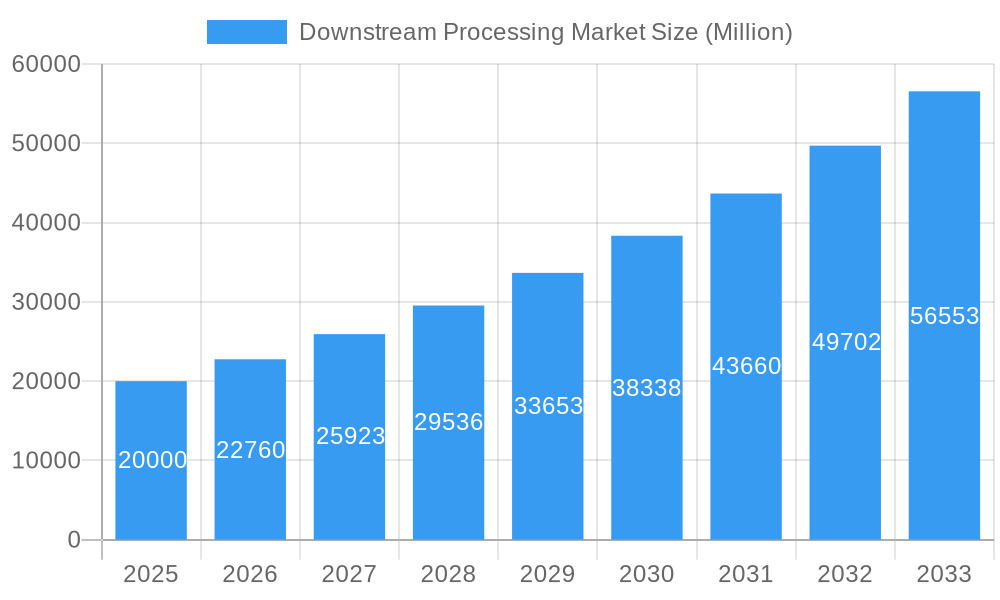
The global downstream processing market, projected at $34.3 billion in 2025, is poised for significant expansion, with an anticipated compound annual growth rate (CAGR) of 11.3% from 2025 to 2033. This growth is primarily driven by the burgeoning biopharmaceutical sector, fueled by the escalating demand for biologics, including monoclonal antibodies, vaccines, and insulin. Innovations in purification technologies, such as chromatography and filtration, are enhancing yield and product purity, further stimulating market expansion. The increasing global prevalence of chronic diseases also contributes to this growth, necessitating greater production of therapeutic proteins. Moreover, ongoing advancements in downstream processing technologies, encompassing automated systems and single-use solutions, are boosting efficiency and reducing costs, making these processes more accessible for manufacturers.
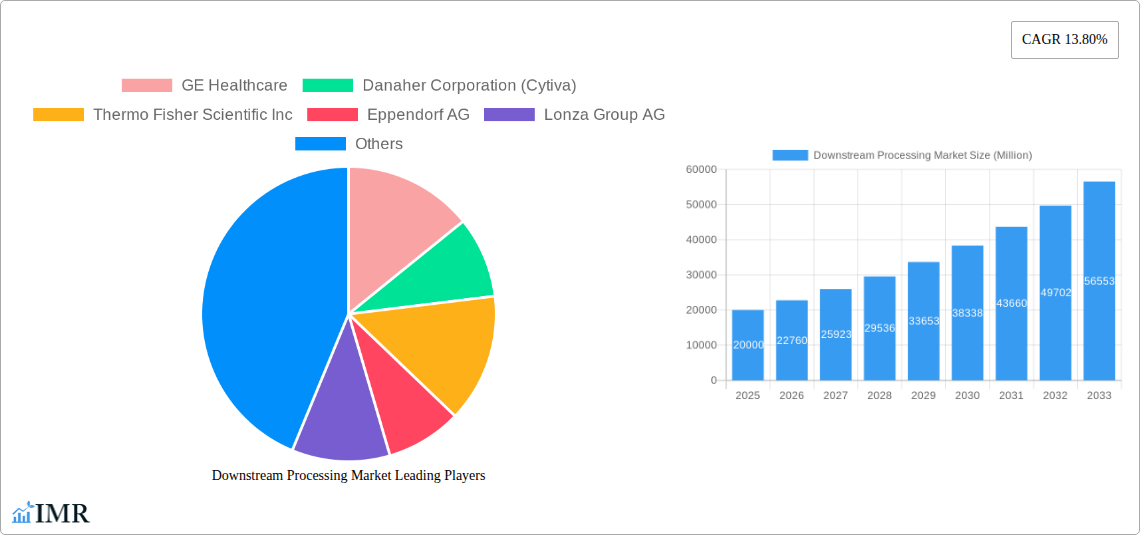
Downstream Processing Market Market Size (In Billion)
Despite these growth drivers, the market encounters certain obstacles. Substantial capital investment for advanced equipment and stringent regulatory compliances for biopharmaceutical products present potential restraints. The inherent complexity of downstream processes, particularly for large-scale manufacturing, also poses operational challenges. Nevertheless, the sustained expansion of the biopharmaceutical industry, combined with technological innovations designed to mitigate these challenges, is expected to drive robust market growth throughout the forecast period. Market segmentation across techniques, products, and applications offers strategic opportunities for specialized entities, with notable growth expected in antibody production and advanced purification technologies. Key market players, including GE Healthcare, Danaher Corporation (Cytiva), and Thermo Fisher Scientific, are leading innovation and market consolidation. Regional analysis highlights substantial growth prospects worldwide. While North America and Europe currently dominate market share, the Asia-Pacific region is projected to experience the most rapid growth, propelled by expanding manufacturing capacities and increasing healthcare expenditures in emerging economies.
Downstream Processing Market Company Market Share
Downstream Processing Market: A Comprehensive Report (2019-2033)
This comprehensive report provides an in-depth analysis of the Downstream Processing market, encompassing market dynamics, growth trends, regional analysis, product landscape, and key players. With a study period spanning 2019-2033, a base year of 2025, and a forecast period of 2025-2033, this report is an essential resource for industry professionals, investors, and strategists seeking to understand and capitalize on the opportunities within this rapidly evolving sector. The report segments the market by technique (Purification Techniques, Solid-Liquid Separation, Clarification/Concentration), product (Chromatography Columns and Resins, Filters, Evaporators, Centrifuges, Other Products), and application (Antibodies Production, Vaccines Production, Insulin Production, Other Applications). The total market size in 2025 is estimated at XX Million.
Downstream Processing Market Dynamics & Structure
The downstream processing market is characterized by moderate concentration, with several major players holding significant market share. Technological innovation, particularly in automation and process analytical technologies (PAT), is a key driver. Stringent regulatory frameworks, including those governing biopharmaceutical manufacturing, significantly influence market operations. Competitive product substitutes, such as alternative purification methods, pose a challenge. The end-user demographic largely comprises pharmaceutical and biotechnology companies, with a growing presence of contract development and manufacturing organizations (CDMOs). Mergers and acquisitions (M&A) activity is significant, reflecting consolidation and expansion strategies within the industry.
- Market Concentration: The top 5 players hold approximately XX% of the market share in 2025.
- Technological Innovation: Advancements in automation, single-use technologies, and continuous processing are driving market growth.
- Regulatory Landscape: Compliance with GMP (Good Manufacturing Practices) and other regulatory standards is crucial.
- M&A Activity: An average of XX M&A deals per year were observed during the historical period (2019-2024). This reflects industry consolidation.
- Innovation Barriers: High R&D costs and stringent regulatory approval processes present challenges to innovation.
Downstream Processing Market Growth Trends & Insights
The downstream processing market experienced significant growth during the historical period (2019-2024), driven by factors including the increasing demand for biologics, advancements in process technologies, and the growing outsourcing of downstream processing activities to CDMOs. The market is projected to maintain a healthy CAGR of XX% during the forecast period (2025-2033), reaching an estimated value of XX Million by 2033. Adoption rates of advanced technologies, such as continuous processing and single-use systems, are steadily increasing, driven by their efficiency and cost-effectiveness benefits. Consumer behavior shifts towards personalized medicine and advanced therapies further fuel market expansion. Technological disruptions, like the integration of AI and machine learning, are expected to significantly impact market dynamics in the coming years. Market penetration of single-use technologies is projected to reach XX% by 2033.
Dominant Regions, Countries, or Segments in Downstream Processing Market
North America currently holds the largest market share, driven by robust pharmaceutical and biotechnology sectors and significant investments in R&D. Europe follows closely, also benefiting from a strong presence of biopharmaceutical companies. However, Asia-Pacific is expected to demonstrate the highest growth rate during the forecast period, fueled by rising healthcare expenditure, growing biopharmaceutical production, and supportive government initiatives.
- By Technique: Purification techniques dominate the market, followed by solid-liquid separation and clarification/concentration.
- By Product: Chromatography columns and resins constitute the largest product segment due to their widespread use in biopharmaceutical purification.
- By Application: Antibodies production represents the largest application segment, driven by the increasing demand for monoclonal antibodies in various therapeutic areas.
- Key Drivers: Strong R&D investments in biopharmaceuticals, increasing demand for biologics, and government support for the bioprocessing industry are major drivers.
Downstream Processing Market Product Landscape
The downstream processing product landscape is characterized by continuous innovation, with a focus on enhancing efficiency, scalability, and cost-effectiveness. Recent advancements include the development of highly selective chromatography resins, automated purification systems, and single-use technologies. These innovations offer superior performance metrics, such as increased throughput, improved purity, and reduced processing time. Unique selling propositions often center around improved efficiency, reduced operational costs, and enhanced product quality.
Key Drivers, Barriers & Challenges in Downstream Processing Market
Key Drivers: The rising demand for biologics, particularly monoclonal antibodies and vaccines, is a primary driver. Technological advancements, such as continuous processing and single-use systems, are boosting efficiency and reducing costs. Favorable regulatory environments and increased investments in R&D further contribute to market growth.
Key Barriers & Challenges: Stringent regulatory requirements and high compliance costs pose significant hurdles. The high capital investment required for advanced technologies limits adoption by smaller companies. Supply chain disruptions and fluctuations in raw material prices can impact production costs. Intense competition and the entry of new players create pressure on margins. It is estimated that regulatory hurdles delay market entry by an average of XX months.
Emerging Opportunities in Downstream Processing Market
Emerging opportunities lie in the development of novel purification technologies for next-generation biotherapeutics, such as cell and gene therapies. The increasing adoption of continuous manufacturing processes offers significant potential for cost reduction and scalability. Expanding into emerging markets and leveraging digital technologies, like process analytics and AI, offer further growth avenues. Untapped markets in developing countries present significant potential.
Growth Accelerators in the Downstream Processing Market Industry
Technological advancements in automation and process analytics, coupled with strategic partnerships and collaborations between industry players and technology providers, are key growth accelerators. Expanding into emerging markets and developing tailored solutions for specific therapeutic areas, such as personalized medicine, create significant opportunities. Continuous innovation and the development of more efficient and cost-effective downstream processing technologies will be crucial for long-term market growth.
Key Players Shaping the Downstream Processing Market Market
Notable Milestones in Downstream Processing Market Sector
- June 2022: Merck and Agilent Technologies collaborate to advance process analytical technologies (PAT) in downstream processing.
- February 2022: Sartorius Stedim Biotech acquires Novasep's chromatography division, expanding its capabilities in biomolecule purification.
In-Depth Downstream Processing Market Market Outlook
The downstream processing market is poised for continued growth, driven by several factors, including the rising demand for biologics, technological advancements, and strategic collaborations. The market will be shaped by the ongoing adoption of advanced technologies like continuous processing and automation, leading to increased efficiency and reduced costs. The focus will be on developing innovative solutions tailored to emerging therapeutic areas and personalized medicine, unlocking significant opportunities for growth. Strategic partnerships and M&A activity will further consolidate the market landscape and foster innovation.
Downstream Processing Market Segmentation
-
1. Technique
- 1.1. Purification Techniques
- 1.2. Solid-Liquid Separation
- 1.3. Clarification/Concentration
-
2. Product
- 2.1. Chromatography Columns and Resins
- 2.2. Filters
- 2.3. Evaporators
- 2.4. Centrifuges
- 2.5. Other Products
-
3. Application
- 3.1. Antibodies Production
- 3.2. Vaccines Production
- 3.3. Insulin Production
- 3.4. Other Applications
Downstream Processing Market Segmentation By Geography
-
1. North America
- 1.1. United States
- 1.2. Canada
- 1.3. Mexico
-
2. Europe
- 2.1. Germany
- 2.2. United Kingdom
- 2.3. France
- 2.4. Italy
- 2.5. Spain
- 2.6. Rest of Europe
-
3. Asia Pacific
- 3.1. China
- 3.2. Japan
- 3.3. India
- 3.4. Australia
- 3.5. South Korea
- 3.6. Rest of Asia Pacific
-
4. Middle East and Africa
- 4.1. GCC
- 4.2. South Africa
- 4.3. Rest of Middle East and Africa
-
5. South America
- 5.1. Brazil
- 5.2. Argentina
- 5.3. Rest of South America
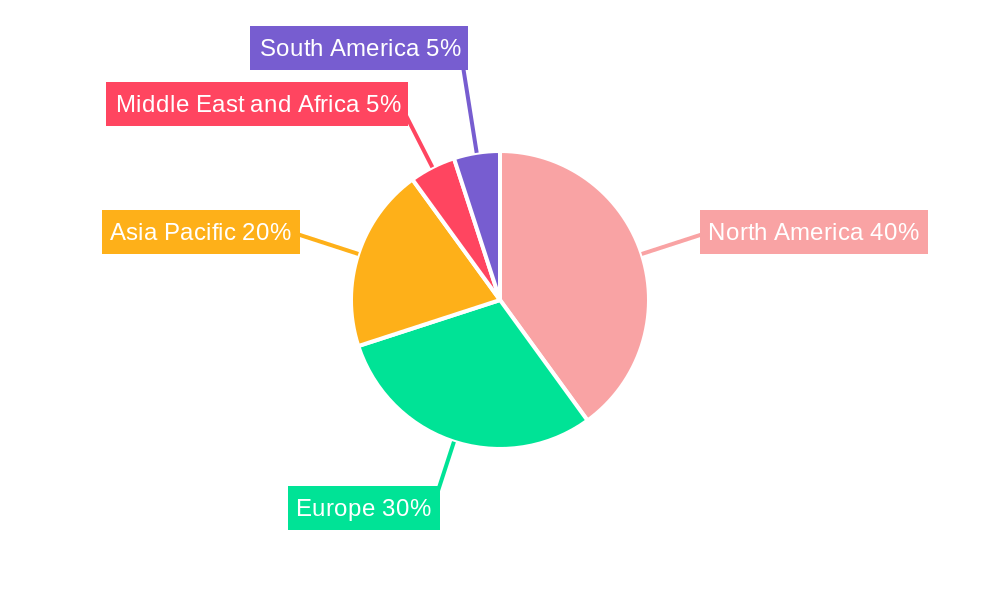
Downstream Processing Market Regional Market Share
Geographic Coverage of Downstream Processing Market
Downstream Processing Market REPORT HIGHLIGHTS
| Aspects | Details |
|---|---|
| Study Period | 2020-2034 |
| Base Year | 2025 |
| Estimated Year | 2026 |
| Forecast Period | 2026-2034 |
| Historical Period | 2020-2025 |
| Growth Rate | CAGR of 11.3% from 2020-2034 |
| Segmentation |
|
Table of Contents
- 1. Introduction
- 1.1. Research Scope
- 1.2. Market Segmentation
- 1.3. Research Objective
- 1.4. Definitions and Assumptions
- 2. Executive Summary
- 2.1. Market Snapshot
- 3. Market Dynamics
- 3.1. Market Drivers
- 3.2. Market Restrains
- 3.3. Market Trends
- 3.4. Market Opportunities
- 4. Market Factor Analysis
- 4.1. Porters Five Forces
- 4.1.1. Bargaining Power of Suppliers
- 4.1.2. Bargaining Power of Buyers
- 4.1.3. Threat of New Entrants
- 4.1.4. Threat of Substitutes
- 4.1.5. Competitive Rivalry
- 4.2. PESTEL analysis
- 4.3. BCG Analysis
- 4.3.1. Stars (High Growth, High Market Share)
- 4.3.2. Cash Cows (Low Growth, High Market Share)
- 4.3.3. Question Mark (High Growth, Low Market Share)
- 4.3.4. Dogs (Low Growth, Low Market Share)
- 4.4. Ansoff Matrix Analysis
- 4.5. Supply Chain Analysis
- 4.6. Regulatory Landscape
- 4.7. Current Market Potential and Opportunity Assessment (TAM–SAM–SOM Framework)
- 4.8. IMR Analyst Note
- 4.1. Porters Five Forces
- 5. Market Analysis, Insights and Forecast 2021-2033
- 5.1. Market Analysis, Insights and Forecast - by Technique
- 5.1.1. Purification Techniques
- 5.1.2. Solid-Liquid Separation
- 5.1.3. Clarification/Concentration
- 5.2. Market Analysis, Insights and Forecast - by Product
- 5.2.1. Chromatography Columns and Resins
- 5.2.2. Filters
- 5.2.3. Evaporators
- 5.2.4. Centrifuges
- 5.2.5. Other Products
- 5.3. Market Analysis, Insights and Forecast - by Application
- 5.3.1. Antibodies Production
- 5.3.2. Vaccines Production
- 5.3.3. Insulin Production
- 5.3.4. Other Applications
- 5.4. Market Analysis, Insights and Forecast - by Region
- 5.4.1. North America
- 5.4.2. Europe
- 5.4.3. Asia Pacific
- 5.4.4. Middle East and Africa
- 5.4.5. South America
- 5.1. Market Analysis, Insights and Forecast - by Technique
- 6. Global Downstream Processing Market Analysis, Insights and Forecast, 2021-2033
- 6.1. Market Analysis, Insights and Forecast - by Technique
- 6.1.1. Purification Techniques
- 6.1.2. Solid-Liquid Separation
- 6.1.3. Clarification/Concentration
- 6.2. Market Analysis, Insights and Forecast - by Product
- 6.2.1. Chromatography Columns and Resins
- 6.2.2. Filters
- 6.2.3. Evaporators
- 6.2.4. Centrifuges
- 6.2.5. Other Products
- 6.3. Market Analysis, Insights and Forecast - by Application
- 6.3.1. Antibodies Production
- 6.3.2. Vaccines Production
- 6.3.3. Insulin Production
- 6.3.4. Other Applications
- 6.1. Market Analysis, Insights and Forecast - by Technique
- 7. North America Downstream Processing Market Analysis, Insights and Forecast, 2020-2032
- 7.1. Market Analysis, Insights and Forecast - by Technique
- 7.1.1. Purification Techniques
- 7.1.2. Solid-Liquid Separation
- 7.1.3. Clarification/Concentration
- 7.2. Market Analysis, Insights and Forecast - by Product
- 7.2.1. Chromatography Columns and Resins
- 7.2.2. Filters
- 7.2.3. Evaporators
- 7.2.4. Centrifuges
- 7.2.5. Other Products
- 7.3. Market Analysis, Insights and Forecast - by Application
- 7.3.1. Antibodies Production
- 7.3.2. Vaccines Production
- 7.3.3. Insulin Production
- 7.3.4. Other Applications
- 7.1. Market Analysis, Insights and Forecast - by Technique
- 8. Europe Downstream Processing Market Analysis, Insights and Forecast, 2020-2032
- 8.1. Market Analysis, Insights and Forecast - by Technique
- 8.1.1. Purification Techniques
- 8.1.2. Solid-Liquid Separation
- 8.1.3. Clarification/Concentration
- 8.2. Market Analysis, Insights and Forecast - by Product
- 8.2.1. Chromatography Columns and Resins
- 8.2.2. Filters
- 8.2.3. Evaporators
- 8.2.4. Centrifuges
- 8.2.5. Other Products
- 8.3. Market Analysis, Insights and Forecast - by Application
- 8.3.1. Antibodies Production
- 8.3.2. Vaccines Production
- 8.3.3. Insulin Production
- 8.3.4. Other Applications
- 8.1. Market Analysis, Insights and Forecast - by Technique
- 9. Asia Pacific Downstream Processing Market Analysis, Insights and Forecast, 2020-2032
- 9.1. Market Analysis, Insights and Forecast - by Technique
- 9.1.1. Purification Techniques
- 9.1.2. Solid-Liquid Separation
- 9.1.3. Clarification/Concentration
- 9.2. Market Analysis, Insights and Forecast - by Product
- 9.2.1. Chromatography Columns and Resins
- 9.2.2. Filters
- 9.2.3. Evaporators
- 9.2.4. Centrifuges
- 9.2.5. Other Products
- 9.3. Market Analysis, Insights and Forecast - by Application
- 9.3.1. Antibodies Production
- 9.3.2. Vaccines Production
- 9.3.3. Insulin Production
- 9.3.4. Other Applications
- 9.1. Market Analysis, Insights and Forecast - by Technique
- 10. Middle East and Africa Downstream Processing Market Analysis, Insights and Forecast, 2020-2032
- 10.1. Market Analysis, Insights and Forecast - by Technique
- 10.1.1. Purification Techniques
- 10.1.2. Solid-Liquid Separation
- 10.1.3. Clarification/Concentration
- 10.2. Market Analysis, Insights and Forecast - by Product
- 10.2.1. Chromatography Columns and Resins
- 10.2.2. Filters
- 10.2.3. Evaporators
- 10.2.4. Centrifuges
- 10.2.5. Other Products
- 10.3. Market Analysis, Insights and Forecast - by Application
- 10.3.1. Antibodies Production
- 10.3.2. Vaccines Production
- 10.3.3. Insulin Production
- 10.3.4. Other Applications
- 10.1. Market Analysis, Insights and Forecast - by Technique
- 11. South America Downstream Processing Market Analysis, Insights and Forecast, 2020-2032
- 11.1. Market Analysis, Insights and Forecast - by Technique
- 11.1.1. Purification Techniques
- 11.1.2. Solid-Liquid Separation
- 11.1.3. Clarification/Concentration
- 11.2. Market Analysis, Insights and Forecast - by Product
- 11.2.1. Chromatography Columns and Resins
- 11.2.2. Filters
- 11.2.3. Evaporators
- 11.2.4. Centrifuges
- 11.2.5. Other Products
- 11.3. Market Analysis, Insights and Forecast - by Application
- 11.3.1. Antibodies Production
- 11.3.2. Vaccines Production
- 11.3.3. Insulin Production
- 11.3.4. Other Applications
- 11.1. Market Analysis, Insights and Forecast - by Technique
- 12. Competitive Analysis
- 12.1. Company Profiles
- 12.1.1 GE Healthcare
- 12.1.1.1. Company Overview
- 12.1.1.2. Products
- 12.1.1.3. Company Financials
- 12.1.1.4. SWOT Analysis
- 12.1.2 Danaher Corporation (Cytiva)
- 12.1.2.1. Company Overview
- 12.1.2.2. Products
- 12.1.2.3. Company Financials
- 12.1.2.4. SWOT Analysis
- 12.1.3 Thermo Fisher Scientific Inc
- 12.1.3.1. Company Overview
- 12.1.3.2. Products
- 12.1.3.3. Company Financials
- 12.1.3.4. SWOT Analysis
- 12.1.4 Eppendorf AG
- 12.1.4.1. Company Overview
- 12.1.4.2. Products
- 12.1.4.3. Company Financials
- 12.1.4.4. SWOT Analysis
- 12.1.5 Lonza Group AG
- 12.1.5.1. Company Overview
- 12.1.5.2. Products
- 12.1.5.3. Company Financials
- 12.1.5.4. SWOT Analysis
- 12.1.6 3M Company
- 12.1.6.1. Company Overview
- 12.1.6.2. Products
- 12.1.6.3. Company Financials
- 12.1.6.4. SWOT Analysis
- 12.1.7 Repligen Corporation
- 12.1.7.1. Company Overview
- 12.1.7.2. Products
- 12.1.7.3. Company Financials
- 12.1.7.4. SWOT Analysis
- 12.1.8 Sartorius Stedim Biotech S A
- 12.1.8.1. Company Overview
- 12.1.8.2. Products
- 12.1.8.3. Company Financials
- 12.1.8.4. SWOT Analysis
- 12.1.9 Merck KGaA (Merck Millipore)
- 12.1.9.1. Company Overview
- 12.1.9.2. Products
- 12.1.9.3. Company Financials
- 12.1.9.4. SWOT Analysis
- 12.1.1 GE Healthcare
- 12.2. Market Entropy
- 12.2.1 Company's Key Areas Served
- 12.2.2 Recent Developments
- 12.3. Company Market Share Analysis 2025
- 12.3.1 Top 5 Companies Market Share Analysis
- 12.3.2 Top 3 Companies Market Share Analysis
- 12.4. List of Potential Customers
- 13. Research Methodology
List of Figures
- Figure 1: Global Downstream Processing Market Revenue Breakdown (billion, %) by Region 2025 & 2033
- Figure 2: Global Downstream Processing Market Volume Breakdown (K Unit, %) by Region 2025 & 2033
- Figure 3: North America Downstream Processing Market Revenue (billion), by Technique 2025 & 2033
- Figure 4: North America Downstream Processing Market Volume (K Unit), by Technique 2025 & 2033
- Figure 5: North America Downstream Processing Market Revenue Share (%), by Technique 2025 & 2033
- Figure 6: North America Downstream Processing Market Volume Share (%), by Technique 2025 & 2033
- Figure 7: North America Downstream Processing Market Revenue (billion), by Product 2025 & 2033
- Figure 8: North America Downstream Processing Market Volume (K Unit), by Product 2025 & 2033
- Figure 9: North America Downstream Processing Market Revenue Share (%), by Product 2025 & 2033
- Figure 10: North America Downstream Processing Market Volume Share (%), by Product 2025 & 2033
- Figure 11: North America Downstream Processing Market Revenue (billion), by Application 2025 & 2033
- Figure 12: North America Downstream Processing Market Volume (K Unit), by Application 2025 & 2033
- Figure 13: North America Downstream Processing Market Revenue Share (%), by Application 2025 & 2033
- Figure 14: North America Downstream Processing Market Volume Share (%), by Application 2025 & 2033
- Figure 15: North America Downstream Processing Market Revenue (billion), by Country 2025 & 2033
- Figure 16: North America Downstream Processing Market Volume (K Unit), by Country 2025 & 2033
- Figure 17: North America Downstream Processing Market Revenue Share (%), by Country 2025 & 2033
- Figure 18: North America Downstream Processing Market Volume Share (%), by Country 2025 & 2033
- Figure 19: Europe Downstream Processing Market Revenue (billion), by Technique 2025 & 2033
- Figure 20: Europe Downstream Processing Market Volume (K Unit), by Technique 2025 & 2033
- Figure 21: Europe Downstream Processing Market Revenue Share (%), by Technique 2025 & 2033
- Figure 22: Europe Downstream Processing Market Volume Share (%), by Technique 2025 & 2033
- Figure 23: Europe Downstream Processing Market Revenue (billion), by Product 2025 & 2033
- Figure 24: Europe Downstream Processing Market Volume (K Unit), by Product 2025 & 2033
- Figure 25: Europe Downstream Processing Market Revenue Share (%), by Product 2025 & 2033
- Figure 26: Europe Downstream Processing Market Volume Share (%), by Product 2025 & 2033
- Figure 27: Europe Downstream Processing Market Revenue (billion), by Application 2025 & 2033
- Figure 28: Europe Downstream Processing Market Volume (K Unit), by Application 2025 & 2033
- Figure 29: Europe Downstream Processing Market Revenue Share (%), by Application 2025 & 2033
- Figure 30: Europe Downstream Processing Market Volume Share (%), by Application 2025 & 2033
- Figure 31: Europe Downstream Processing Market Revenue (billion), by Country 2025 & 2033
- Figure 32: Europe Downstream Processing Market Volume (K Unit), by Country 2025 & 2033
- Figure 33: Europe Downstream Processing Market Revenue Share (%), by Country 2025 & 2033
- Figure 34: Europe Downstream Processing Market Volume Share (%), by Country 2025 & 2033
- Figure 35: Asia Pacific Downstream Processing Market Revenue (billion), by Technique 2025 & 2033
- Figure 36: Asia Pacific Downstream Processing Market Volume (K Unit), by Technique 2025 & 2033
- Figure 37: Asia Pacific Downstream Processing Market Revenue Share (%), by Technique 2025 & 2033
- Figure 38: Asia Pacific Downstream Processing Market Volume Share (%), by Technique 2025 & 2033
- Figure 39: Asia Pacific Downstream Processing Market Revenue (billion), by Product 2025 & 2033
- Figure 40: Asia Pacific Downstream Processing Market Volume (K Unit), by Product 2025 & 2033
- Figure 41: Asia Pacific Downstream Processing Market Revenue Share (%), by Product 2025 & 2033
- Figure 42: Asia Pacific Downstream Processing Market Volume Share (%), by Product 2025 & 2033
- Figure 43: Asia Pacific Downstream Processing Market Revenue (billion), by Application 2025 & 2033
- Figure 44: Asia Pacific Downstream Processing Market Volume (K Unit), by Application 2025 & 2033
- Figure 45: Asia Pacific Downstream Processing Market Revenue Share (%), by Application 2025 & 2033
- Figure 46: Asia Pacific Downstream Processing Market Volume Share (%), by Application 2025 & 2033
- Figure 47: Asia Pacific Downstream Processing Market Revenue (billion), by Country 2025 & 2033
- Figure 48: Asia Pacific Downstream Processing Market Volume (K Unit), by Country 2025 & 2033
- Figure 49: Asia Pacific Downstream Processing Market Revenue Share (%), by Country 2025 & 2033
- Figure 50: Asia Pacific Downstream Processing Market Volume Share (%), by Country 2025 & 2033
- Figure 51: Middle East and Africa Downstream Processing Market Revenue (billion), by Technique 2025 & 2033
- Figure 52: Middle East and Africa Downstream Processing Market Volume (K Unit), by Technique 2025 & 2033
- Figure 53: Middle East and Africa Downstream Processing Market Revenue Share (%), by Technique 2025 & 2033
- Figure 54: Middle East and Africa Downstream Processing Market Volume Share (%), by Technique 2025 & 2033
- Figure 55: Middle East and Africa Downstream Processing Market Revenue (billion), by Product 2025 & 2033
- Figure 56: Middle East and Africa Downstream Processing Market Volume (K Unit), by Product 2025 & 2033
- Figure 57: Middle East and Africa Downstream Processing Market Revenue Share (%), by Product 2025 & 2033
- Figure 58: Middle East and Africa Downstream Processing Market Volume Share (%), by Product 2025 & 2033
- Figure 59: Middle East and Africa Downstream Processing Market Revenue (billion), by Application 2025 & 2033
- Figure 60: Middle East and Africa Downstream Processing Market Volume (K Unit), by Application 2025 & 2033
- Figure 61: Middle East and Africa Downstream Processing Market Revenue Share (%), by Application 2025 & 2033
- Figure 62: Middle East and Africa Downstream Processing Market Volume Share (%), by Application 2025 & 2033
- Figure 63: Middle East and Africa Downstream Processing Market Revenue (billion), by Country 2025 & 2033
- Figure 64: Middle East and Africa Downstream Processing Market Volume (K Unit), by Country 2025 & 2033
- Figure 65: Middle East and Africa Downstream Processing Market Revenue Share (%), by Country 2025 & 2033
- Figure 66: Middle East and Africa Downstream Processing Market Volume Share (%), by Country 2025 & 2033
- Figure 67: South America Downstream Processing Market Revenue (billion), by Technique 2025 & 2033
- Figure 68: South America Downstream Processing Market Volume (K Unit), by Technique 2025 & 2033
- Figure 69: South America Downstream Processing Market Revenue Share (%), by Technique 2025 & 2033
- Figure 70: South America Downstream Processing Market Volume Share (%), by Technique 2025 & 2033
- Figure 71: South America Downstream Processing Market Revenue (billion), by Product 2025 & 2033
- Figure 72: South America Downstream Processing Market Volume (K Unit), by Product 2025 & 2033
- Figure 73: South America Downstream Processing Market Revenue Share (%), by Product 2025 & 2033
- Figure 74: South America Downstream Processing Market Volume Share (%), by Product 2025 & 2033
- Figure 75: South America Downstream Processing Market Revenue (billion), by Application 2025 & 2033
- Figure 76: South America Downstream Processing Market Volume (K Unit), by Application 2025 & 2033
- Figure 77: South America Downstream Processing Market Revenue Share (%), by Application 2025 & 2033
- Figure 78: South America Downstream Processing Market Volume Share (%), by Application 2025 & 2033
- Figure 79: South America Downstream Processing Market Revenue (billion), by Country 2025 & 2033
- Figure 80: South America Downstream Processing Market Volume (K Unit), by Country 2025 & 2033
- Figure 81: South America Downstream Processing Market Revenue Share (%), by Country 2025 & 2033
- Figure 82: South America Downstream Processing Market Volume Share (%), by Country 2025 & 2033
List of Tables
- Table 1: Global Downstream Processing Market Revenue billion Forecast, by Technique 2020 & 2033
- Table 2: Global Downstream Processing Market Volume K Unit Forecast, by Technique 2020 & 2033
- Table 3: Global Downstream Processing Market Revenue billion Forecast, by Product 2020 & 2033
- Table 4: Global Downstream Processing Market Volume K Unit Forecast, by Product 2020 & 2033
- Table 5: Global Downstream Processing Market Revenue billion Forecast, by Application 2020 & 2033
- Table 6: Global Downstream Processing Market Volume K Unit Forecast, by Application 2020 & 2033
- Table 7: Global Downstream Processing Market Revenue billion Forecast, by Region 2020 & 2033
- Table 8: Global Downstream Processing Market Volume K Unit Forecast, by Region 2020 & 2033
- Table 9: Global Downstream Processing Market Revenue billion Forecast, by Technique 2020 & 2033
- Table 10: Global Downstream Processing Market Volume K Unit Forecast, by Technique 2020 & 2033
- Table 11: Global Downstream Processing Market Revenue billion Forecast, by Product 2020 & 2033
- Table 12: Global Downstream Processing Market Volume K Unit Forecast, by Product 2020 & 2033
- Table 13: Global Downstream Processing Market Revenue billion Forecast, by Application 2020 & 2033
- Table 14: Global Downstream Processing Market Volume K Unit Forecast, by Application 2020 & 2033
- Table 15: Global Downstream Processing Market Revenue billion Forecast, by Country 2020 & 2033
- Table 16: Global Downstream Processing Market Volume K Unit Forecast, by Country 2020 & 2033
- Table 17: United States Downstream Processing Market Revenue (billion) Forecast, by Application 2020 & 2033
- Table 18: United States Downstream Processing Market Volume (K Unit) Forecast, by Application 2020 & 2033
- Table 19: Canada Downstream Processing Market Revenue (billion) Forecast, by Application 2020 & 2033
- Table 20: Canada Downstream Processing Market Volume (K Unit) Forecast, by Application 2020 & 2033
- Table 21: Mexico Downstream Processing Market Revenue (billion) Forecast, by Application 2020 & 2033
- Table 22: Mexico Downstream Processing Market Volume (K Unit) Forecast, by Application 2020 & 2033
- Table 23: Global Downstream Processing Market Revenue billion Forecast, by Technique 2020 & 2033
- Table 24: Global Downstream Processing Market Volume K Unit Forecast, by Technique 2020 & 2033
- Table 25: Global Downstream Processing Market Revenue billion Forecast, by Product 2020 & 2033
- Table 26: Global Downstream Processing Market Volume K Unit Forecast, by Product 2020 & 2033
- Table 27: Global Downstream Processing Market Revenue billion Forecast, by Application 2020 & 2033
- Table 28: Global Downstream Processing Market Volume K Unit Forecast, by Application 2020 & 2033
- Table 29: Global Downstream Processing Market Revenue billion Forecast, by Country 2020 & 2033
- Table 30: Global Downstream Processing Market Volume K Unit Forecast, by Country 2020 & 2033
- Table 31: Germany Downstream Processing Market Revenue (billion) Forecast, by Application 2020 & 2033
- Table 32: Germany Downstream Processing Market Volume (K Unit) Forecast, by Application 2020 & 2033
- Table 33: United Kingdom Downstream Processing Market Revenue (billion) Forecast, by Application 2020 & 2033
- Table 34: United Kingdom Downstream Processing Market Volume (K Unit) Forecast, by Application 2020 & 2033
- Table 35: France Downstream Processing Market Revenue (billion) Forecast, by Application 2020 & 2033
- Table 36: France Downstream Processing Market Volume (K Unit) Forecast, by Application 2020 & 2033
- Table 37: Italy Downstream Processing Market Revenue (billion) Forecast, by Application 2020 & 2033
- Table 38: Italy Downstream Processing Market Volume (K Unit) Forecast, by Application 2020 & 2033
- Table 39: Spain Downstream Processing Market Revenue (billion) Forecast, by Application 2020 & 2033
- Table 40: Spain Downstream Processing Market Volume (K Unit) Forecast, by Application 2020 & 2033
- Table 41: Rest of Europe Downstream Processing Market Revenue (billion) Forecast, by Application 2020 & 2033
- Table 42: Rest of Europe Downstream Processing Market Volume (K Unit) Forecast, by Application 2020 & 2033
- Table 43: Global Downstream Processing Market Revenue billion Forecast, by Technique 2020 & 2033
- Table 44: Global Downstream Processing Market Volume K Unit Forecast, by Technique 2020 & 2033
- Table 45: Global Downstream Processing Market Revenue billion Forecast, by Product 2020 & 2033
- Table 46: Global Downstream Processing Market Volume K Unit Forecast, by Product 2020 & 2033
- Table 47: Global Downstream Processing Market Revenue billion Forecast, by Application 2020 & 2033
- Table 48: Global Downstream Processing Market Volume K Unit Forecast, by Application 2020 & 2033
- Table 49: Global Downstream Processing Market Revenue billion Forecast, by Country 2020 & 2033
- Table 50: Global Downstream Processing Market Volume K Unit Forecast, by Country 2020 & 2033
- Table 51: China Downstream Processing Market Revenue (billion) Forecast, by Application 2020 & 2033
- Table 52: China Downstream Processing Market Volume (K Unit) Forecast, by Application 2020 & 2033
- Table 53: Japan Downstream Processing Market Revenue (billion) Forecast, by Application 2020 & 2033
- Table 54: Japan Downstream Processing Market Volume (K Unit) Forecast, by Application 2020 & 2033
- Table 55: India Downstream Processing Market Revenue (billion) Forecast, by Application 2020 & 2033
- Table 56: India Downstream Processing Market Volume (K Unit) Forecast, by Application 2020 & 2033
- Table 57: Australia Downstream Processing Market Revenue (billion) Forecast, by Application 2020 & 2033
- Table 58: Australia Downstream Processing Market Volume (K Unit) Forecast, by Application 2020 & 2033
- Table 59: South Korea Downstream Processing Market Revenue (billion) Forecast, by Application 2020 & 2033
- Table 60: South Korea Downstream Processing Market Volume (K Unit) Forecast, by Application 2020 & 2033
- Table 61: Rest of Asia Pacific Downstream Processing Market Revenue (billion) Forecast, by Application 2020 & 2033
- Table 62: Rest of Asia Pacific Downstream Processing Market Volume (K Unit) Forecast, by Application 2020 & 2033
- Table 63: Global Downstream Processing Market Revenue billion Forecast, by Technique 2020 & 2033
- Table 64: Global Downstream Processing Market Volume K Unit Forecast, by Technique 2020 & 2033
- Table 65: Global Downstream Processing Market Revenue billion Forecast, by Product 2020 & 2033
- Table 66: Global Downstream Processing Market Volume K Unit Forecast, by Product 2020 & 2033
- Table 67: Global Downstream Processing Market Revenue billion Forecast, by Application 2020 & 2033
- Table 68: Global Downstream Processing Market Volume K Unit Forecast, by Application 2020 & 2033
- Table 69: Global Downstream Processing Market Revenue billion Forecast, by Country 2020 & 2033
- Table 70: Global Downstream Processing Market Volume K Unit Forecast, by Country 2020 & 2033
- Table 71: GCC Downstream Processing Market Revenue (billion) Forecast, by Application 2020 & 2033
- Table 72: GCC Downstream Processing Market Volume (K Unit) Forecast, by Application 2020 & 2033
- Table 73: South Africa Downstream Processing Market Revenue (billion) Forecast, by Application 2020 & 2033
- Table 74: South Africa Downstream Processing Market Volume (K Unit) Forecast, by Application 2020 & 2033
- Table 75: Rest of Middle East and Africa Downstream Processing Market Revenue (billion) Forecast, by Application 2020 & 2033
- Table 76: Rest of Middle East and Africa Downstream Processing Market Volume (K Unit) Forecast, by Application 2020 & 2033
- Table 77: Global Downstream Processing Market Revenue billion Forecast, by Technique 2020 & 2033
- Table 78: Global Downstream Processing Market Volume K Unit Forecast, by Technique 2020 & 2033
- Table 79: Global Downstream Processing Market Revenue billion Forecast, by Product 2020 & 2033
- Table 80: Global Downstream Processing Market Volume K Unit Forecast, by Product 2020 & 2033
- Table 81: Global Downstream Processing Market Revenue billion Forecast, by Application 2020 & 2033
- Table 82: Global Downstream Processing Market Volume K Unit Forecast, by Application 2020 & 2033
- Table 83: Global Downstream Processing Market Revenue billion Forecast, by Country 2020 & 2033
- Table 84: Global Downstream Processing Market Volume K Unit Forecast, by Country 2020 & 2033
- Table 85: Brazil Downstream Processing Market Revenue (billion) Forecast, by Application 2020 & 2033
- Table 86: Brazil Downstream Processing Market Volume (K Unit) Forecast, by Application 2020 & 2033
- Table 87: Argentina Downstream Processing Market Revenue (billion) Forecast, by Application 2020 & 2033
- Table 88: Argentina Downstream Processing Market Volume (K Unit) Forecast, by Application 2020 & 2033
- Table 89: Rest of South America Downstream Processing Market Revenue (billion) Forecast, by Application 2020 & 2033
- Table 90: Rest of South America Downstream Processing Market Volume (K Unit) Forecast, by Application 2020 & 2033
Frequently Asked Questions
1. What is the projected Compound Annual Growth Rate (CAGR) of the Downstream Processing Market?
The projected CAGR is approximately 11.3%.
2. Which companies are prominent players in the Downstream Processing Market?
Key companies in the market include GE Healthcare, Danaher Corporation (Cytiva), Thermo Fisher Scientific Inc, Eppendorf AG, Lonza Group AG, 3M Company, Repligen Corporation, Sartorius Stedim Biotech S A, Merck KGaA (Merck Millipore).
3. What are the main segments of the Downstream Processing Market?
The market segments include Technique, Product, Application.
4. Can you provide details about the market size?
The market size is estimated to be USD 34.3 billion as of 2022.
5. What are some drivers contributing to market growth?
Growth of Biotechnology Sector Globally; Rising R&D Expenditure in Biopharmaceutical Companies; Increase in the Prominence of Contract Manufacturing Organizations.
6. What are the notable trends driving market growth?
Antibodies Production is Expected to Dominate the Downstream Processing Market During the Forecast Period.
7. Are there any restraints impacting market growth?
High Cost of Instruments; Purification Bottleneck.
8. Can you provide examples of recent developments in the market?
In June 2022, Merck collaborated with Agilent Technologies to reduce the industry gap in process analytical technologies (PAT) for downstream processing. Under the collaboration, the companies combine Merck's bioprocess portfolio with Agilent Technologies' advanced analytical products to extend real-time monitoring and automated process control of critical process parameters (CPPs) and critical quality attributes (CQAs) in downstream processing (DSP).
9. What pricing options are available for accessing the report?
Pricing options include single-user, multi-user, and enterprise licenses priced at USD 4750, USD 5250, and USD 8750 respectively.
10. Is the market size provided in terms of value or volume?
The market size is provided in terms of value, measured in billion and volume, measured in K Unit.
11. Are there any specific market keywords associated with the report?
Yes, the market keyword associated with the report is "Downstream Processing Market," which aids in identifying and referencing the specific market segment covered.
12. How do I determine which pricing option suits my needs best?
The pricing options vary based on user requirements and access needs. Individual users may opt for single-user licenses, while businesses requiring broader access may choose multi-user or enterprise licenses for cost-effective access to the report.
13. Are there any additional resources or data provided in the Downstream Processing Market report?
While the report offers comprehensive insights, it's advisable to review the specific contents or supplementary materials provided to ascertain if additional resources or data are available.
14. How can I stay updated on further developments or reports in the Downstream Processing Market?
To stay informed about further developments, trends, and reports in the Downstream Processing Market, consider subscribing to industry newsletters, following relevant companies and organizations, or regularly checking reputable industry news sources and publications.
Methodology
Step 1 - Identification of Relevant Samples Size from Population Database


Step 2 - Approaches for Defining Global Market Size (Value, Volume* & Price*)

Note*: In applicable scenarios
Step 3 - Data Sources
Primary Research
- Web Analytics
- Survey Reports
- Research Institute
- Latest Research Reports
- Opinion Leaders
Secondary Research
- Annual Reports
- White Paper
- Latest Press Release
- Industry Association
- Paid Database
- Investor Presentations

Step 4 - Data Triangulation
Involves using different sources of information in order to increase the validity of a study
These sources are likely to be stakeholders in a program - participants, other researchers, program staff, other community members, and so on.
Then we put all data in single framework & apply various statistical tools to find out the dynamic on the market.
During the analysis stage, feedback from the stakeholder groups would be compared to determine areas of agreement as well as areas of divergence