

Key Insights
The global Electric Vehicle (EV) traction inverter market is experiencing robust expansion, driven by the accelerating adoption of electric mobility worldwide. The market size was approximately $6.8 billion in 2024, and is projected to witness a significant Compound Annual Growth Rate (CAGR) of 14.7% from 2025 to 2033. This remarkable growth is fueled by a confluence of factors, including stringent government regulations promoting EV production and sales, increasing consumer awareness regarding environmental sustainability, and continuous advancements in battery technology that are enhancing EV range and affordability. The burgeoning demand for both All-electric Vehicles (AEVs) and Plug-in Hybrid Electric Vehicles (PHEVs) directly translates to a higher requirement for sophisticated traction inverters, which are the critical components that control the electric motor's speed and torque. Innovations in semiconductor materials like Silicon Carbide (SiC) and Gallium Nitride (GaN) are further boosting performance, efficiency, and reliability, creating opportunities for market players.
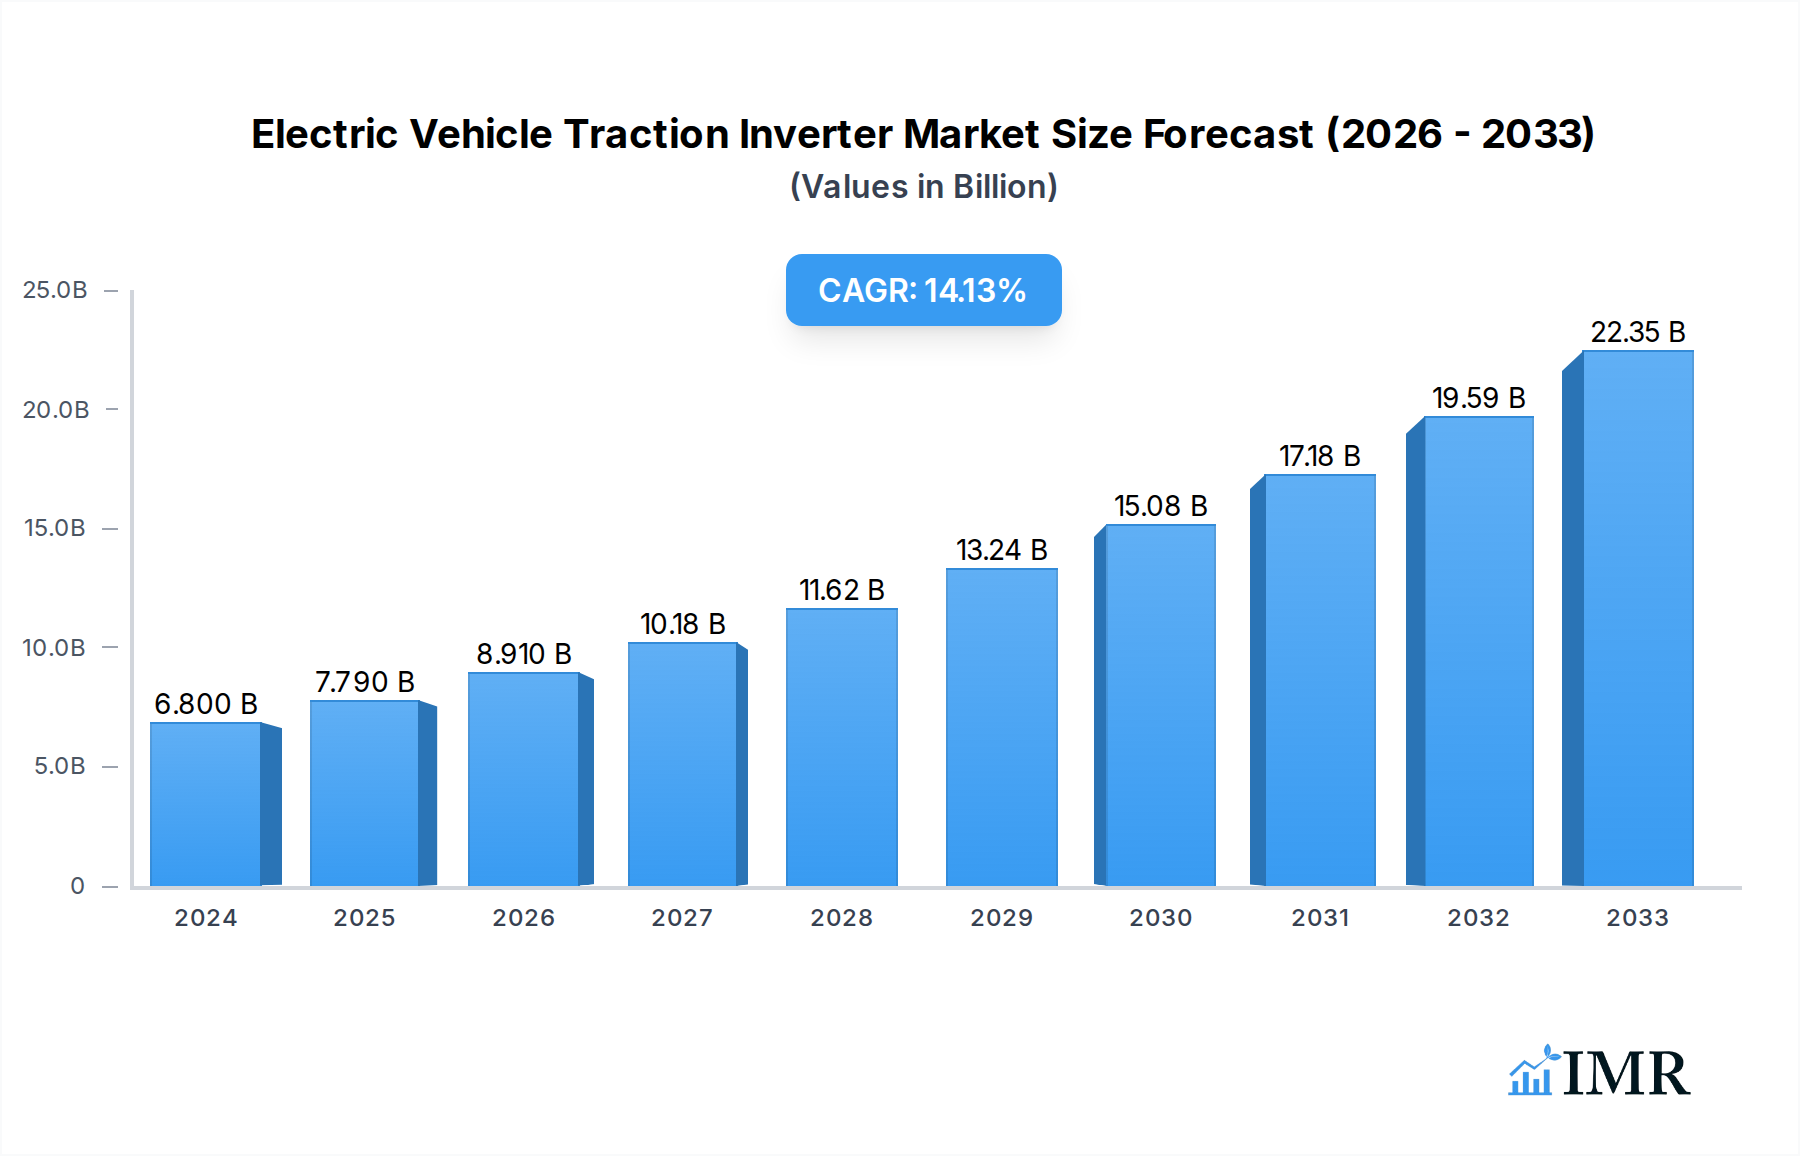
Electric Vehicle Traction Inverter Market Size (In Billion)
The market is segmented into high-voltage and low-voltage inverters, with the high-voltage segment dominating due to its application in powerful AEVs and PHEVs. Key applications span across passenger cars, commercial vehicles, and two-wheelers, all witnessing a steep rise in electrification. Major industry players such as Infineon Technologies, Silicon Labs, STMicroelectronics, ON Semiconductor, and Hitachi are actively investing in research and development to introduce more advanced and cost-effective solutions. While the market presents immense growth potential, certain restraints such as the high cost of raw materials for advanced semiconductor components and the need for robust charging infrastructure development could pose challenges. Nevertheless, the overarching trend towards decarbonization and the increasing global production capacity for EVs are expected to propel the traction inverter market to new heights in the coming years.

Electric Vehicle Traction Inverter Company Market Share
Electric Vehicle Traction Inverter Market: Comprehensive Growth Analysis and Strategic Insights (2019-2033)
This in-depth report provides an exhaustive analysis of the global Electric Vehicle Traction Inverter market, a critical component driving the automotive electrification revolution. We delve into market dynamics, growth trends, regional dominance, product innovations, key challenges, emerging opportunities, and the strategic landscape shaped by leading industry players. This report is essential for stakeholders seeking to understand the current state and future trajectory of the EV traction inverter sector, including its parent and child markets.
Electric Vehicle Traction Inverter Market Dynamics & Structure
The Electric Vehicle (EV) traction inverter market is characterized by a moderately concentrated structure, with key players like Infineon Technologies, ON Semiconductor, and STMicroelectronics holding significant market shares. Technological innovation is a primary driver, fueled by the relentless pursuit of higher efficiency, increased power density, and reduced costs. The integration of advanced semiconductor materials, such as Silicon Carbide (SiC) and Gallium Nitride (GaN), is revolutionizing inverter performance, enabling smaller, lighter, and more energy-efficient systems. Regulatory frameworks, including stringent emissions standards and government incentives for EV adoption, are profoundly shaping market demand. Competitive product substitutes, while not directly replacing the traction inverter's core function, include advancements in integrated powertrain solutions and next-generation battery technologies that indirectly influence inverter design and demand. End-user demographics are shifting towards environmentally conscious consumers and fleet operators seeking reduced operating costs and sustainable transportation solutions. Mergers and acquisitions (M&A) are a significant trend, with companies consolidating to gain market access, acquire technological expertise, and achieve economies of scale.
- Market Concentration: Dominated by a few major semiconductor and automotive component manufacturers, with ongoing consolidation.
- Technological Innovation Drivers: Focus on SiC/GaN integration, advanced thermal management, miniaturization, and enhanced control algorithms for improved efficiency and performance.
- Regulatory Frameworks: Government mandates for CO2 reduction, EV sales targets, and subsidies for EV purchases are key growth catalysts.
- Competitive Product Substitutes: While not direct replacements, advancements in electric motors, battery management systems, and integrated drivetrains indirectly influence inverter market dynamics.
- End-User Demographics: Growing demand from both individual consumers and commercial fleets driven by environmental awareness and Total Cost of Ownership (TCO) considerations.
- M&A Trends: Strategic acquisitions to secure intellectual property, expand product portfolios, and strengthen supply chain integration are prevalent.
Electric Vehicle Traction Inverter Growth Trends & Insights
The global Electric Vehicle Traction Inverter market is poised for exponential growth, driven by the accelerating adoption of electric vehicles worldwide. The market size is projected to witness a substantial expansion, evolving from approximately $15.8 billion in 2025 to an estimated $65.2 billion by 2033, exhibiting a Compound Annual Growth Rate (CAGR) of around 19.5% during the forecast period (2025-2033). This remarkable growth is underpinned by a confluence of factors, including plummeting battery costs, expanding charging infrastructure, and increasing consumer acceptance of electric mobility. Technological disruptions, particularly the widespread adoption of Silicon Carbide (SiC) and Gallium Nitride (GaN) semiconductors, are transforming inverter capabilities. These advanced materials enable higher power density, superior thermal performance, and significantly improved energy efficiency, leading to longer driving ranges and faster charging times for EVs. The shift towards higher voltage architectures, typically 800V and above, is also a major trend, allowing for faster charging and more efficient power delivery.
Consumer behavior is a pivotal influence, with a growing preference for sustainable transportation options and a keen interest in the performance and cost benefits offered by EVs. Government policies and incentives, such as tax credits and subsidies for EV purchases, continue to play a crucial role in stimulating demand. The underlying parent market for power semiconductors and the child market for automotive electronics are experiencing robust growth, directly translating into increased demand for traction inverters. The historical period (2019-2024) has laid a strong foundation for this expansion, with rapid advancements in inverter technology and a steady increase in EV production volumes. By 2025, the market is expected to solidify its position as a cornerstone of the automotive industry, with increasing integration of inverter technology into vehicle platforms and a growing focus on modular and scalable inverter solutions. The adoption rates of both All-electric Vehicles (AEVs) and Plug-in Hybrid Electric Vehicles (PHEVs) are directly correlated with the growth of the traction inverter market.
Dominant Regions, Countries, or Segments in Electric Vehicle Traction Inverter
The All-electric Vehicles (AEVs) segment, particularly those utilizing High Voltage architectures, is currently the dominant force driving the global Electric Vehicle Traction Inverter market. This dominance is propelled by a confluence of factors, including aggressive government policies aimed at phasing out internal combustion engine (ICE) vehicles, substantial investments in charging infrastructure, and a rapidly growing consumer base that prioritizes zero-emission transportation. China stands out as a leading country, driven by its proactive industrial policies, vast domestic EV market, and strong manufacturing capabilities for both EVs and their components, including traction inverters. Europe, with its stringent emissions regulations and strong consumer environmental consciousness, is another significant growth engine, particularly in countries like Germany, France, and the UK, which are actively promoting EV adoption and supporting the development of the EV supply chain.
The United States, while historically lagging, is witnessing a surge in EV adoption and investment, further bolstering the demand for traction inverters, especially in states like California. The technological evolution towards higher voltage systems (e.g., 800V and above) within the High Voltage AEV segment is critical, enabling faster charging and improved vehicle performance, thereby accelerating market penetration. This trend is further amplified by the increasing number of AEV models being launched across various price segments. The Plug-in Hybrid Electric Vehicles (PHEVs) segment, while still a significant contributor, is gradually being overshadowed by the pure AEV market as battery technology improves and charging infrastructure expands. The Low Voltage segment of traction inverters, typically found in smaller EVs or specific hybrid applications, represents a smaller but still relevant portion of the market, with steady growth driven by the diversification of EV offerings.
- Application Dominance: All-electric Vehicles (AEVs) are the primary growth driver due to increasing consumer preference and government mandates for zero-emission transport.
- Type Dominance: High Voltage traction inverters (400V, 800V and above) are crucial for performance, efficiency, and faster charging in modern EVs.
- Regional Leadership (Country): China leads in terms of production and adoption, followed by Europe and increasingly, North America.
- Regional Leadership (Continent): Asia-Pacific, particularly China, is the largest market, followed by Europe, driven by regulatory support and consumer demand.
- Growth Drivers: Government incentives, falling battery costs, expanding charging networks, and technological advancements in SiC/GaN are key accelerators.
- Market Share: The AEV, High Voltage segment commands the largest market share and is expected to maintain this lead throughout the forecast period.
Electric Vehicle Traction Inverter Product Landscape
The electric vehicle traction inverter product landscape is rapidly evolving with a strong emphasis on enhanced performance, efficiency, and cost-effectiveness. Innovations are centered around the integration of advanced wide-bandgap semiconductors like Silicon Carbide (SiC) and Gallium Nitride (GaN), which offer superior switching speeds, lower conduction losses, and higher operating temperatures compared to traditional silicon-based components. This leads to smaller, lighter, and more efficient inverters that can deliver more power. Manufacturers are also focusing on modular designs and integrated solutions that combine the inverter with other powertrain components, such as the onboard charger and DC-DC converter, to optimize space and reduce system complexity. Advanced thermal management techniques, including liquid cooling and advanced heat sinks, are crucial for maintaining optimal operating temperatures and ensuring longevity.
- Key Innovations: Integration of SiC and GaN semiconductors for higher efficiency and power density.
- Design Trends: Modular designs, miniaturization, and integration with other powertrain components.
- Performance Metrics: Focus on increased power output, improved energy efficiency (e.g., >98%), enhanced thermal management, and reduced electromagnetic interference (EMI).
- Unique Selling Propositions: Extended vehicle range, faster charging capabilities, and a smaller, lighter footprint for the powertrain.
Key Drivers, Barriers & Challenges in Electric Vehicle Traction Inverter
The Electric Vehicle Traction Inverter market is propelled by significant drivers, including stringent global emission regulations that mandate a transition to zero-emission vehicles, the rapidly declining cost of EV batteries, and increasing consumer demand for sustainable and technologically advanced transportation. Government incentives and subsidies play a crucial role in making EVs more affordable, thereby boosting inverter demand. Technological advancements in power electronics, especially the adoption of SiC and GaN semiconductors, are enabling more efficient, compact, and cost-effective inverter solutions.
However, the market faces several barriers and challenges. Supply chain disruptions, particularly for critical raw materials and semiconductor components, can lead to production delays and increased costs. The high initial cost of EVs compared to traditional internal combustion engine vehicles, despite falling battery prices, remains a hurdle for widespread adoption in some regions. The availability and reliability of charging infrastructure are also critical factors influencing consumer confidence. Intense competition among inverter manufacturers, coupled with the need for continuous innovation to stay ahead, puts pressure on profit margins. The complexity of manufacturing high-performance inverters and the need for specialized expertise also pose challenges.
Key Drivers:
- Global Emission Regulations
- Decreasing Battery Costs
- Growing Consumer Demand for EVs
- Government Incentives and Subsidies
- Technological Advancements in Power Electronics (SiC/GaN)
Key Barriers & Challenges:
- Supply Chain Volatility and Component Shortages
- High Upfront Cost of EVs
- Charging Infrastructure Gaps and Reliability Concerns
- Intense Market Competition
- Manufacturing Complexity and Skill Shortages
Emerging Opportunities in Electric Vehicle Traction Inverter
Emerging opportunities in the Electric Vehicle Traction Inverter market are driven by the continuous innovation in EV technology and the expanding scope of electric mobility. The development of highly integrated powertrain modules, which combine traction inverters with electric motors and gearboxes, presents a significant avenue for growth. This integration promises further improvements in efficiency, packaging, and cost reduction. The increasing penetration of electric vehicles in commercial fleets, including trucks, buses, and delivery vans, opens up new markets for high-power and robust traction inverters. Furthermore, the growing interest in vehicle-to-grid (V2G) technology and bidirectional power flow capabilities presents an opportunity for inverters to play a more active role in energy management systems.
- Integrated Powertrain Solutions: Combining inverters with motors and gearboxes for enhanced efficiency and reduced complexity.
- Commercial Electric Vehicles: Expanding market for high-power inverters in trucks, buses, and other heavy-duty applications.
- Vehicle-to-Grid (V2G) Technology: Inverters enabling bidirectional power flow for energy management and grid stability.
- Advanced Thermal Management: Development of novel cooling solutions for higher power density and improved reliability.
- Software and Control Algorithms: Innovations in intelligent control systems for optimizing inverter performance and battery management.
Growth Accelerators in the Electric Vehicle Traction Inverter Industry
The Electric Vehicle Traction Inverter industry is experiencing robust growth driven by several key accelerators. The relentless technological advancement in power semiconductor materials, particularly the widespread adoption and cost reduction of Silicon Carbide (SiC) and Gallium Nitride (GaN), is a primary growth catalyst, enabling more efficient, compact, and reliable inverters. Strategic partnerships between semiconductor manufacturers and automotive OEMs are crucial, fostering co-development and ensuring the seamless integration of inverter technology into new vehicle platforms. The expansion of global EV charging infrastructure, including faster charging solutions, directly fuels the demand for advanced inverters capable of handling higher power throughput. Furthermore, evolving battery technologies that offer higher energy densities and faster charging capabilities indirectly spur the need for sophisticated inverters to manage these improvements. Market expansion strategies, including the increasing localization of manufacturing and supply chains by global players, also contribute to sustained growth by reducing lead times and logistical costs.
Key Players Shaping the Electric Vehicle Traction Inverter Market
- Infineon Technologies
- Silicon Labs
- STMicroelectronics
- Furukawa Group
- ON Semiconductor
- Hitachi
- Semikron
- Danfoss
- ROHM
- Mitsubishi Electric (Vincotech)
- Renesas Electronics
- Toshiba
Notable Milestones in Electric Vehicle Traction Inverter Sector
- 2019: Increased adoption of 800V architectures in production EVs, driving demand for advanced inverters.
- 2020: Major semiconductor manufacturers announce significant investments in SiC and GaN production capacity.
- 2021: Launch of new inverter platforms featuring integrated SiC modules for enhanced performance and miniaturization.
- 2022: Strategic partnerships emerge between inverter suppliers and battery manufacturers to optimize system integration.
- 2023: Significant growth in the use of AI-driven control algorithms for traction inverters to improve efficiency and diagnostics.
- 2024: Increased focus on sustainability and recyclability in inverter component design and manufacturing.
In-Depth Electric Vehicle Traction Inverter Market Outlook
The Electric Vehicle Traction Inverter market is set for a period of sustained and robust growth, driven by the undeniable global shift towards electrified mobility. Key growth accelerators, including the continued innovation in wide-bandgap semiconductor technology (SiC and GaN), strategic collaborations between key industry players, and the ongoing expansion of EV charging infrastructure, are creating a highly favorable market environment. The increasing demand for higher voltage architectures and integrated powertrain solutions will further solidify the market's trajectory. Stakeholders can anticipate significant opportunities in developing advanced, efficient, and cost-effective inverter solutions that cater to the evolving needs of the automotive sector. The future outlook points towards a highly dynamic and competitive landscape, where technological leadership and strategic partnerships will be paramount for success.
Electric Vehicle Traction Inverter Segmentation
-
1. Application
- 1.1. All-electric Vehicles (AEVs)
- 1.2. Plug-in Hybrid Electric Vehicles (PHEVs)
-
2. Type
- 2.1. High Voltage
- 2.2. Low Voltage
Electric Vehicle Traction Inverter Segmentation By Geography
-
1. North America
- 1.1. United States
- 1.2. Canada
- 1.3. Mexico
-
2. South America
- 2.1. Brazil
- 2.2. Argentina
- 2.3. Rest of South America
-
3. Europe
- 3.1. United Kingdom
- 3.2. Germany
- 3.3. France
- 3.4. Italy
- 3.5. Spain
- 3.6. Russia
- 3.7. Benelux
- 3.8. Nordics
- 3.9. Rest of Europe
-
4. Middle East & Africa
- 4.1. Turkey
- 4.2. Israel
- 4.3. GCC
- 4.4. North Africa
- 4.5. South Africa
- 4.6. Rest of Middle East & Africa
-
5. Asia Pacific
- 5.1. China
- 5.2. India
- 5.3. Japan
- 5.4. South Korea
- 5.5. ASEAN
- 5.6. Oceania
- 5.7. Rest of Asia Pacific
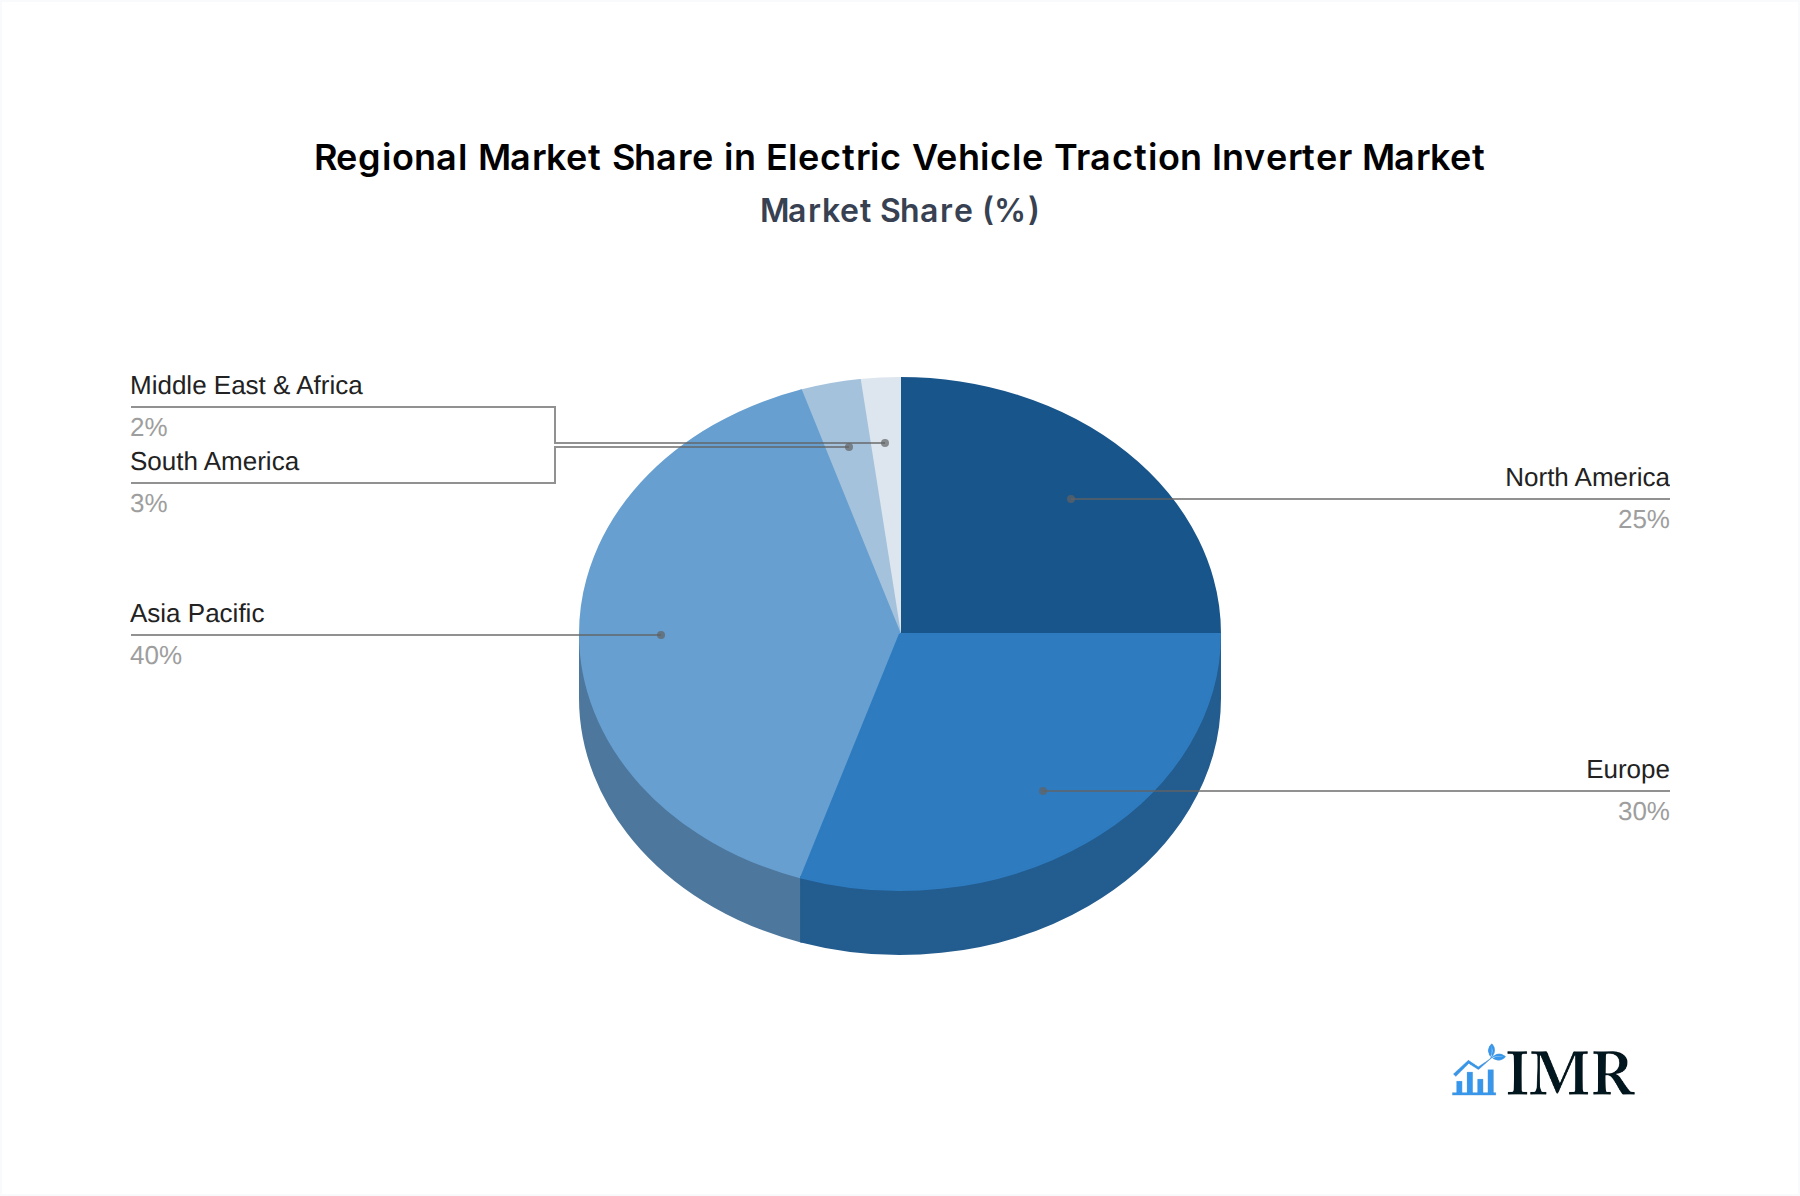
Electric Vehicle Traction Inverter Regional Market Share
Geographic Coverage of Electric Vehicle Traction Inverter
Electric Vehicle Traction Inverter REPORT HIGHLIGHTS
| Aspects | Details |
|---|---|
| Study Period | 2020-2034 |
| Base Year | 2025 |
| Estimated Year | 2026 |
| Forecast Period | 2026-2034 |
| Historical Period | 2020-2025 |
| Growth Rate | CAGR of 14.7% from 2020-2034 |
| Segmentation |
|
Table of Contents
- 1. Introduction
- 1.1. Research Scope
- 1.2. Market Segmentation
- 1.3. Research Methodology
- 1.4. Definitions and Assumptions
- 2. Executive Summary
- 2.1. Introduction
- 3. Market Dynamics
- 3.1. Introduction
- 3.2. Market Drivers
- 3.3. Market Restrains
- 3.4. Market Trends
- 4. Market Factor Analysis
- 4.1. Porters Five Forces
- 4.2. Supply/Value Chain
- 4.3. PESTEL analysis
- 4.4. Market Entropy
- 4.5. Patent/Trademark Analysis
- 5. Global Electric Vehicle Traction Inverter Analysis, Insights and Forecast, 2020-2032
- 5.1. Market Analysis, Insights and Forecast - by Application
- 5.1.1. All-electric Vehicles (AEVs)
- 5.1.2. Plug-in Hybrid Electric Vehicles (PHEVs)
- 5.2. Market Analysis, Insights and Forecast - by Type
- 5.2.1. High Voltage
- 5.2.2. Low Voltage
- 5.3. Market Analysis, Insights and Forecast - by Region
- 5.3.1. North America
- 5.3.2. South America
- 5.3.3. Europe
- 5.3.4. Middle East & Africa
- 5.3.5. Asia Pacific
- 5.1. Market Analysis, Insights and Forecast - by Application
- 6. North America Electric Vehicle Traction Inverter Analysis, Insights and Forecast, 2020-2032
- 6.1. Market Analysis, Insights and Forecast - by Application
- 6.1.1. All-electric Vehicles (AEVs)
- 6.1.2. Plug-in Hybrid Electric Vehicles (PHEVs)
- 6.2. Market Analysis, Insights and Forecast - by Type
- 6.2.1. High Voltage
- 6.2.2. Low Voltage
- 6.1. Market Analysis, Insights and Forecast - by Application
- 7. South America Electric Vehicle Traction Inverter Analysis, Insights and Forecast, 2020-2032
- 7.1. Market Analysis, Insights and Forecast - by Application
- 7.1.1. All-electric Vehicles (AEVs)
- 7.1.2. Plug-in Hybrid Electric Vehicles (PHEVs)
- 7.2. Market Analysis, Insights and Forecast - by Type
- 7.2.1. High Voltage
- 7.2.2. Low Voltage
- 7.1. Market Analysis, Insights and Forecast - by Application
- 8. Europe Electric Vehicle Traction Inverter Analysis, Insights and Forecast, 2020-2032
- 8.1. Market Analysis, Insights and Forecast - by Application
- 8.1.1. All-electric Vehicles (AEVs)
- 8.1.2. Plug-in Hybrid Electric Vehicles (PHEVs)
- 8.2. Market Analysis, Insights and Forecast - by Type
- 8.2.1. High Voltage
- 8.2.2. Low Voltage
- 8.1. Market Analysis, Insights and Forecast - by Application
- 9. Middle East & Africa Electric Vehicle Traction Inverter Analysis, Insights and Forecast, 2020-2032
- 9.1. Market Analysis, Insights and Forecast - by Application
- 9.1.1. All-electric Vehicles (AEVs)
- 9.1.2. Plug-in Hybrid Electric Vehicles (PHEVs)
- 9.2. Market Analysis, Insights and Forecast - by Type
- 9.2.1. High Voltage
- 9.2.2. Low Voltage
- 9.1. Market Analysis, Insights and Forecast - by Application
- 10. Asia Pacific Electric Vehicle Traction Inverter Analysis, Insights and Forecast, 2020-2032
- 10.1. Market Analysis, Insights and Forecast - by Application
- 10.1.1. All-electric Vehicles (AEVs)
- 10.1.2. Plug-in Hybrid Electric Vehicles (PHEVs)
- 10.2. Market Analysis, Insights and Forecast - by Type
- 10.2.1. High Voltage
- 10.2.2. Low Voltage
- 10.1. Market Analysis, Insights and Forecast - by Application
- 11. Competitive Analysis
- 11.1. Global Market Share Analysis 2025
- 11.2. Company Profiles
- 11.2.1 Infineon Technologies
- 11.2.1.1. Overview
- 11.2.1.2. Products
- 11.2.1.3. SWOT Analysis
- 11.2.1.4. Recent Developments
- 11.2.1.5. Financials (Based on Availability)
- 11.2.2 Silicon Labs
- 11.2.2.1. Overview
- 11.2.2.2. Products
- 11.2.2.3. SWOT Analysis
- 11.2.2.4. Recent Developments
- 11.2.2.5. Financials (Based on Availability)
- 11.2.3 STMicroelectronics
- 11.2.3.1. Overview
- 11.2.3.2. Products
- 11.2.3.3. SWOT Analysis
- 11.2.3.4. Recent Developments
- 11.2.3.5. Financials (Based on Availability)
- 11.2.4 Furukawa Group
- 11.2.4.1. Overview
- 11.2.4.2. Products
- 11.2.4.3. SWOT Analysis
- 11.2.4.4. Recent Developments
- 11.2.4.5. Financials (Based on Availability)
- 11.2.5 ON Semiconductor
- 11.2.5.1. Overview
- 11.2.5.2. Products
- 11.2.5.3. SWOT Analysis
- 11.2.5.4. Recent Developments
- 11.2.5.5. Financials (Based on Availability)
- 11.2.6 Hitachi
- 11.2.6.1. Overview
- 11.2.6.2. Products
- 11.2.6.3. SWOT Analysis
- 11.2.6.4. Recent Developments
- 11.2.6.5. Financials (Based on Availability)
- 11.2.7 Semikron
- 11.2.7.1. Overview
- 11.2.7.2. Products
- 11.2.7.3. SWOT Analysis
- 11.2.7.4. Recent Developments
- 11.2.7.5. Financials (Based on Availability)
- 11.2.8 Danfoss
- 11.2.8.1. Overview
- 11.2.8.2. Products
- 11.2.8.3. SWOT Analysis
- 11.2.8.4. Recent Developments
- 11.2.8.5. Financials (Based on Availability)
- 11.2.9 ROHM
- 11.2.9.1. Overview
- 11.2.9.2. Products
- 11.2.9.3. SWOT Analysis
- 11.2.9.4. Recent Developments
- 11.2.9.5. Financials (Based on Availability)
- 11.2.10 Mitsubishi Electric (Vincotech)
- 11.2.10.1. Overview
- 11.2.10.2. Products
- 11.2.10.3. SWOT Analysis
- 11.2.10.4. Recent Developments
- 11.2.10.5. Financials (Based on Availability)
- 11.2.11 Renesas Electronics
- 11.2.11.1. Overview
- 11.2.11.2. Products
- 11.2.11.3. SWOT Analysis
- 11.2.11.4. Recent Developments
- 11.2.11.5. Financials (Based on Availability)
- 11.2.12 Toshiba
- 11.2.12.1. Overview
- 11.2.12.2. Products
- 11.2.12.3. SWOT Analysis
- 11.2.12.4. Recent Developments
- 11.2.12.5. Financials (Based on Availability)
- 11.2.1 Infineon Technologies
List of Figures
- Figure 1: Global Electric Vehicle Traction Inverter Revenue Breakdown (undefined, %) by Region 2025 & 2033
- Figure 2: Global Electric Vehicle Traction Inverter Volume Breakdown (K, %) by Region 2025 & 2033
- Figure 3: North America Electric Vehicle Traction Inverter Revenue (undefined), by Application 2025 & 2033
- Figure 4: North America Electric Vehicle Traction Inverter Volume (K), by Application 2025 & 2033
- Figure 5: North America Electric Vehicle Traction Inverter Revenue Share (%), by Application 2025 & 2033
- Figure 6: North America Electric Vehicle Traction Inverter Volume Share (%), by Application 2025 & 2033
- Figure 7: North America Electric Vehicle Traction Inverter Revenue (undefined), by Type 2025 & 2033
- Figure 8: North America Electric Vehicle Traction Inverter Volume (K), by Type 2025 & 2033
- Figure 9: North America Electric Vehicle Traction Inverter Revenue Share (%), by Type 2025 & 2033
- Figure 10: North America Electric Vehicle Traction Inverter Volume Share (%), by Type 2025 & 2033
- Figure 11: North America Electric Vehicle Traction Inverter Revenue (undefined), by Country 2025 & 2033
- Figure 12: North America Electric Vehicle Traction Inverter Volume (K), by Country 2025 & 2033
- Figure 13: North America Electric Vehicle Traction Inverter Revenue Share (%), by Country 2025 & 2033
- Figure 14: North America Electric Vehicle Traction Inverter Volume Share (%), by Country 2025 & 2033
- Figure 15: South America Electric Vehicle Traction Inverter Revenue (undefined), by Application 2025 & 2033
- Figure 16: South America Electric Vehicle Traction Inverter Volume (K), by Application 2025 & 2033
- Figure 17: South America Electric Vehicle Traction Inverter Revenue Share (%), by Application 2025 & 2033
- Figure 18: South America Electric Vehicle Traction Inverter Volume Share (%), by Application 2025 & 2033
- Figure 19: South America Electric Vehicle Traction Inverter Revenue (undefined), by Type 2025 & 2033
- Figure 20: South America Electric Vehicle Traction Inverter Volume (K), by Type 2025 & 2033
- Figure 21: South America Electric Vehicle Traction Inverter Revenue Share (%), by Type 2025 & 2033
- Figure 22: South America Electric Vehicle Traction Inverter Volume Share (%), by Type 2025 & 2033
- Figure 23: South America Electric Vehicle Traction Inverter Revenue (undefined), by Country 2025 & 2033
- Figure 24: South America Electric Vehicle Traction Inverter Volume (K), by Country 2025 & 2033
- Figure 25: South America Electric Vehicle Traction Inverter Revenue Share (%), by Country 2025 & 2033
- Figure 26: South America Electric Vehicle Traction Inverter Volume Share (%), by Country 2025 & 2033
- Figure 27: Europe Electric Vehicle Traction Inverter Revenue (undefined), by Application 2025 & 2033
- Figure 28: Europe Electric Vehicle Traction Inverter Volume (K), by Application 2025 & 2033
- Figure 29: Europe Electric Vehicle Traction Inverter Revenue Share (%), by Application 2025 & 2033
- Figure 30: Europe Electric Vehicle Traction Inverter Volume Share (%), by Application 2025 & 2033
- Figure 31: Europe Electric Vehicle Traction Inverter Revenue (undefined), by Type 2025 & 2033
- Figure 32: Europe Electric Vehicle Traction Inverter Volume (K), by Type 2025 & 2033
- Figure 33: Europe Electric Vehicle Traction Inverter Revenue Share (%), by Type 2025 & 2033
- Figure 34: Europe Electric Vehicle Traction Inverter Volume Share (%), by Type 2025 & 2033
- Figure 35: Europe Electric Vehicle Traction Inverter Revenue (undefined), by Country 2025 & 2033
- Figure 36: Europe Electric Vehicle Traction Inverter Volume (K), by Country 2025 & 2033
- Figure 37: Europe Electric Vehicle Traction Inverter Revenue Share (%), by Country 2025 & 2033
- Figure 38: Europe Electric Vehicle Traction Inverter Volume Share (%), by Country 2025 & 2033
- Figure 39: Middle East & Africa Electric Vehicle Traction Inverter Revenue (undefined), by Application 2025 & 2033
- Figure 40: Middle East & Africa Electric Vehicle Traction Inverter Volume (K), by Application 2025 & 2033
- Figure 41: Middle East & Africa Electric Vehicle Traction Inverter Revenue Share (%), by Application 2025 & 2033
- Figure 42: Middle East & Africa Electric Vehicle Traction Inverter Volume Share (%), by Application 2025 & 2033
- Figure 43: Middle East & Africa Electric Vehicle Traction Inverter Revenue (undefined), by Type 2025 & 2033
- Figure 44: Middle East & Africa Electric Vehicle Traction Inverter Volume (K), by Type 2025 & 2033
- Figure 45: Middle East & Africa Electric Vehicle Traction Inverter Revenue Share (%), by Type 2025 & 2033
- Figure 46: Middle East & Africa Electric Vehicle Traction Inverter Volume Share (%), by Type 2025 & 2033
- Figure 47: Middle East & Africa Electric Vehicle Traction Inverter Revenue (undefined), by Country 2025 & 2033
- Figure 48: Middle East & Africa Electric Vehicle Traction Inverter Volume (K), by Country 2025 & 2033
- Figure 49: Middle East & Africa Electric Vehicle Traction Inverter Revenue Share (%), by Country 2025 & 2033
- Figure 50: Middle East & Africa Electric Vehicle Traction Inverter Volume Share (%), by Country 2025 & 2033
- Figure 51: Asia Pacific Electric Vehicle Traction Inverter Revenue (undefined), by Application 2025 & 2033
- Figure 52: Asia Pacific Electric Vehicle Traction Inverter Volume (K), by Application 2025 & 2033
- Figure 53: Asia Pacific Electric Vehicle Traction Inverter Revenue Share (%), by Application 2025 & 2033
- Figure 54: Asia Pacific Electric Vehicle Traction Inverter Volume Share (%), by Application 2025 & 2033
- Figure 55: Asia Pacific Electric Vehicle Traction Inverter Revenue (undefined), by Type 2025 & 2033
- Figure 56: Asia Pacific Electric Vehicle Traction Inverter Volume (K), by Type 2025 & 2033
- Figure 57: Asia Pacific Electric Vehicle Traction Inverter Revenue Share (%), by Type 2025 & 2033
- Figure 58: Asia Pacific Electric Vehicle Traction Inverter Volume Share (%), by Type 2025 & 2033
- Figure 59: Asia Pacific Electric Vehicle Traction Inverter Revenue (undefined), by Country 2025 & 2033
- Figure 60: Asia Pacific Electric Vehicle Traction Inverter Volume (K), by Country 2025 & 2033
- Figure 61: Asia Pacific Electric Vehicle Traction Inverter Revenue Share (%), by Country 2025 & 2033
- Figure 62: Asia Pacific Electric Vehicle Traction Inverter Volume Share (%), by Country 2025 & 2033
List of Tables
- Table 1: Global Electric Vehicle Traction Inverter Revenue undefined Forecast, by Application 2020 & 2033
- Table 2: Global Electric Vehicle Traction Inverter Volume K Forecast, by Application 2020 & 2033
- Table 3: Global Electric Vehicle Traction Inverter Revenue undefined Forecast, by Type 2020 & 2033
- Table 4: Global Electric Vehicle Traction Inverter Volume K Forecast, by Type 2020 & 2033
- Table 5: Global Electric Vehicle Traction Inverter Revenue undefined Forecast, by Region 2020 & 2033
- Table 6: Global Electric Vehicle Traction Inverter Volume K Forecast, by Region 2020 & 2033
- Table 7: Global Electric Vehicle Traction Inverter Revenue undefined Forecast, by Application 2020 & 2033
- Table 8: Global Electric Vehicle Traction Inverter Volume K Forecast, by Application 2020 & 2033
- Table 9: Global Electric Vehicle Traction Inverter Revenue undefined Forecast, by Type 2020 & 2033
- Table 10: Global Electric Vehicle Traction Inverter Volume K Forecast, by Type 2020 & 2033
- Table 11: Global Electric Vehicle Traction Inverter Revenue undefined Forecast, by Country 2020 & 2033
- Table 12: Global Electric Vehicle Traction Inverter Volume K Forecast, by Country 2020 & 2033
- Table 13: United States Electric Vehicle Traction Inverter Revenue (undefined) Forecast, by Application 2020 & 2033
- Table 14: United States Electric Vehicle Traction Inverter Volume (K) Forecast, by Application 2020 & 2033
- Table 15: Canada Electric Vehicle Traction Inverter Revenue (undefined) Forecast, by Application 2020 & 2033
- Table 16: Canada Electric Vehicle Traction Inverter Volume (K) Forecast, by Application 2020 & 2033
- Table 17: Mexico Electric Vehicle Traction Inverter Revenue (undefined) Forecast, by Application 2020 & 2033
- Table 18: Mexico Electric Vehicle Traction Inverter Volume (K) Forecast, by Application 2020 & 2033
- Table 19: Global Electric Vehicle Traction Inverter Revenue undefined Forecast, by Application 2020 & 2033
- Table 20: Global Electric Vehicle Traction Inverter Volume K Forecast, by Application 2020 & 2033
- Table 21: Global Electric Vehicle Traction Inverter Revenue undefined Forecast, by Type 2020 & 2033
- Table 22: Global Electric Vehicle Traction Inverter Volume K Forecast, by Type 2020 & 2033
- Table 23: Global Electric Vehicle Traction Inverter Revenue undefined Forecast, by Country 2020 & 2033
- Table 24: Global Electric Vehicle Traction Inverter Volume K Forecast, by Country 2020 & 2033
- Table 25: Brazil Electric Vehicle Traction Inverter Revenue (undefined) Forecast, by Application 2020 & 2033
- Table 26: Brazil Electric Vehicle Traction Inverter Volume (K) Forecast, by Application 2020 & 2033
- Table 27: Argentina Electric Vehicle Traction Inverter Revenue (undefined) Forecast, by Application 2020 & 2033
- Table 28: Argentina Electric Vehicle Traction Inverter Volume (K) Forecast, by Application 2020 & 2033
- Table 29: Rest of South America Electric Vehicle Traction Inverter Revenue (undefined) Forecast, by Application 2020 & 2033
- Table 30: Rest of South America Electric Vehicle Traction Inverter Volume (K) Forecast, by Application 2020 & 2033
- Table 31: Global Electric Vehicle Traction Inverter Revenue undefined Forecast, by Application 2020 & 2033
- Table 32: Global Electric Vehicle Traction Inverter Volume K Forecast, by Application 2020 & 2033
- Table 33: Global Electric Vehicle Traction Inverter Revenue undefined Forecast, by Type 2020 & 2033
- Table 34: Global Electric Vehicle Traction Inverter Volume K Forecast, by Type 2020 & 2033
- Table 35: Global Electric Vehicle Traction Inverter Revenue undefined Forecast, by Country 2020 & 2033
- Table 36: Global Electric Vehicle Traction Inverter Volume K Forecast, by Country 2020 & 2033
- Table 37: United Kingdom Electric Vehicle Traction Inverter Revenue (undefined) Forecast, by Application 2020 & 2033
- Table 38: United Kingdom Electric Vehicle Traction Inverter Volume (K) Forecast, by Application 2020 & 2033
- Table 39: Germany Electric Vehicle Traction Inverter Revenue (undefined) Forecast, by Application 2020 & 2033
- Table 40: Germany Electric Vehicle Traction Inverter Volume (K) Forecast, by Application 2020 & 2033
- Table 41: France Electric Vehicle Traction Inverter Revenue (undefined) Forecast, by Application 2020 & 2033
- Table 42: France Electric Vehicle Traction Inverter Volume (K) Forecast, by Application 2020 & 2033
- Table 43: Italy Electric Vehicle Traction Inverter Revenue (undefined) Forecast, by Application 2020 & 2033
- Table 44: Italy Electric Vehicle Traction Inverter Volume (K) Forecast, by Application 2020 & 2033
- Table 45: Spain Electric Vehicle Traction Inverter Revenue (undefined) Forecast, by Application 2020 & 2033
- Table 46: Spain Electric Vehicle Traction Inverter Volume (K) Forecast, by Application 2020 & 2033
- Table 47: Russia Electric Vehicle Traction Inverter Revenue (undefined) Forecast, by Application 2020 & 2033
- Table 48: Russia Electric Vehicle Traction Inverter Volume (K) Forecast, by Application 2020 & 2033
- Table 49: Benelux Electric Vehicle Traction Inverter Revenue (undefined) Forecast, by Application 2020 & 2033
- Table 50: Benelux Electric Vehicle Traction Inverter Volume (K) Forecast, by Application 2020 & 2033
- Table 51: Nordics Electric Vehicle Traction Inverter Revenue (undefined) Forecast, by Application 2020 & 2033
- Table 52: Nordics Electric Vehicle Traction Inverter Volume (K) Forecast, by Application 2020 & 2033
- Table 53: Rest of Europe Electric Vehicle Traction Inverter Revenue (undefined) Forecast, by Application 2020 & 2033
- Table 54: Rest of Europe Electric Vehicle Traction Inverter Volume (K) Forecast, by Application 2020 & 2033
- Table 55: Global Electric Vehicle Traction Inverter Revenue undefined Forecast, by Application 2020 & 2033
- Table 56: Global Electric Vehicle Traction Inverter Volume K Forecast, by Application 2020 & 2033
- Table 57: Global Electric Vehicle Traction Inverter Revenue undefined Forecast, by Type 2020 & 2033
- Table 58: Global Electric Vehicle Traction Inverter Volume K Forecast, by Type 2020 & 2033
- Table 59: Global Electric Vehicle Traction Inverter Revenue undefined Forecast, by Country 2020 & 2033
- Table 60: Global Electric Vehicle Traction Inverter Volume K Forecast, by Country 2020 & 2033
- Table 61: Turkey Electric Vehicle Traction Inverter Revenue (undefined) Forecast, by Application 2020 & 2033
- Table 62: Turkey Electric Vehicle Traction Inverter Volume (K) Forecast, by Application 2020 & 2033
- Table 63: Israel Electric Vehicle Traction Inverter Revenue (undefined) Forecast, by Application 2020 & 2033
- Table 64: Israel Electric Vehicle Traction Inverter Volume (K) Forecast, by Application 2020 & 2033
- Table 65: GCC Electric Vehicle Traction Inverter Revenue (undefined) Forecast, by Application 2020 & 2033
- Table 66: GCC Electric Vehicle Traction Inverter Volume (K) Forecast, by Application 2020 & 2033
- Table 67: North Africa Electric Vehicle Traction Inverter Revenue (undefined) Forecast, by Application 2020 & 2033
- Table 68: North Africa Electric Vehicle Traction Inverter Volume (K) Forecast, by Application 2020 & 2033
- Table 69: South Africa Electric Vehicle Traction Inverter Revenue (undefined) Forecast, by Application 2020 & 2033
- Table 70: South Africa Electric Vehicle Traction Inverter Volume (K) Forecast, by Application 2020 & 2033
- Table 71: Rest of Middle East & Africa Electric Vehicle Traction Inverter Revenue (undefined) Forecast, by Application 2020 & 2033
- Table 72: Rest of Middle East & Africa Electric Vehicle Traction Inverter Volume (K) Forecast, by Application 2020 & 2033
- Table 73: Global Electric Vehicle Traction Inverter Revenue undefined Forecast, by Application 2020 & 2033
- Table 74: Global Electric Vehicle Traction Inverter Volume K Forecast, by Application 2020 & 2033
- Table 75: Global Electric Vehicle Traction Inverter Revenue undefined Forecast, by Type 2020 & 2033
- Table 76: Global Electric Vehicle Traction Inverter Volume K Forecast, by Type 2020 & 2033
- Table 77: Global Electric Vehicle Traction Inverter Revenue undefined Forecast, by Country 2020 & 2033
- Table 78: Global Electric Vehicle Traction Inverter Volume K Forecast, by Country 2020 & 2033
- Table 79: China Electric Vehicle Traction Inverter Revenue (undefined) Forecast, by Application 2020 & 2033
- Table 80: China Electric Vehicle Traction Inverter Volume (K) Forecast, by Application 2020 & 2033
- Table 81: India Electric Vehicle Traction Inverter Revenue (undefined) Forecast, by Application 2020 & 2033
- Table 82: India Electric Vehicle Traction Inverter Volume (K) Forecast, by Application 2020 & 2033
- Table 83: Japan Electric Vehicle Traction Inverter Revenue (undefined) Forecast, by Application 2020 & 2033
- Table 84: Japan Electric Vehicle Traction Inverter Volume (K) Forecast, by Application 2020 & 2033
- Table 85: South Korea Electric Vehicle Traction Inverter Revenue (undefined) Forecast, by Application 2020 & 2033
- Table 86: South Korea Electric Vehicle Traction Inverter Volume (K) Forecast, by Application 2020 & 2033
- Table 87: ASEAN Electric Vehicle Traction Inverter Revenue (undefined) Forecast, by Application 2020 & 2033
- Table 88: ASEAN Electric Vehicle Traction Inverter Volume (K) Forecast, by Application 2020 & 2033
- Table 89: Oceania Electric Vehicle Traction Inverter Revenue (undefined) Forecast, by Application 2020 & 2033
- Table 90: Oceania Electric Vehicle Traction Inverter Volume (K) Forecast, by Application 2020 & 2033
- Table 91: Rest of Asia Pacific Electric Vehicle Traction Inverter Revenue (undefined) Forecast, by Application 2020 & 2033
- Table 92: Rest of Asia Pacific Electric Vehicle Traction Inverter Volume (K) Forecast, by Application 2020 & 2033
Frequently Asked Questions
1. What is the projected Compound Annual Growth Rate (CAGR) of the Electric Vehicle Traction Inverter?
The projected CAGR is approximately 14.7%.
2. Which companies are prominent players in the Electric Vehicle Traction Inverter?
Key companies in the market include Infineon Technologies, Silicon Labs, STMicroelectronics, Furukawa Group, ON Semiconductor, Hitachi, Semikron, Danfoss, ROHM, Mitsubishi Electric (Vincotech), Renesas Electronics, Toshiba.
3. What are the main segments of the Electric Vehicle Traction Inverter?
The market segments include Application, Type.
4. Can you provide details about the market size?
The market size is estimated to be USD XXX N/A as of 2022.
5. What are some drivers contributing to market growth?
N/A
6. What are the notable trends driving market growth?
N/A
7. Are there any restraints impacting market growth?
N/A
8. Can you provide examples of recent developments in the market?
N/A
9. What pricing options are available for accessing the report?
Pricing options include single-user, multi-user, and enterprise licenses priced at USD 3950.00, USD 5925.00, and USD 7900.00 respectively.
10. Is the market size provided in terms of value or volume?
The market size is provided in terms of value, measured in N/A and volume, measured in K.
11. Are there any specific market keywords associated with the report?
Yes, the market keyword associated with the report is "Electric Vehicle Traction Inverter," which aids in identifying and referencing the specific market segment covered.
12. How do I determine which pricing option suits my needs best?
The pricing options vary based on user requirements and access needs. Individual users may opt for single-user licenses, while businesses requiring broader access may choose multi-user or enterprise licenses for cost-effective access to the report.
13. Are there any additional resources or data provided in the Electric Vehicle Traction Inverter report?
While the report offers comprehensive insights, it's advisable to review the specific contents or supplementary materials provided to ascertain if additional resources or data are available.
14. How can I stay updated on further developments or reports in the Electric Vehicle Traction Inverter?
To stay informed about further developments, trends, and reports in the Electric Vehicle Traction Inverter, consider subscribing to industry newsletters, following relevant companies and organizations, or regularly checking reputable industry news sources and publications.
Methodology
Step 1 - Identification of Relevant Samples Size from Population Database


Step 2 - Approaches for Defining Global Market Size (Value, Volume* & Price*)

Note*: In applicable scenarios
Step 3 - Data Sources
Primary Research
- Web Analytics
- Survey Reports
- Research Institute
- Latest Research Reports
- Opinion Leaders
Secondary Research
- Annual Reports
- White Paper
- Latest Press Release
- Industry Association
- Paid Database
- Investor Presentations

Step 4 - Data Triangulation
Involves using different sources of information in order to increase the validity of a study
These sources are likely to be stakeholders in a program - participants, other researchers, program staff, other community members, and so on.
Then we put all data in single framework & apply various statistical tools to find out the dynamic on the market.
During the analysis stage, feedback from the stakeholder groups would be compared to determine areas of agreement as well as areas of divergence