

Key Insights
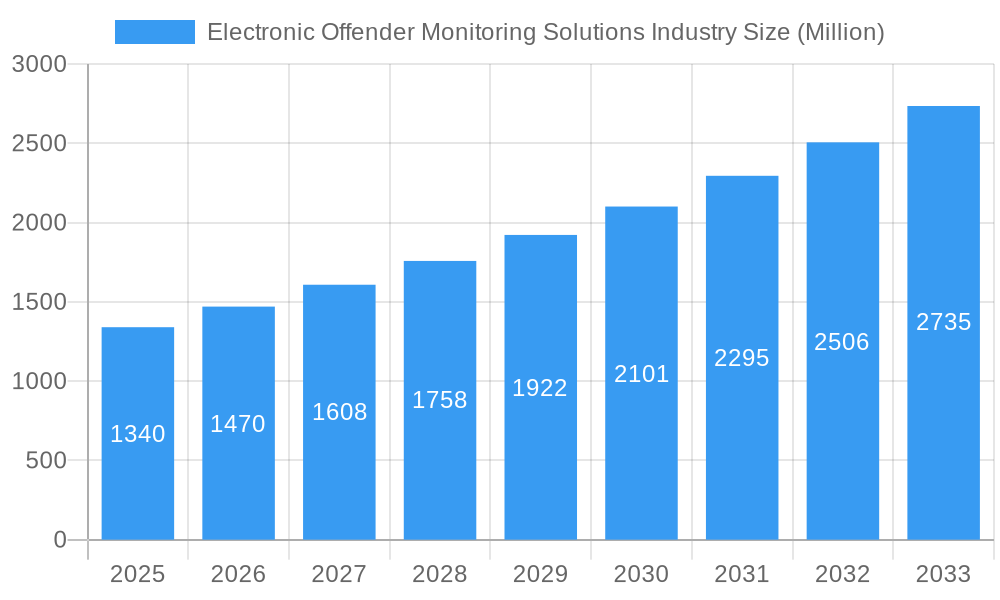
The Electronic Offender Monitoring Solutions market is poised for significant expansion, projected to reach an estimated USD 1.34 billion by 2025, with a robust Compound Annual Growth Rate (CAGR) of 9.50% expected throughout the forecast period of 2025-2033. This substantial growth is fueled by a confluence of factors, primarily driven by increasing government investments in correctional technologies, a rising trend towards community-based corrections, and the escalating need for effective recidivism reduction strategies. The technology landscape within this market is dominated by Radio Frequency (RF) and Global Positioning System (GPS) technologies, which offer advanced tracking and surveillance capabilities. Companies are increasingly focusing on providing comprehensive solutions and services that integrate hardware, software, and data analytics to offer end-to-end monitoring platforms. This holistic approach is crucial for law enforcement agencies and correctional facilities to manage offender populations more efficiently and enhance public safety.
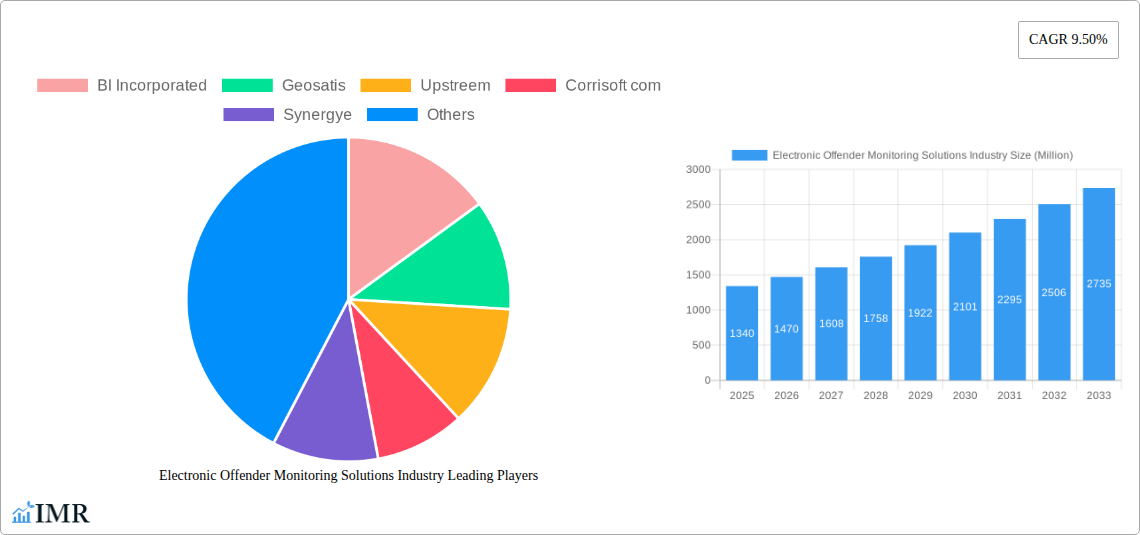
Electronic Offender Monitoring Solutions Industry Market Size (In Billion)
The market's trajectory is further shaped by emerging trends such as the integration of Artificial Intelligence (AI) and machine learning for predictive analytics, enabling proactive identification of potential risks. Wearable technologies and advanced biometric solutions are also gaining traction, offering more sophisticated and less intrusive monitoring methods. However, the market faces certain restraints, including high initial implementation costs, data privacy concerns, and the need for continuous technological upgrades to keep pace with evolving threats. Despite these challenges, the expanding adoption of electronic monitoring as an alternative to traditional incarceration, particularly for non-violent offenders, is a key catalyst for sustained growth. Companies like BI Incorporated, G4S Limited, and Securus Technologies LLC are at the forefront, innovating and expanding their offerings to cater to the evolving demands of the global justice system. The market is expected to witness strong performance across all regions, with North America and Europe likely to lead in adoption due to established correctional reforms and technological infrastructure.
Electronic Offender Monitoring Solutions Industry Company Market Share
Electronic Offender Monitoring Solutions Industry Report: Market Analysis, Growth Trends, and Future Outlook (2019-2033)
This comprehensive report offers an in-depth analysis of the Electronic Offender Monitoring Solutions market, covering its dynamic landscape, growth trajectory, and future potential. Examining the period from 2019 to 2033, with a base year of 2025 and a forecast period of 2025-2033, this report provides critical insights for stakeholders in the corrections, law enforcement, and technology sectors. Leveraging high-traffic keywords such as "electronic monitoring solutions," "offender tracking," "GPS ankle monitors," "RF monitoring," and "criminal justice technology," this report is optimized for maximum search engine visibility. We delve into parent and child market segments, offering a holistic view of the industry's evolution and its impact on public safety and recidivism reduction. All monetary values are presented in Million units.
Electronic Offender Monitoring Solutions Industry Market Dynamics & Structure
The Electronic Offender Monitoring Solutions market exhibits a moderately concentrated structure, with a few key players dominating a significant portion of the market share. Technological innovation, particularly in GPS and Radio Frequency (RF) tracking, serves as a primary driver for market growth, enabling more precise and reliable offender supervision. Stringent regulatory frameworks and evolving judicial policies mandating the use of electronic monitoring for various offenses further fuel demand. Competitive product substitutes, though present, are often outmatched by the advanced features and integrated service offerings of specialized electronic monitoring solutions. End-user demographics are diverse, encompassing government agencies, correctional facilities, and probation departments, all seeking cost-effective and efficient recidivism reduction tools. Mergers and acquisitions (M&A) trends indicate a consolidation phase, with larger companies acquiring smaller innovators to expand their product portfolios and market reach.
- Market Concentration: Key players hold approximately 60% of the market share.
- Technological Drivers: Advancements in miniaturization, battery life, and data analytics for GPS and RF devices.
- Regulatory Frameworks: Increasing adoption of electronic monitoring for bail, probation, parole, and pre-trial detention.
- Competitive Substitutes: Limited effectiveness of traditional surveillance methods compared to real-time electronic monitoring.
- End-User Demographics: Primarily government and correctional institutions, with a growing interest from private sector security firms.
- M&A Trends: Frequent acquisitions of specialized technology providers by larger security and corrections service companies.
Electronic Offender Monitoring Solutions Industry Growth Trends & Insights
The Electronic Offender Monitoring Solutions industry is poised for robust growth, driven by a confluence of factors including increasing government investment in public safety, declining recidivism rates, and advancements in monitoring technologies. The market size has seen a steady expansion throughout the historical period (2019-2024), a trend expected to accelerate in the forecast period (2025-2033). Adoption rates of electronic monitoring solutions are on the rise globally, as judicial systems seek alternatives to traditional incarceration that are both more cost-effective and potentially more effective in rehabilitating offenders. Technological disruptions, such as the integration of AI for predictive analytics and the development of more sophisticated tamper-detection mechanisms, are further enhancing the appeal and efficacy of these solutions. Consumer behavior shifts are also playing a role, with a growing public and political demand for evidence-based approaches to crime reduction.
The market size is projected to grow at a Compound Annual Growth Rate (CAGR) of approximately 8.5% from 2025 to 2033. This growth is underpinned by the increasing penetration of GPS and RF monitoring devices within correctional systems worldwide. The shift towards community-based corrections and the increasing use of electronic monitoring as a condition for bail and probation are significant contributors to this adoption. Furthermore, the development of more integrated platforms that combine monitoring hardware with sophisticated data management software and analytics is enhancing the value proposition for end-users. This technological evolution is not only improving the accuracy and reliability of monitoring but also providing deeper insights into offender behavior, aiding in personalized rehabilitation plans. The demand for these solutions is further bolstered by governmental initiatives aimed at reducing prison overcrowding and associated costs. The continuous innovation in battery technology, miniaturization of devices, and the development of more covert yet effective tracking mechanisms are creating new avenues for market expansion. As governments worldwide continue to prioritize public safety and explore cost-effective correctional strategies, the Electronic Offender Monitoring Solutions industry is set to witness sustained and significant growth.
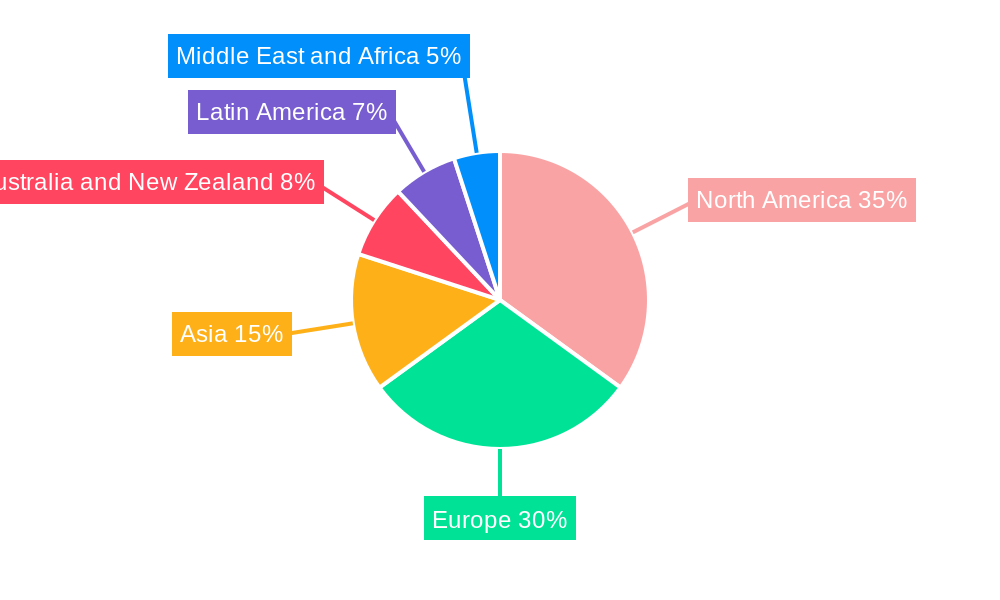
Dominant Regions, Countries, or Segments in Electronic Offender Monitoring Solutions Industry
North America, particularly the United States, currently dominates the Electronic Offender Monitoring Solutions market, driven by substantial government spending on criminal justice and a well-established infrastructure for offender supervision. The country's proactive approach to implementing advanced correctional technologies and its large offender population contribute significantly to its market leadership. The maturity of the market in this region is reflected in the high adoption rates of both Global Positioning System (GPS) and Radio Frequency (RF) technologies, with a growing emphasis on integrated solutions that combine these capabilities with cellular and other communication protocols. The "Solutions" segment, encompassing hardware, software, and installation, holds a larger market share compared to "Services" alone, though the demand for comprehensive service packages, including data analysis and technical support, is steadily increasing.
In the United States, the dominance is fueled by federal and state initiatives to improve public safety and reduce recidivism. For instance, the Denver City Council's approval of a USD 1.5 million contract with B.I. Incorporated for electronic monitoring equipment underscores the significant investment in this sector. Furthermore, B.I. Incorporated's exclusive agreement with OMNIA Partners Public Sector allows national city, county, and state government agencies to access their community corrections supervision technologies at competitive costs, streamlining procurement and accelerating adoption. This signifies a strong trend towards centralized purchasing and the utilization of cooperative purchasing organizations to reduce administrative burdens and secure favorable pricing. The competitive landscape within North America is characterized by significant market share held by key players, indicating a mature yet dynamic environment.
- Leading Region: North America, with the United States as the primary driver.
- Dominant Country: United States, owing to robust government funding and widespread adoption.
- Dominant Technology Segment: Global Positioning System (GPS) technology, followed closely by Radio Frequency (RF) monitoring, with an increasing integration of hybrid systems.
- Dominant Offering Segment: Solutions, encompassing both hardware and software, as well as installation and maintenance.
- Key Drivers in North America:
- High government expenditure on public safety and corrections.
- Large offender population requiring supervision.
- Proactive adoption of technological advancements in criminal justice.
- Legislative mandates for electronic monitoring in various offense categories.
- Cost-effectiveness compared to incarceration.
The growth potential in North America remains substantial, driven by ongoing technological innovations and the continuous need for efficient offender management. While other regions like Europe are showing significant growth due to evolving criminal justice policies, North America's established market infrastructure and consistent investment continue to solidify its dominant position.
Electronic Offender Monitoring Solutions Industry Product Landscape
The product landscape of the Electronic Offender Monitoring Solutions industry is characterized by continuous innovation focused on enhancing accuracy, reliability, and user-friendliness. Advanced GPS trackers offer real-time location data with high precision, while RF systems provide localized monitoring around designated perimeters. Current innovations include the development of biometric identification features, such as fingerprint or facial recognition, integrated into the monitoring devices to prevent offender identity spoofing. Tamper-detection technology has also seen significant advancements, with new sensors capable of detecting cuts, removals, or signal jamming with immediate alerts. Furthermore, the integration of smart home technology and mobile applications allows for remote check-ins and a more holistic approach to offender supervision, improving compliance and reducing the need for frequent physical check-ins.
Key Drivers, Barriers & Challenges in Electronic Offender Monitoring Solutions Industry
Key Drivers:
- Public Safety Mandates: Increasing governmental focus on reducing crime and recidivism rates.
- Cost-Effectiveness: Electronic monitoring is generally more economical than incarceration.
- Technological Advancements: Development of more sophisticated and reliable GPS, RF, and biometric monitoring technologies.
- Overcrowding in Prisons: The need for alternatives to traditional incarceration.
- Rehabilitation Focus: Desire to support offender reintegration into society through supervised community corrections.
Barriers & Challenges:
- Data Security and Privacy Concerns: Protecting sensitive offender data from breaches.
- Regulatory Hurdles: Evolving legal frameworks and compliance requirements.
- Initial Implementation Costs: Significant upfront investment in hardware and software.
- Technological Obsolescence: Rapid advancements requiring frequent system upgrades.
- Offender Tampering and Circumvention: Continuous development of countermeasures against offender attempts to disable or evade monitoring.
- Supply Chain Disruptions: Potential for delays in the procurement of critical electronic components.
Emerging Opportunities in Electronic Offender Monitoring Solutions Industry
Emerging opportunities within the Electronic Offender Monitoring Solutions industry lie in the expansion of services beyond basic tracking. The integration of Artificial Intelligence (AI) and machine learning for predictive analytics presents a significant avenue for growth, enabling the identification of high-risk offenders and proactive intervention strategies. The development of wearable devices that monitor not only location but also physiological data (e.g., heart rate, stress levels) could offer a more comprehensive understanding of offender well-being and risk factors. Furthermore, exploring applications in domestic violence situations, mental health monitoring, and probation for juvenile offenders presents untapped markets. The growing demand for data-driven decision-making within correctional systems creates an opportunity for providers who can offer robust analytics and reporting capabilities, transforming raw monitoring data into actionable intelligence for case managers and parole boards.
Growth Accelerators in the Electronic Offender Monitoring Solutions Industry Industry
The long-term growth of the Electronic Offender Monitoring Solutions industry is significantly propelled by continuous technological breakthroughs, such as the integration of 5G connectivity for real-time, high-bandwidth data transmission, and the miniaturization of devices for greater discretion and comfort for wearers. Strategic partnerships between technology providers, software developers, and correctional agencies are crucial for developing integrated and customized solutions. Market expansion strategies, including entering new geographical markets with evolving criminal justice reforms and tailoring offerings to specific regional needs, will further accelerate growth. The increasing acceptance and preference for community-based corrections over incarceration will continue to be a major catalyst, driving demand for reliable and innovative electronic monitoring systems.
Key Players Shaping the Electronic Offender Monitoring Solutions Industry Market
- BI Incorporated
- Geosatis
- Upstreem
- Corrisoft com
- Synergye
- Supercom
- AMOS Spacecom
- Buddi AI
- G4S Limited
- Attenti
- Securus Technologies LLC
- Alcohol Monitoring Systems Inc (SCRAM Systems)
- TRACK GROUP
Notable Milestones in Electronic Offender Monitoring Solutions Industry Sector
- October 2022: B.I. Incorporated entered an exclusive agreement with OMNIA Partners Public Sector, allowing national government agencies to contract for its community corrections supervision technologies at competitive costs, bypassing lengthy RFP processes.
- January 2022: The Denver City Council approved a USD 1.5 million contract with B.I. Incorporated for electronic monitoring equipment, extending through January 31, 2025.
In-Depth Electronic Offender Monitoring Solutions Industry Market Outlook
The future outlook for the Electronic Offender Monitoring Solutions industry is exceptionally bright, propelled by a confluence of factors that promise sustained growth and innovation. The increasing global emphasis on smarter criminal justice systems, cost-effective correctional strategies, and recidivism reduction will continue to fuel demand. Advancements in AI-driven analytics, IoT integration, and more sophisticated biometric authentication will create a new generation of monitoring solutions that offer unprecedented levels of insight and control. Strategic collaborations between government agencies, technology developers, and rehabilitation service providers will be pivotal in creating holistic ecosystems for offender management. As societies increasingly prioritize rehabilitation and community reintegration, electronic monitoring will evolve from a punitive tool to an integral component of a reformed justice system, presenting substantial market potential and rewarding strategic opportunities for stakeholders.
Electronic Offender Monitoring Solutions Industry Segmentation
-
1. Technology
- 1.1. Radio Frequency (RF)
- 1.2. Global Positioning System (GPS)
-
2. Offering
- 2.1. Solutions
- 2.2. Services
Electronic Offender Monitoring Solutions Industry Segmentation By Geography
- 1. North America
- 2. Europe
- 3. Asia
- 4. Australia and New Zealand
- 5. Latin America
- 6. Middle East and Africa
Electronic Offender Monitoring Solutions Industry Regional Market Share
Geographic Coverage of Electronic Offender Monitoring Solutions Industry
Electronic Offender Monitoring Solutions Industry REPORT HIGHLIGHTS
| Aspects | Details |
|---|---|
| Study Period | 2020-2034 |
| Base Year | 2025 |
| Estimated Year | 2026 |
| Forecast Period | 2026-2034 |
| Historical Period | 2020-2025 |
| Growth Rate | CAGR of 9.50% from 2020-2034 |
| Segmentation |
|
Table of Contents
- 1. Introduction
- 1.1. Research Scope
- 1.2. Market Segmentation
- 1.3. Research Objective
- 1.4. Definitions and Assumptions
- 2. Executive Summary
- 2.1. Market Snapshot
- 3. Market Dynamics
- 3.1. Market Drivers
- 3.2. Market Restrains
- 3.3. Market Trends
- 3.4. Market Opportunities
- 4. Market Factor Analysis
- 4.1. Porters Five Forces
- 4.1.1. Bargaining Power of Suppliers
- 4.1.2. Bargaining Power of Buyers
- 4.1.3. Threat of New Entrants
- 4.1.4. Threat of Substitutes
- 4.1.5. Competitive Rivalry
- 4.2. PESTEL analysis
- 4.3. BCG Analysis
- 4.3.1. Stars (High Growth, High Market Share)
- 4.3.2. Cash Cows (Low Growth, High Market Share)
- 4.3.3. Question Mark (High Growth, Low Market Share)
- 4.3.4. Dogs (Low Growth, Low Market Share)
- 4.4. Ansoff Matrix Analysis
- 4.5. Supply Chain Analysis
- 4.6. Regulatory Landscape
- 4.7. Current Market Potential and Opportunity Assessment (TAM–SAM–SOM Framework)
- 4.8. IMR Analyst Note
- 4.1. Porters Five Forces
- 5. Market Analysis, Insights and Forecast 2021-2033
- 5.1. Market Analysis, Insights and Forecast - by Technology
- 5.1.1. Radio Frequency (RF)
- 5.1.2. Global Positioning System (GPS)
- 5.2. Market Analysis, Insights and Forecast - by Offering
- 5.2.1. Solutions
- 5.2.2. Services
- 5.3. Market Analysis, Insights and Forecast - by Region
- 5.3.1. North America
- 5.3.2. Europe
- 5.3.3. Asia
- 5.3.4. Australia and New Zealand
- 5.3.5. Latin America
- 5.3.6. Middle East and Africa
- 5.1. Market Analysis, Insights and Forecast - by Technology
- 6. Global Electronic Offender Monitoring Solutions Industry Analysis, Insights and Forecast, 2021-2033
- 6.1. Market Analysis, Insights and Forecast - by Technology
- 6.1.1. Radio Frequency (RF)
- 6.1.2. Global Positioning System (GPS)
- 6.2. Market Analysis, Insights and Forecast - by Offering
- 6.2.1. Solutions
- 6.2.2. Services
- 6.1. Market Analysis, Insights and Forecast - by Technology
- 7. North America Electronic Offender Monitoring Solutions Industry Analysis, Insights and Forecast, 2020-2032
- 7.1. Market Analysis, Insights and Forecast - by Technology
- 7.1.1. Radio Frequency (RF)
- 7.1.2. Global Positioning System (GPS)
- 7.2. Market Analysis, Insights and Forecast - by Offering
- 7.2.1. Solutions
- 7.2.2. Services
- 7.1. Market Analysis, Insights and Forecast - by Technology
- 8. Europe Electronic Offender Monitoring Solutions Industry Analysis, Insights and Forecast, 2020-2032
- 8.1. Market Analysis, Insights and Forecast - by Technology
- 8.1.1. Radio Frequency (RF)
- 8.1.2. Global Positioning System (GPS)
- 8.2. Market Analysis, Insights and Forecast - by Offering
- 8.2.1. Solutions
- 8.2.2. Services
- 8.1. Market Analysis, Insights and Forecast - by Technology
- 9. Asia Electronic Offender Monitoring Solutions Industry Analysis, Insights and Forecast, 2020-2032
- 9.1. Market Analysis, Insights and Forecast - by Technology
- 9.1.1. Radio Frequency (RF)
- 9.1.2. Global Positioning System (GPS)
- 9.2. Market Analysis, Insights and Forecast - by Offering
- 9.2.1. Solutions
- 9.2.2. Services
- 9.1. Market Analysis, Insights and Forecast - by Technology
- 10. Australia and New Zealand Electronic Offender Monitoring Solutions Industry Analysis, Insights and Forecast, 2020-2032
- 10.1. Market Analysis, Insights and Forecast - by Technology
- 10.1.1. Radio Frequency (RF)
- 10.1.2. Global Positioning System (GPS)
- 10.2. Market Analysis, Insights and Forecast - by Offering
- 10.2.1. Solutions
- 10.2.2. Services
- 10.1. Market Analysis, Insights and Forecast - by Technology
- 11. Latin America Electronic Offender Monitoring Solutions Industry Analysis, Insights and Forecast, 2020-2032
- 11.1. Market Analysis, Insights and Forecast - by Technology
- 11.1.1. Radio Frequency (RF)
- 11.1.2. Global Positioning System (GPS)
- 11.2. Market Analysis, Insights and Forecast - by Offering
- 11.2.1. Solutions
- 11.2.2. Services
- 11.1. Market Analysis, Insights and Forecast - by Technology
- 12. Middle East and Africa Electronic Offender Monitoring Solutions Industry Analysis, Insights and Forecast, 2020-2032
- 12.1. Market Analysis, Insights and Forecast - by Technology
- 12.1.1. Radio Frequency (RF)
- 12.1.2. Global Positioning System (GPS)
- 12.2. Market Analysis, Insights and Forecast - by Offering
- 12.2.1. Solutions
- 12.2.2. Services
- 12.1. Market Analysis, Insights and Forecast - by Technology
- 13. Competitive Analysis
- 13.1. Company Profiles
- 13.1.1 BI Incorporated
- 13.1.1.1. Company Overview
- 13.1.1.2. Products
- 13.1.1.3. Company Financials
- 13.1.1.4. SWOT Analysis
- 13.1.2 Geosatis
- 13.1.2.1. Company Overview
- 13.1.2.2. Products
- 13.1.2.3. Company Financials
- 13.1.2.4. SWOT Analysis
- 13.1.3 Upstreem
- 13.1.3.1. Company Overview
- 13.1.3.2. Products
- 13.1.3.3. Company Financials
- 13.1.3.4. SWOT Analysis
- 13.1.4 Corrisoft com
- 13.1.4.1. Company Overview
- 13.1.4.2. Products
- 13.1.4.3. Company Financials
- 13.1.4.4. SWOT Analysis
- 13.1.5 Synergye
- 13.1.5.1. Company Overview
- 13.1.5.2. Products
- 13.1.5.3. Company Financials
- 13.1.5.4. SWOT Analysis
- 13.1.6 Supercom
- 13.1.6.1. Company Overview
- 13.1.6.2. Products
- 13.1.6.3. Company Financials
- 13.1.6.4. SWOT Analysis
- 13.1.7 AMOS Spacecom
- 13.1.7.1. Company Overview
- 13.1.7.2. Products
- 13.1.7.3. Company Financials
- 13.1.7.4. SWOT Analysis
- 13.1.8 Buddi AI
- 13.1.8.1. Company Overview
- 13.1.8.2. Products
- 13.1.8.3. Company Financials
- 13.1.8.4. SWOT Analysis
- 13.1.9 G4S Limited
- 13.1.9.1. Company Overview
- 13.1.9.2. Products
- 13.1.9.3. Company Financials
- 13.1.9.4. SWOT Analysis
- 13.1.10 Attenti
- 13.1.10.1. Company Overview
- 13.1.10.2. Products
- 13.1.10.3. Company Financials
- 13.1.10.4. SWOT Analysis
- 13.1.11 Securus Technologies LLC
- 13.1.11.1. Company Overview
- 13.1.11.2. Products
- 13.1.11.3. Company Financials
- 13.1.11.4. SWOT Analysis
- 13.1.12 Alcohol Monitoring Systems Inc (SCRAM Systems)
- 13.1.12.1. Company Overview
- 13.1.12.2. Products
- 13.1.12.3. Company Financials
- 13.1.12.4. SWOT Analysis
- 13.1.13 TRACK GROUP
- 13.1.13.1. Company Overview
- 13.1.13.2. Products
- 13.1.13.3. Company Financials
- 13.1.13.4. SWOT Analysis
- 13.1.1 BI Incorporated
- 13.2. Market Entropy
- 13.2.1 Company's Key Areas Served
- 13.2.2 Recent Developments
- 13.3. Company Market Share Analysis 2025
- 13.3.1 Top 5 Companies Market Share Analysis
- 13.3.2 Top 3 Companies Market Share Analysis
- 13.4. List of Potential Customers
- 14. Research Methodology
List of Figures
- Figure 1: Global Electronic Offender Monitoring Solutions Industry Revenue Breakdown (Million, %) by Region 2025 & 2033
- Figure 2: Global Electronic Offender Monitoring Solutions Industry Volume Breakdown (K Unit, %) by Region 2025 & 2033
- Figure 3: North America Electronic Offender Monitoring Solutions Industry Revenue (Million), by Technology 2025 & 2033
- Figure 4: North America Electronic Offender Monitoring Solutions Industry Volume (K Unit), by Technology 2025 & 2033
- Figure 5: North America Electronic Offender Monitoring Solutions Industry Revenue Share (%), by Technology 2025 & 2033
- Figure 6: North America Electronic Offender Monitoring Solutions Industry Volume Share (%), by Technology 2025 & 2033
- Figure 7: North America Electronic Offender Monitoring Solutions Industry Revenue (Million), by Offering 2025 & 2033
- Figure 8: North America Electronic Offender Monitoring Solutions Industry Volume (K Unit), by Offering 2025 & 2033
- Figure 9: North America Electronic Offender Monitoring Solutions Industry Revenue Share (%), by Offering 2025 & 2033
- Figure 10: North America Electronic Offender Monitoring Solutions Industry Volume Share (%), by Offering 2025 & 2033
- Figure 11: North America Electronic Offender Monitoring Solutions Industry Revenue (Million), by Country 2025 & 2033
- Figure 12: North America Electronic Offender Monitoring Solutions Industry Volume (K Unit), by Country 2025 & 2033
- Figure 13: North America Electronic Offender Monitoring Solutions Industry Revenue Share (%), by Country 2025 & 2033
- Figure 14: North America Electronic Offender Monitoring Solutions Industry Volume Share (%), by Country 2025 & 2033
- Figure 15: Europe Electronic Offender Monitoring Solutions Industry Revenue (Million), by Technology 2025 & 2033
- Figure 16: Europe Electronic Offender Monitoring Solutions Industry Volume (K Unit), by Technology 2025 & 2033
- Figure 17: Europe Electronic Offender Monitoring Solutions Industry Revenue Share (%), by Technology 2025 & 2033
- Figure 18: Europe Electronic Offender Monitoring Solutions Industry Volume Share (%), by Technology 2025 & 2033
- Figure 19: Europe Electronic Offender Monitoring Solutions Industry Revenue (Million), by Offering 2025 & 2033
- Figure 20: Europe Electronic Offender Monitoring Solutions Industry Volume (K Unit), by Offering 2025 & 2033
- Figure 21: Europe Electronic Offender Monitoring Solutions Industry Revenue Share (%), by Offering 2025 & 2033
- Figure 22: Europe Electronic Offender Monitoring Solutions Industry Volume Share (%), by Offering 2025 & 2033
- Figure 23: Europe Electronic Offender Monitoring Solutions Industry Revenue (Million), by Country 2025 & 2033
- Figure 24: Europe Electronic Offender Monitoring Solutions Industry Volume (K Unit), by Country 2025 & 2033
- Figure 25: Europe Electronic Offender Monitoring Solutions Industry Revenue Share (%), by Country 2025 & 2033
- Figure 26: Europe Electronic Offender Monitoring Solutions Industry Volume Share (%), by Country 2025 & 2033
- Figure 27: Asia Electronic Offender Monitoring Solutions Industry Revenue (Million), by Technology 2025 & 2033
- Figure 28: Asia Electronic Offender Monitoring Solutions Industry Volume (K Unit), by Technology 2025 & 2033
- Figure 29: Asia Electronic Offender Monitoring Solutions Industry Revenue Share (%), by Technology 2025 & 2033
- Figure 30: Asia Electronic Offender Monitoring Solutions Industry Volume Share (%), by Technology 2025 & 2033
- Figure 31: Asia Electronic Offender Monitoring Solutions Industry Revenue (Million), by Offering 2025 & 2033
- Figure 32: Asia Electronic Offender Monitoring Solutions Industry Volume (K Unit), by Offering 2025 & 2033
- Figure 33: Asia Electronic Offender Monitoring Solutions Industry Revenue Share (%), by Offering 2025 & 2033
- Figure 34: Asia Electronic Offender Monitoring Solutions Industry Volume Share (%), by Offering 2025 & 2033
- Figure 35: Asia Electronic Offender Monitoring Solutions Industry Revenue (Million), by Country 2025 & 2033
- Figure 36: Asia Electronic Offender Monitoring Solutions Industry Volume (K Unit), by Country 2025 & 2033
- Figure 37: Asia Electronic Offender Monitoring Solutions Industry Revenue Share (%), by Country 2025 & 2033
- Figure 38: Asia Electronic Offender Monitoring Solutions Industry Volume Share (%), by Country 2025 & 2033
- Figure 39: Australia and New Zealand Electronic Offender Monitoring Solutions Industry Revenue (Million), by Technology 2025 & 2033
- Figure 40: Australia and New Zealand Electronic Offender Monitoring Solutions Industry Volume (K Unit), by Technology 2025 & 2033
- Figure 41: Australia and New Zealand Electronic Offender Monitoring Solutions Industry Revenue Share (%), by Technology 2025 & 2033
- Figure 42: Australia and New Zealand Electronic Offender Monitoring Solutions Industry Volume Share (%), by Technology 2025 & 2033
- Figure 43: Australia and New Zealand Electronic Offender Monitoring Solutions Industry Revenue (Million), by Offering 2025 & 2033
- Figure 44: Australia and New Zealand Electronic Offender Monitoring Solutions Industry Volume (K Unit), by Offering 2025 & 2033
- Figure 45: Australia and New Zealand Electronic Offender Monitoring Solutions Industry Revenue Share (%), by Offering 2025 & 2033
- Figure 46: Australia and New Zealand Electronic Offender Monitoring Solutions Industry Volume Share (%), by Offering 2025 & 2033
- Figure 47: Australia and New Zealand Electronic Offender Monitoring Solutions Industry Revenue (Million), by Country 2025 & 2033
- Figure 48: Australia and New Zealand Electronic Offender Monitoring Solutions Industry Volume (K Unit), by Country 2025 & 2033
- Figure 49: Australia and New Zealand Electronic Offender Monitoring Solutions Industry Revenue Share (%), by Country 2025 & 2033
- Figure 50: Australia and New Zealand Electronic Offender Monitoring Solutions Industry Volume Share (%), by Country 2025 & 2033
- Figure 51: Latin America Electronic Offender Monitoring Solutions Industry Revenue (Million), by Technology 2025 & 2033
- Figure 52: Latin America Electronic Offender Monitoring Solutions Industry Volume (K Unit), by Technology 2025 & 2033
- Figure 53: Latin America Electronic Offender Monitoring Solutions Industry Revenue Share (%), by Technology 2025 & 2033
- Figure 54: Latin America Electronic Offender Monitoring Solutions Industry Volume Share (%), by Technology 2025 & 2033
- Figure 55: Latin America Electronic Offender Monitoring Solutions Industry Revenue (Million), by Offering 2025 & 2033
- Figure 56: Latin America Electronic Offender Monitoring Solutions Industry Volume (K Unit), by Offering 2025 & 2033
- Figure 57: Latin America Electronic Offender Monitoring Solutions Industry Revenue Share (%), by Offering 2025 & 2033
- Figure 58: Latin America Electronic Offender Monitoring Solutions Industry Volume Share (%), by Offering 2025 & 2033
- Figure 59: Latin America Electronic Offender Monitoring Solutions Industry Revenue (Million), by Country 2025 & 2033
- Figure 60: Latin America Electronic Offender Monitoring Solutions Industry Volume (K Unit), by Country 2025 & 2033
- Figure 61: Latin America Electronic Offender Monitoring Solutions Industry Revenue Share (%), by Country 2025 & 2033
- Figure 62: Latin America Electronic Offender Monitoring Solutions Industry Volume Share (%), by Country 2025 & 2033
- Figure 63: Middle East and Africa Electronic Offender Monitoring Solutions Industry Revenue (Million), by Technology 2025 & 2033
- Figure 64: Middle East and Africa Electronic Offender Monitoring Solutions Industry Volume (K Unit), by Technology 2025 & 2033
- Figure 65: Middle East and Africa Electronic Offender Monitoring Solutions Industry Revenue Share (%), by Technology 2025 & 2033
- Figure 66: Middle East and Africa Electronic Offender Monitoring Solutions Industry Volume Share (%), by Technology 2025 & 2033
- Figure 67: Middle East and Africa Electronic Offender Monitoring Solutions Industry Revenue (Million), by Offering 2025 & 2033
- Figure 68: Middle East and Africa Electronic Offender Monitoring Solutions Industry Volume (K Unit), by Offering 2025 & 2033
- Figure 69: Middle East and Africa Electronic Offender Monitoring Solutions Industry Revenue Share (%), by Offering 2025 & 2033
- Figure 70: Middle East and Africa Electronic Offender Monitoring Solutions Industry Volume Share (%), by Offering 2025 & 2033
- Figure 71: Middle East and Africa Electronic Offender Monitoring Solutions Industry Revenue (Million), by Country 2025 & 2033
- Figure 72: Middle East and Africa Electronic Offender Monitoring Solutions Industry Volume (K Unit), by Country 2025 & 2033
- Figure 73: Middle East and Africa Electronic Offender Monitoring Solutions Industry Revenue Share (%), by Country 2025 & 2033
- Figure 74: Middle East and Africa Electronic Offender Monitoring Solutions Industry Volume Share (%), by Country 2025 & 2033
List of Tables
- Table 1: Global Electronic Offender Monitoring Solutions Industry Revenue Million Forecast, by Technology 2020 & 2033
- Table 2: Global Electronic Offender Monitoring Solutions Industry Volume K Unit Forecast, by Technology 2020 & 2033
- Table 3: Global Electronic Offender Monitoring Solutions Industry Revenue Million Forecast, by Offering 2020 & 2033
- Table 4: Global Electronic Offender Monitoring Solutions Industry Volume K Unit Forecast, by Offering 2020 & 2033
- Table 5: Global Electronic Offender Monitoring Solutions Industry Revenue Million Forecast, by Region 2020 & 2033
- Table 6: Global Electronic Offender Monitoring Solutions Industry Volume K Unit Forecast, by Region 2020 & 2033
- Table 7: Global Electronic Offender Monitoring Solutions Industry Revenue Million Forecast, by Technology 2020 & 2033
- Table 8: Global Electronic Offender Monitoring Solutions Industry Volume K Unit Forecast, by Technology 2020 & 2033
- Table 9: Global Electronic Offender Monitoring Solutions Industry Revenue Million Forecast, by Offering 2020 & 2033
- Table 10: Global Electronic Offender Monitoring Solutions Industry Volume K Unit Forecast, by Offering 2020 & 2033
- Table 11: Global Electronic Offender Monitoring Solutions Industry Revenue Million Forecast, by Country 2020 & 2033
- Table 12: Global Electronic Offender Monitoring Solutions Industry Volume K Unit Forecast, by Country 2020 & 2033
- Table 13: Global Electronic Offender Monitoring Solutions Industry Revenue Million Forecast, by Technology 2020 & 2033
- Table 14: Global Electronic Offender Monitoring Solutions Industry Volume K Unit Forecast, by Technology 2020 & 2033
- Table 15: Global Electronic Offender Monitoring Solutions Industry Revenue Million Forecast, by Offering 2020 & 2033
- Table 16: Global Electronic Offender Monitoring Solutions Industry Volume K Unit Forecast, by Offering 2020 & 2033
- Table 17: Global Electronic Offender Monitoring Solutions Industry Revenue Million Forecast, by Country 2020 & 2033
- Table 18: Global Electronic Offender Monitoring Solutions Industry Volume K Unit Forecast, by Country 2020 & 2033
- Table 19: Global Electronic Offender Monitoring Solutions Industry Revenue Million Forecast, by Technology 2020 & 2033
- Table 20: Global Electronic Offender Monitoring Solutions Industry Volume K Unit Forecast, by Technology 2020 & 2033
- Table 21: Global Electronic Offender Monitoring Solutions Industry Revenue Million Forecast, by Offering 2020 & 2033
- Table 22: Global Electronic Offender Monitoring Solutions Industry Volume K Unit Forecast, by Offering 2020 & 2033
- Table 23: Global Electronic Offender Monitoring Solutions Industry Revenue Million Forecast, by Country 2020 & 2033
- Table 24: Global Electronic Offender Monitoring Solutions Industry Volume K Unit Forecast, by Country 2020 & 2033
- Table 25: Global Electronic Offender Monitoring Solutions Industry Revenue Million Forecast, by Technology 2020 & 2033
- Table 26: Global Electronic Offender Monitoring Solutions Industry Volume K Unit Forecast, by Technology 2020 & 2033
- Table 27: Global Electronic Offender Monitoring Solutions Industry Revenue Million Forecast, by Offering 2020 & 2033
- Table 28: Global Electronic Offender Monitoring Solutions Industry Volume K Unit Forecast, by Offering 2020 & 2033
- Table 29: Global Electronic Offender Monitoring Solutions Industry Revenue Million Forecast, by Country 2020 & 2033
- Table 30: Global Electronic Offender Monitoring Solutions Industry Volume K Unit Forecast, by Country 2020 & 2033
- Table 31: Global Electronic Offender Monitoring Solutions Industry Revenue Million Forecast, by Technology 2020 & 2033
- Table 32: Global Electronic Offender Monitoring Solutions Industry Volume K Unit Forecast, by Technology 2020 & 2033
- Table 33: Global Electronic Offender Monitoring Solutions Industry Revenue Million Forecast, by Offering 2020 & 2033
- Table 34: Global Electronic Offender Monitoring Solutions Industry Volume K Unit Forecast, by Offering 2020 & 2033
- Table 35: Global Electronic Offender Monitoring Solutions Industry Revenue Million Forecast, by Country 2020 & 2033
- Table 36: Global Electronic Offender Monitoring Solutions Industry Volume K Unit Forecast, by Country 2020 & 2033
- Table 37: Global Electronic Offender Monitoring Solutions Industry Revenue Million Forecast, by Technology 2020 & 2033
- Table 38: Global Electronic Offender Monitoring Solutions Industry Volume K Unit Forecast, by Technology 2020 & 2033
- Table 39: Global Electronic Offender Monitoring Solutions Industry Revenue Million Forecast, by Offering 2020 & 2033
- Table 40: Global Electronic Offender Monitoring Solutions Industry Volume K Unit Forecast, by Offering 2020 & 2033
- Table 41: Global Electronic Offender Monitoring Solutions Industry Revenue Million Forecast, by Country 2020 & 2033
- Table 42: Global Electronic Offender Monitoring Solutions Industry Volume K Unit Forecast, by Country 2020 & 2033
Frequently Asked Questions
1. What is the projected Compound Annual Growth Rate (CAGR) of the Electronic Offender Monitoring Solutions Industry?
The projected CAGR is approximately 9.50%.
2. Which companies are prominent players in the Electronic Offender Monitoring Solutions Industry?
Key companies in the market include BI Incorporated, Geosatis, Upstreem, Corrisoft com, Synergye, Supercom, AMOS Spacecom, Buddi AI, G4S Limited, Attenti, Securus Technologies LLC, Alcohol Monitoring Systems Inc (SCRAM Systems), TRACK GROUP.
3. What are the main segments of the Electronic Offender Monitoring Solutions Industry?
The market segments include Technology, Offering.
4. Can you provide details about the market size?
The market size is estimated to be USD 1.34 Million as of 2022.
5. What are some drivers contributing to market growth?
The Prison Overcrowding Worsened by the COVID-19 Pandemic; Growing Adoption of Victim Protection Solutions.
6. What are the notable trends driving market growth?
Global Positioning System Driving the Market Growth.
7. Are there any restraints impacting market growth?
Electronic Offender Monitoring Devices Can Be Tampered by Offenders.
8. Can you provide examples of recent developments in the market?
October 2022: B.I. Incorporated, the U.S. player for electronic monitoring products and services, entered an exclusive agreement with OMNIA Partners Public Sector that allowed national city, county, and state government agencies to contract with B.I. for its community corrections supervision technologies at competitive costs. Participating agencies save time and effort by skipping the lengthy Request for Proposal process.
9. What pricing options are available for accessing the report?
Pricing options include single-user, multi-user, and enterprise licenses priced at USD 4750, USD 5250, and USD 8750 respectively.
10. Is the market size provided in terms of value or volume?
The market size is provided in terms of value, measured in Million and volume, measured in K Unit.
11. Are there any specific market keywords associated with the report?
Yes, the market keyword associated with the report is "Electronic Offender Monitoring Solutions Industry," which aids in identifying and referencing the specific market segment covered.
12. How do I determine which pricing option suits my needs best?
The pricing options vary based on user requirements and access needs. Individual users may opt for single-user licenses, while businesses requiring broader access may choose multi-user or enterprise licenses for cost-effective access to the report.
13. Are there any additional resources or data provided in the Electronic Offender Monitoring Solutions Industry report?
While the report offers comprehensive insights, it's advisable to review the specific contents or supplementary materials provided to ascertain if additional resources or data are available.
14. How can I stay updated on further developments or reports in the Electronic Offender Monitoring Solutions Industry?
To stay informed about further developments, trends, and reports in the Electronic Offender Monitoring Solutions Industry, consider subscribing to industry newsletters, following relevant companies and organizations, or regularly checking reputable industry news sources and publications.
Methodology
Step 1 - Identification of Relevant Samples Size from Population Database


Step 2 - Approaches for Defining Global Market Size (Value, Volume* & Price*)

Note*: In applicable scenarios
Step 3 - Data Sources
Primary Research
- Web Analytics
- Survey Reports
- Research Institute
- Latest Research Reports
- Opinion Leaders
Secondary Research
- Annual Reports
- White Paper
- Latest Press Release
- Industry Association
- Paid Database
- Investor Presentations

Step 4 - Data Triangulation
Involves using different sources of information in order to increase the validity of a study
These sources are likely to be stakeholders in a program - participants, other researchers, program staff, other community members, and so on.
Then we put all data in single framework & apply various statistical tools to find out the dynamic on the market.
During the analysis stage, feedback from the stakeholder groups would be compared to determine areas of agreement as well as areas of divergence