

Key Insights
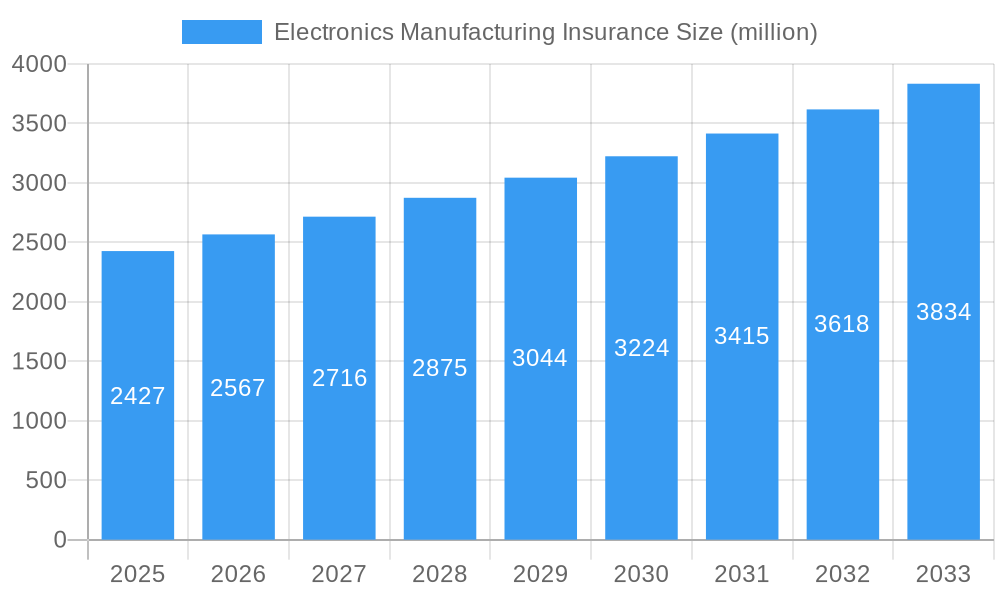
The global Electronics Manufacturing Insurance market is poised for significant growth, projected to reach $2427 million by 2025, with a Compound Annual Growth Rate (CAGR) of 5.8% over the forecast period of 2025-2033. This robust expansion is driven by the increasing complexity and value of electronic components, coupled with the ever-present risks associated with manufacturing processes, supply chain disruptions, and product liability. The burgeoning demand for sophisticated electronics across diverse sectors such as automotive, telecommunications, consumer electronics, and industrial automation directly fuels the need for comprehensive insurance solutions. As the industry navigates evolving technological landscapes, including the rapid adoption of IoT, AI, and advanced semiconductor technologies, the potential for costly errors, equipment failures, and intellectual property disputes escalates, making robust insurance coverage indispensable. Furthermore, stringent regulatory requirements and a growing awareness of potential financial repercussions from unforeseen events are compelling manufacturers to invest more heavily in specialized insurance products.
Electronics Manufacturing Insurance Market Size (In Billion)
The market is segmented by application, with Semiconductor Manufacturers and Electronic Component Manufacturers representing the largest segments due to the high value and critical nature of their operations. Distributors and 'Others' also contribute significantly, reflecting the extended supply chain's vulnerability. In terms of insurance type, Property Insurance remains a cornerstone, covering damage to facilities and equipment. However, Liability Insurance is gaining substantial traction, encompassing product liability, errors and omissions, and cyber liability, as these risks become more prominent with increasing product sophistication and interconnectedness. Geographically, Asia Pacific, particularly China and India, is expected to be a dominant region, driven by its status as a global manufacturing hub for electronics. North America and Europe also represent substantial markets, characterized by established players and a strong emphasis on technological innovation and risk management. Key players like AIG, Allianz, and Liberty Mutual are actively shaping the market through innovative product offerings and strategic partnerships to meet the evolving needs of the electronics manufacturing sector.
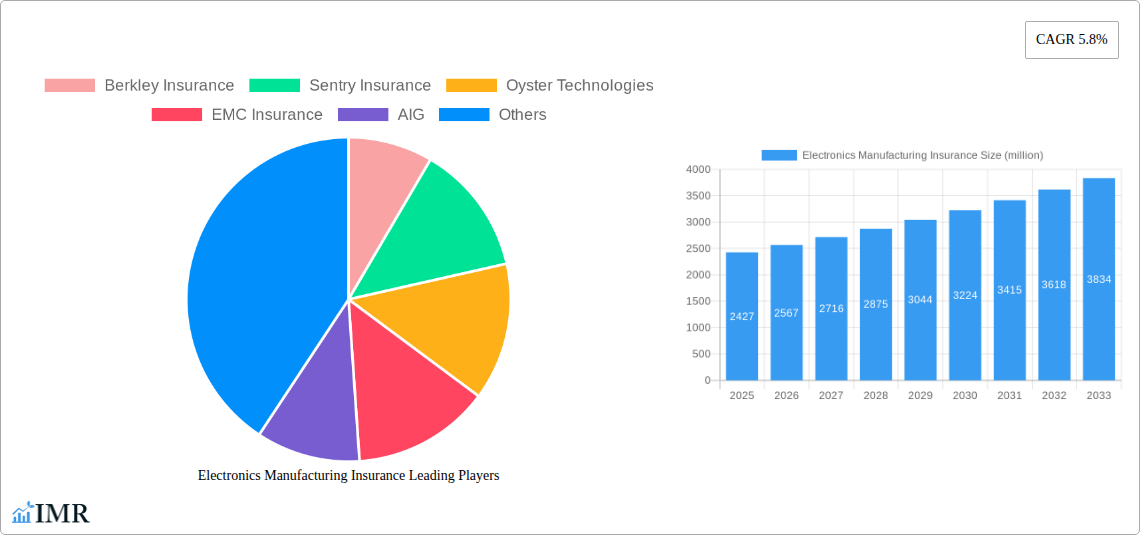
Electronics Manufacturing Insurance Company Market Share
Electronics Manufacturing Insurance: Comprehensive Market Analysis and Future Outlook (2019-2033)
This in-depth report provides a detailed analysis of the global Electronics Manufacturing Insurance market, offering critical insights into its dynamics, growth trends, regional dominance, product landscape, and future outlook. Covering the period from 2019 to 2033, with a base year of 2025, this report is an indispensable resource for stakeholders seeking to understand and capitalize on opportunities within this vital sector.
Electronics Manufacturing Insurance Market Dynamics & Structure
The electronics manufacturing insurance market exhibits a dynamic structure influenced by several key factors. Market concentration varies across different segments, with specialized insurance providers focusing on high-risk areas like semiconductor manufacturing. Technological innovation is a significant driver, compelling insurers to adapt their offerings to cover emerging risks associated with advanced manufacturing processes, artificial intelligence integration, and the Internet of Things (IoT) devices. Regulatory frameworks, including environmental regulations and data privacy laws, continuously shape insurance product development and compliance requirements. Competitive product substitutes, such as in-house risk management strategies and captive insurance schemes, present an ongoing challenge, demanding a constant evolution of value propositions from traditional insurers. End-user demographics are shifting, with a growing demand for tailored insurance solutions from emerging players in developing economies and established large-scale manufacturers in mature markets. Mergers and acquisitions (M&A) are also a notable trend, as larger insurers seek to consolidate their market position and expand their capabilities, particularly in specialized areas.
- Market Concentration: Fragmented in some niche segments, consolidated among larger global providers in broader offerings.
- Technological Innovation Drivers: The rapid evolution of electronics, including advanced chip fabrication, miniaturization, and complex supply chains, necessitates continuous updates in risk assessment and coverage.
- Regulatory Frameworks: Evolving compliance demands related to cybersecurity, environmental impact, and worker safety directly influence insurance product design.
- Competitive Product Substitutes: In-house risk mitigation and alternative financing mechanisms require insurers to demonstrate superior risk management expertise and cost-effectiveness.
- End-User Demographics: A diverse client base ranging from agile startups to multinational corporations, each with unique risk profiles and coverage needs.
- M&A Trends: Strategic acquisitions by major insurers to gain access to specialized underwriting expertise and expand geographic reach, with an estimated XX deals in the historical period (2019-2024).
Electronics Manufacturing Insurance Growth Trends & Insights
The global electronics manufacturing insurance market is poised for significant expansion, driven by escalating production volumes, increasing complexity of manufactured goods, and a heightened awareness of potential business disruptions. The study period of 2019–2033, with 2025 as the estimated year, reveals a robust Compound Annual Growth Rate (CAGR) of approximately XX% for the forecast period of 2025–2033. This growth is underpinned by the expanding parent market, the broader manufacturing sector, which is projected to reach a value of $XX trillion by 2025, and the child market of electronic components, expected to grow to $XX billion by the same year. Adoption rates for comprehensive insurance policies are steadily increasing, spurred by a series of high-profile supply chain disruptions and cyberattacks witnessed during the historical period (2019–2024). Technological disruptions, such as the widespread adoption of automation, AI-powered manufacturing, and advanced robotics, while enhancing efficiency, also introduce new layers of risk that necessitate specialized insurance coverage, leading to a surge in demand for cyber liability and equipment breakdown policies. Consumer behavior shifts, including a growing demand for more resilient and secure electronic products, indirectly influence manufacturers to invest in robust risk management and insurance to safeguard their operations and product integrity. Market penetration is projected to rise from XX% in 2019 to an estimated XX% by 2033, reflecting a maturing market where insurance is increasingly viewed as a critical component of operational resilience rather than a mere cost. The market size is estimated to grow from $XX billion in 2019 to $XX billion in the estimated year of 2025, with a projected expansion to $XX billion by 2033.
Dominant Regions, Countries, or Segments in Electronics Manufacturing Insurance
The Application: Semiconductor Manufacturers segment stands out as a dominant force driving growth within the global electronics manufacturing insurance market. This dominance is fueled by the inherently high-value, complex, and often catastrophic risks associated with semiconductor fabrication. The intricate nature of cleanroom environments, specialized equipment, and the globalized, yet often fragile, supply chains for raw materials and finished goods contribute to substantial insurance needs. The global semiconductor market alone is projected to reach $XX billion by 2025, directly translating into a proportional demand for specialized insurance solutions. North America and East Asia, particularly countries like the United States, South Korea, Taiwan, and China, are leading regions in this segment due to the concentration of advanced semiconductor manufacturing facilities and significant investment in R&D.
- Key Drivers in Semiconductor Manufacturing:
- High-Value Assets: The immense cost of semiconductor fabrication plants and equipment necessitates robust property and business interruption insurance.
- Technological Sophistication: Advanced manufacturing processes, including photolithography and etching, carry inherent risks of equipment failure, contamination, and yield loss, requiring specialized coverage.
- Supply Chain Vulnerabilities: Reliance on specialized raw materials and the intricate global distribution network make manufacturers susceptible to disruptions, driving demand for supply chain insurance.
- Intellectual Property Protection: The critical nature of intellectual property in this sector fuels demand for comprehensive cyber liability and errors & omissions insurance.
- Market Share and Growth Potential: Semiconductor manufacturers represent an estimated XX% of the total electronics manufacturing insurance market in 2025, with an anticipated CAGR of XX% for the forecast period.
- Dominance Factors: The capital-intensive nature of semiconductor production, coupled with the critical role of these components in virtually all modern technologies, ensures sustained demand for comprehensive insurance coverage. Economic policies fostering innovation and technological advancement in these key regions further solidify their dominance.
Electronics Manufacturing Insurance Product Landscape
The product landscape of electronics manufacturing insurance is evolving to address the multifaceted risks inherent in the industry. Beyond traditional property and liability coverage, specialized policies are emerging to tackle unique challenges. Innovations include parametric insurance triggered by specific events like natural disasters, offering faster payouts, and comprehensive cyber insurance tailored to protect against data breaches, ransomware attacks, and intellectual property theft. Performance metrics are increasingly tied to the resilience and continuity of operations, with insurers developing products that incentivize robust risk management practices. Unique selling propositions often lie in the depth of industry-specific expertise, allowing insurers to offer tailored underwriting and claims handling services that understand the nuances of semiconductor manufacturing, electronic component production, and distribution networks.
Key Drivers, Barriers & Challenges in Electronics Manufacturing Insurance
The electronics manufacturing insurance market is propelled by several key drivers, including the relentless pace of technological innovation demanding continuous risk reassessment, and the escalating complexity of global supply chains that amplify vulnerability to disruptions. Increasing cybersecurity threats and the growing awareness of the financial implications of production downtime are also significant drivers. Furthermore, evolving regulatory landscapes and government incentives for domestic manufacturing can also spur demand for localized insurance solutions.
Conversely, several barriers and challenges temper market growth. Intense competition among insurers, leading to price pressures, is a significant constraint. The high cost of specialized underwriting and claims handling for complex technological risks can be prohibitive for smaller manufacturers. Supply chain disruptions, while driving demand, can also make it difficult for insurers to accurately assess and price risk over extended periods. Regulatory hurdles in different jurisdictions can add complexity to global policy offerings.
Emerging Opportunities in Electronics Manufacturing Insurance
Emerging opportunities in electronics manufacturing insurance lie in catering to the burgeoning demand for coverage of the Internet of Things (IoT) device manufacturing and the increasing adoption of artificial intelligence (AI) in production processes. Untapped markets in emerging economies with rapidly growing electronics manufacturing sectors present significant growth potential. Innovative applications of parametric insurance for specific supply chain disruptions or production line failures are gaining traction. Furthermore, evolving consumer preferences for sustainable and ethically produced electronics may create new insurance needs related to environmental compliance and social responsibility.
Growth Accelerators in the Electronics Manufacturing Insurance Industry
Growth accelerators in the electronics manufacturing insurance industry are primarily fueled by rapid technological advancements that create new risk profiles requiring specialized insurance solutions. Strategic partnerships between insurance providers and technology firms are emerging, enabling more sophisticated risk assessment and predictive modeling. The expansion of the electronics manufacturing sector into new geographic regions, driven by global demand and shifting production dynamics, opens up new markets for insurance providers. Moreover, the increasing focus on business continuity and supply chain resilience following recent global events is a powerful catalyst for sustained demand for comprehensive insurance coverage.
Key Players Shaping the Electronics Manufacturing Insurance Market
- Berkley Insurance
- Sentry Insurance
- Oyster Technologies
- EMC Insurance
- AIG
- AXA XL
- Allianz
- Higginbotham
- Liberty Mutual
- State Farm
- Travelers Insurance
- Zurich
- Northbridge Insurance
Notable Milestones in Electronics Manufacturing Insurance Sector
- 2019: Increased focus on cyber risk insurance offerings in response to escalating global cyber threats targeting manufacturers.
- 2020: Significant surge in demand for business interruption and supply chain disruption insurance due to the initial impacts of the COVID-19 pandemic.
- 2021: Introduction of parametric insurance solutions for specific natural disaster events impacting key manufacturing hubs.
- 2022: Enhanced product development targeting risks associated with advanced robotics and automation in electronics production.
- 2023: Growing emphasis on ESG (Environmental, Social, and Governance) related insurance coverage for electronics manufacturers.
- 2024: Increased M&A activity as larger insurers seek to consolidate their position and expand specialized underwriting capabilities.
In-Depth Electronics Manufacturing Insurance Market Outlook
The outlook for the electronics manufacturing insurance market remains exceptionally strong, driven by a confluence of accelerating growth factors. The continued rapid pace of technological innovation, particularly in areas like AI, 5G, and advanced materials, will consistently create new risk landscapes that necessitate sophisticated insurance solutions. Strategic collaborations between insurers and technology providers are expected to become more prevalent, enhancing predictive analytics and risk mitigation capabilities. Furthermore, the ongoing globalization and localization efforts within the electronics manufacturing sector will open up new geographical markets for insurance providers. The unwavering focus on business continuity and supply chain resilience, amplified by recent global events, will ensure sustained demand for comprehensive insurance products, positioning the market for significant future expansion and opportunity.
Electronics Manufacturing Insurance Segmentation
-
1. Application
- 1.1. Semiconductor Manufacturers
- 1.2. Electronic Component Manufacturers
- 1.3. Distributors
- 1.4. Others
-
2. Type
- 2.1. Property Insurance
- 2.2. Liability Insurance
- 2.3. Others
Electronics Manufacturing Insurance Segmentation By Geography
-
1. North America
- 1.1. United States
- 1.2. Canada
- 1.3. Mexico
-
2. South America
- 2.1. Brazil
- 2.2. Argentina
- 2.3. Rest of South America
-
3. Europe
- 3.1. United Kingdom
- 3.2. Germany
- 3.3. France
- 3.4. Italy
- 3.5. Spain
- 3.6. Russia
- 3.7. Benelux
- 3.8. Nordics
- 3.9. Rest of Europe
-
4. Middle East & Africa
- 4.1. Turkey
- 4.2. Israel
- 4.3. GCC
- 4.4. North Africa
- 4.5. South Africa
- 4.6. Rest of Middle East & Africa
-
5. Asia Pacific
- 5.1. China
- 5.2. India
- 5.3. Japan
- 5.4. South Korea
- 5.5. ASEAN
- 5.6. Oceania
- 5.7. Rest of Asia Pacific
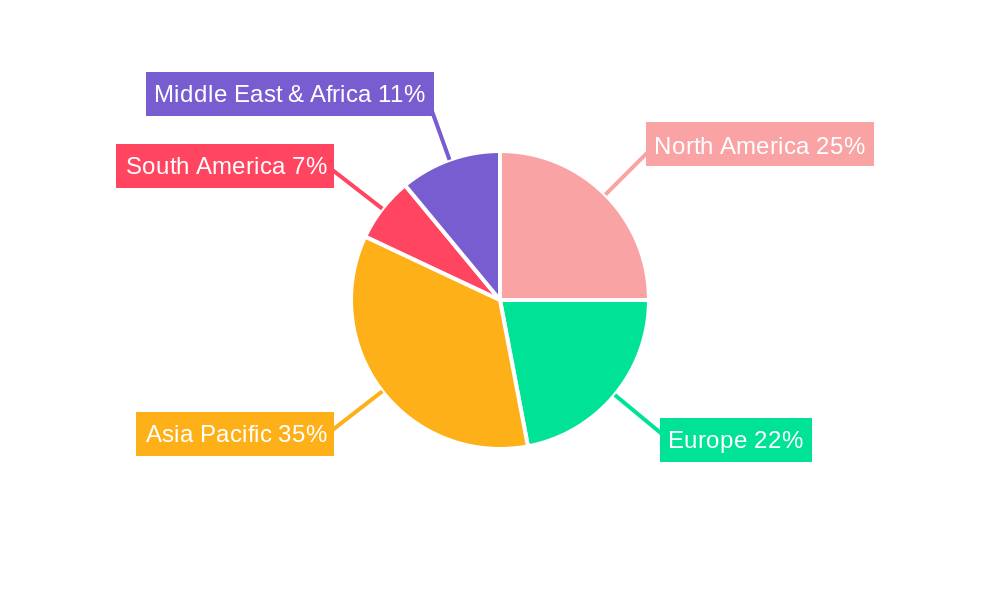
Electronics Manufacturing Insurance Regional Market Share
Geographic Coverage of Electronics Manufacturing Insurance
Electronics Manufacturing Insurance REPORT HIGHLIGHTS
| Aspects | Details |
|---|---|
| Study Period | 2020-2034 |
| Base Year | 2025 |
| Estimated Year | 2026 |
| Forecast Period | 2026-2034 |
| Historical Period | 2020-2025 |
| Growth Rate | CAGR of 5.8% from 2020-2034 |
| Segmentation |
|
Table of Contents
- 1. Introduction
- 1.1. Research Scope
- 1.2. Market Segmentation
- 1.3. Research Objective
- 1.4. Definitions and Assumptions
- 2. Executive Summary
- 2.1. Market Snapshot
- 3. Market Dynamics
- 3.1. Market Drivers
- 3.2. Market Restrains
- 3.3. Market Trends
- 3.4. Market Opportunities
- 4. Market Factor Analysis
- 4.1. Porters Five Forces
- 4.1.1. Bargaining Power of Suppliers
- 4.1.2. Bargaining Power of Buyers
- 4.1.3. Threat of New Entrants
- 4.1.4. Threat of Substitutes
- 4.1.5. Competitive Rivalry
- 4.2. PESTEL analysis
- 4.3. BCG Analysis
- 4.3.1. Stars (High Growth, High Market Share)
- 4.3.2. Cash Cows (Low Growth, High Market Share)
- 4.3.3. Question Mark (High Growth, Low Market Share)
- 4.3.4. Dogs (Low Growth, Low Market Share)
- 4.4. Ansoff Matrix Analysis
- 4.5. Supply Chain Analysis
- 4.6. Regulatory Landscape
- 4.7. Current Market Potential and Opportunity Assessment (TAM–SAM–SOM Framework)
- 4.8. IMR Analyst Note
- 4.1. Porters Five Forces
- 5. Market Analysis, Insights and Forecast 2021-2033
- 5.1. Market Analysis, Insights and Forecast - by Application
- 5.1.1. Semiconductor Manufacturers
- 5.1.2. Electronic Component Manufacturers
- 5.1.3. Distributors
- 5.1.4. Others
- 5.2. Market Analysis, Insights and Forecast - by Type
- 5.2.1. Property Insurance
- 5.2.2. Liability Insurance
- 5.2.3. Others
- 5.3. Market Analysis, Insights and Forecast - by Region
- 5.3.1. North America
- 5.3.2. South America
- 5.3.3. Europe
- 5.3.4. Middle East & Africa
- 5.3.5. Asia Pacific
- 5.1. Market Analysis, Insights and Forecast - by Application
- 6. Global Electronics Manufacturing Insurance Analysis, Insights and Forecast, 2021-2033
- 6.1. Market Analysis, Insights and Forecast - by Application
- 6.1.1. Semiconductor Manufacturers
- 6.1.2. Electronic Component Manufacturers
- 6.1.3. Distributors
- 6.1.4. Others
- 6.2. Market Analysis, Insights and Forecast - by Type
- 6.2.1. Property Insurance
- 6.2.2. Liability Insurance
- 6.2.3. Others
- 6.1. Market Analysis, Insights and Forecast - by Application
- 7. North America Electronics Manufacturing Insurance Analysis, Insights and Forecast, 2020-2032
- 7.1. Market Analysis, Insights and Forecast - by Application
- 7.1.1. Semiconductor Manufacturers
- 7.1.2. Electronic Component Manufacturers
- 7.1.3. Distributors
- 7.1.4. Others
- 7.2. Market Analysis, Insights and Forecast - by Type
- 7.2.1. Property Insurance
- 7.2.2. Liability Insurance
- 7.2.3. Others
- 7.1. Market Analysis, Insights and Forecast - by Application
- 8. South America Electronics Manufacturing Insurance Analysis, Insights and Forecast, 2020-2032
- 8.1. Market Analysis, Insights and Forecast - by Application
- 8.1.1. Semiconductor Manufacturers
- 8.1.2. Electronic Component Manufacturers
- 8.1.3. Distributors
- 8.1.4. Others
- 8.2. Market Analysis, Insights and Forecast - by Type
- 8.2.1. Property Insurance
- 8.2.2. Liability Insurance
- 8.2.3. Others
- 8.1. Market Analysis, Insights and Forecast - by Application
- 9. Europe Electronics Manufacturing Insurance Analysis, Insights and Forecast, 2020-2032
- 9.1. Market Analysis, Insights and Forecast - by Application
- 9.1.1. Semiconductor Manufacturers
- 9.1.2. Electronic Component Manufacturers
- 9.1.3. Distributors
- 9.1.4. Others
- 9.2. Market Analysis, Insights and Forecast - by Type
- 9.2.1. Property Insurance
- 9.2.2. Liability Insurance
- 9.2.3. Others
- 9.1. Market Analysis, Insights and Forecast - by Application
- 10. Middle East & Africa Electronics Manufacturing Insurance Analysis, Insights and Forecast, 2020-2032
- 10.1. Market Analysis, Insights and Forecast - by Application
- 10.1.1. Semiconductor Manufacturers
- 10.1.2. Electronic Component Manufacturers
- 10.1.3. Distributors
- 10.1.4. Others
- 10.2. Market Analysis, Insights and Forecast - by Type
- 10.2.1. Property Insurance
- 10.2.2. Liability Insurance
- 10.2.3. Others
- 10.1. Market Analysis, Insights and Forecast - by Application
- 11. Asia Pacific Electronics Manufacturing Insurance Analysis, Insights and Forecast, 2020-2032
- 11.1. Market Analysis, Insights and Forecast - by Application
- 11.1.1. Semiconductor Manufacturers
- 11.1.2. Electronic Component Manufacturers
- 11.1.3. Distributors
- 11.1.4. Others
- 11.2. Market Analysis, Insights and Forecast - by Type
- 11.2.1. Property Insurance
- 11.2.2. Liability Insurance
- 11.2.3. Others
- 11.1. Market Analysis, Insights and Forecast - by Application
- 12. Competitive Analysis
- 12.1. Company Profiles
- 12.1.1 Berkley Insurance
- 12.1.1.1. Company Overview
- 12.1.1.2. Products
- 12.1.1.3. Company Financials
- 12.1.1.4. SWOT Analysis
- 12.1.2 Sentry Insurance
- 12.1.2.1. Company Overview
- 12.1.2.2. Products
- 12.1.2.3. Company Financials
- 12.1.2.4. SWOT Analysis
- 12.1.3 Oyster Technologies
- 12.1.3.1. Company Overview
- 12.1.3.2. Products
- 12.1.3.3. Company Financials
- 12.1.3.4. SWOT Analysis
- 12.1.4 EMC Insurance
- 12.1.4.1. Company Overview
- 12.1.4.2. Products
- 12.1.4.3. Company Financials
- 12.1.4.4. SWOT Analysis
- 12.1.5 AIG
- 12.1.5.1. Company Overview
- 12.1.5.2. Products
- 12.1.5.3. Company Financials
- 12.1.5.4. SWOT Analysis
- 12.1.6 AXA XL
- 12.1.6.1. Company Overview
- 12.1.6.2. Products
- 12.1.6.3. Company Financials
- 12.1.6.4. SWOT Analysis
- 12.1.7 Allianz
- 12.1.7.1. Company Overview
- 12.1.7.2. Products
- 12.1.7.3. Company Financials
- 12.1.7.4. SWOT Analysis
- 12.1.8 Higginbotham
- 12.1.8.1. Company Overview
- 12.1.8.2. Products
- 12.1.8.3. Company Financials
- 12.1.8.4. SWOT Analysis
- 12.1.9 Liberty Mutual
- 12.1.9.1. Company Overview
- 12.1.9.2. Products
- 12.1.9.3. Company Financials
- 12.1.9.4. SWOT Analysis
- 12.1.10 State Farm
- 12.1.10.1. Company Overview
- 12.1.10.2. Products
- 12.1.10.3. Company Financials
- 12.1.10.4. SWOT Analysis
- 12.1.11 Travelers Insurance
- 12.1.11.1. Company Overview
- 12.1.11.2. Products
- 12.1.11.3. Company Financials
- 12.1.11.4. SWOT Analysis
- 12.1.12 Zurich
- 12.1.12.1. Company Overview
- 12.1.12.2. Products
- 12.1.12.3. Company Financials
- 12.1.12.4. SWOT Analysis
- 12.1.13 Northbridge Insurance
- 12.1.13.1. Company Overview
- 12.1.13.2. Products
- 12.1.13.3. Company Financials
- 12.1.13.4. SWOT Analysis
- 12.1.1 Berkley Insurance
- 12.2. Market Entropy
- 12.2.1 Company's Key Areas Served
- 12.2.2 Recent Developments
- 12.3. Company Market Share Analysis 2025
- 12.3.1 Top 5 Companies Market Share Analysis
- 12.3.2 Top 3 Companies Market Share Analysis
- 12.4. List of Potential Customers
- 13. Research Methodology
List of Figures
- Figure 1: Global Electronics Manufacturing Insurance Revenue Breakdown (million, %) by Region 2025 & 2033
- Figure 2: North America Electronics Manufacturing Insurance Revenue (million), by Application 2025 & 2033
- Figure 3: North America Electronics Manufacturing Insurance Revenue Share (%), by Application 2025 & 2033
- Figure 4: North America Electronics Manufacturing Insurance Revenue (million), by Type 2025 & 2033
- Figure 5: North America Electronics Manufacturing Insurance Revenue Share (%), by Type 2025 & 2033
- Figure 6: North America Electronics Manufacturing Insurance Revenue (million), by Country 2025 & 2033
- Figure 7: North America Electronics Manufacturing Insurance Revenue Share (%), by Country 2025 & 2033
- Figure 8: South America Electronics Manufacturing Insurance Revenue (million), by Application 2025 & 2033
- Figure 9: South America Electronics Manufacturing Insurance Revenue Share (%), by Application 2025 & 2033
- Figure 10: South America Electronics Manufacturing Insurance Revenue (million), by Type 2025 & 2033
- Figure 11: South America Electronics Manufacturing Insurance Revenue Share (%), by Type 2025 & 2033
- Figure 12: South America Electronics Manufacturing Insurance Revenue (million), by Country 2025 & 2033
- Figure 13: South America Electronics Manufacturing Insurance Revenue Share (%), by Country 2025 & 2033
- Figure 14: Europe Electronics Manufacturing Insurance Revenue (million), by Application 2025 & 2033
- Figure 15: Europe Electronics Manufacturing Insurance Revenue Share (%), by Application 2025 & 2033
- Figure 16: Europe Electronics Manufacturing Insurance Revenue (million), by Type 2025 & 2033
- Figure 17: Europe Electronics Manufacturing Insurance Revenue Share (%), by Type 2025 & 2033
- Figure 18: Europe Electronics Manufacturing Insurance Revenue (million), by Country 2025 & 2033
- Figure 19: Europe Electronics Manufacturing Insurance Revenue Share (%), by Country 2025 & 2033
- Figure 20: Middle East & Africa Electronics Manufacturing Insurance Revenue (million), by Application 2025 & 2033
- Figure 21: Middle East & Africa Electronics Manufacturing Insurance Revenue Share (%), by Application 2025 & 2033
- Figure 22: Middle East & Africa Electronics Manufacturing Insurance Revenue (million), by Type 2025 & 2033
- Figure 23: Middle East & Africa Electronics Manufacturing Insurance Revenue Share (%), by Type 2025 & 2033
- Figure 24: Middle East & Africa Electronics Manufacturing Insurance Revenue (million), by Country 2025 & 2033
- Figure 25: Middle East & Africa Electronics Manufacturing Insurance Revenue Share (%), by Country 2025 & 2033
- Figure 26: Asia Pacific Electronics Manufacturing Insurance Revenue (million), by Application 2025 & 2033
- Figure 27: Asia Pacific Electronics Manufacturing Insurance Revenue Share (%), by Application 2025 & 2033
- Figure 28: Asia Pacific Electronics Manufacturing Insurance Revenue (million), by Type 2025 & 2033
- Figure 29: Asia Pacific Electronics Manufacturing Insurance Revenue Share (%), by Type 2025 & 2033
- Figure 30: Asia Pacific Electronics Manufacturing Insurance Revenue (million), by Country 2025 & 2033
- Figure 31: Asia Pacific Electronics Manufacturing Insurance Revenue Share (%), by Country 2025 & 2033
List of Tables
- Table 1: Global Electronics Manufacturing Insurance Revenue million Forecast, by Application 2020 & 2033
- Table 2: Global Electronics Manufacturing Insurance Revenue million Forecast, by Type 2020 & 2033
- Table 3: Global Electronics Manufacturing Insurance Revenue million Forecast, by Region 2020 & 2033
- Table 4: Global Electronics Manufacturing Insurance Revenue million Forecast, by Application 2020 & 2033
- Table 5: Global Electronics Manufacturing Insurance Revenue million Forecast, by Type 2020 & 2033
- Table 6: Global Electronics Manufacturing Insurance Revenue million Forecast, by Country 2020 & 2033
- Table 7: United States Electronics Manufacturing Insurance Revenue (million) Forecast, by Application 2020 & 2033
- Table 8: Canada Electronics Manufacturing Insurance Revenue (million) Forecast, by Application 2020 & 2033
- Table 9: Mexico Electronics Manufacturing Insurance Revenue (million) Forecast, by Application 2020 & 2033
- Table 10: Global Electronics Manufacturing Insurance Revenue million Forecast, by Application 2020 & 2033
- Table 11: Global Electronics Manufacturing Insurance Revenue million Forecast, by Type 2020 & 2033
- Table 12: Global Electronics Manufacturing Insurance Revenue million Forecast, by Country 2020 & 2033
- Table 13: Brazil Electronics Manufacturing Insurance Revenue (million) Forecast, by Application 2020 & 2033
- Table 14: Argentina Electronics Manufacturing Insurance Revenue (million) Forecast, by Application 2020 & 2033
- Table 15: Rest of South America Electronics Manufacturing Insurance Revenue (million) Forecast, by Application 2020 & 2033
- Table 16: Global Electronics Manufacturing Insurance Revenue million Forecast, by Application 2020 & 2033
- Table 17: Global Electronics Manufacturing Insurance Revenue million Forecast, by Type 2020 & 2033
- Table 18: Global Electronics Manufacturing Insurance Revenue million Forecast, by Country 2020 & 2033
- Table 19: United Kingdom Electronics Manufacturing Insurance Revenue (million) Forecast, by Application 2020 & 2033
- Table 20: Germany Electronics Manufacturing Insurance Revenue (million) Forecast, by Application 2020 & 2033
- Table 21: France Electronics Manufacturing Insurance Revenue (million) Forecast, by Application 2020 & 2033
- Table 22: Italy Electronics Manufacturing Insurance Revenue (million) Forecast, by Application 2020 & 2033
- Table 23: Spain Electronics Manufacturing Insurance Revenue (million) Forecast, by Application 2020 & 2033
- Table 24: Russia Electronics Manufacturing Insurance Revenue (million) Forecast, by Application 2020 & 2033
- Table 25: Benelux Electronics Manufacturing Insurance Revenue (million) Forecast, by Application 2020 & 2033
- Table 26: Nordics Electronics Manufacturing Insurance Revenue (million) Forecast, by Application 2020 & 2033
- Table 27: Rest of Europe Electronics Manufacturing Insurance Revenue (million) Forecast, by Application 2020 & 2033
- Table 28: Global Electronics Manufacturing Insurance Revenue million Forecast, by Application 2020 & 2033
- Table 29: Global Electronics Manufacturing Insurance Revenue million Forecast, by Type 2020 & 2033
- Table 30: Global Electronics Manufacturing Insurance Revenue million Forecast, by Country 2020 & 2033
- Table 31: Turkey Electronics Manufacturing Insurance Revenue (million) Forecast, by Application 2020 & 2033
- Table 32: Israel Electronics Manufacturing Insurance Revenue (million) Forecast, by Application 2020 & 2033
- Table 33: GCC Electronics Manufacturing Insurance Revenue (million) Forecast, by Application 2020 & 2033
- Table 34: North Africa Electronics Manufacturing Insurance Revenue (million) Forecast, by Application 2020 & 2033
- Table 35: South Africa Electronics Manufacturing Insurance Revenue (million) Forecast, by Application 2020 & 2033
- Table 36: Rest of Middle East & Africa Electronics Manufacturing Insurance Revenue (million) Forecast, by Application 2020 & 2033
- Table 37: Global Electronics Manufacturing Insurance Revenue million Forecast, by Application 2020 & 2033
- Table 38: Global Electronics Manufacturing Insurance Revenue million Forecast, by Type 2020 & 2033
- Table 39: Global Electronics Manufacturing Insurance Revenue million Forecast, by Country 2020 & 2033
- Table 40: China Electronics Manufacturing Insurance Revenue (million) Forecast, by Application 2020 & 2033
- Table 41: India Electronics Manufacturing Insurance Revenue (million) Forecast, by Application 2020 & 2033
- Table 42: Japan Electronics Manufacturing Insurance Revenue (million) Forecast, by Application 2020 & 2033
- Table 43: South Korea Electronics Manufacturing Insurance Revenue (million) Forecast, by Application 2020 & 2033
- Table 44: ASEAN Electronics Manufacturing Insurance Revenue (million) Forecast, by Application 2020 & 2033
- Table 45: Oceania Electronics Manufacturing Insurance Revenue (million) Forecast, by Application 2020 & 2033
- Table 46: Rest of Asia Pacific Electronics Manufacturing Insurance Revenue (million) Forecast, by Application 2020 & 2033
Frequently Asked Questions
1. What is the projected Compound Annual Growth Rate (CAGR) of the Electronics Manufacturing Insurance?
The projected CAGR is approximately 5.8%.
2. Which companies are prominent players in the Electronics Manufacturing Insurance?
Key companies in the market include Berkley Insurance, Sentry Insurance, Oyster Technologies, EMC Insurance, AIG, AXA XL, Allianz, Higginbotham, Liberty Mutual, State Farm, Travelers Insurance, Zurich, Northbridge Insurance.
3. What are the main segments of the Electronics Manufacturing Insurance?
The market segments include Application, Type.
4. Can you provide details about the market size?
The market size is estimated to be USD 2427 million as of 2022.
5. What are some drivers contributing to market growth?
N/A
6. What are the notable trends driving market growth?
N/A
7. Are there any restraints impacting market growth?
N/A
8. Can you provide examples of recent developments in the market?
N/A
9. What pricing options are available for accessing the report?
Pricing options include single-user, multi-user, and enterprise licenses priced at USD 3950.00, USD 5925.00, and USD 7900.00 respectively.
10. Is the market size provided in terms of value or volume?
The market size is provided in terms of value, measured in million.
11. Are there any specific market keywords associated with the report?
Yes, the market keyword associated with the report is "Electronics Manufacturing Insurance," which aids in identifying and referencing the specific market segment covered.
12. How do I determine which pricing option suits my needs best?
The pricing options vary based on user requirements and access needs. Individual users may opt for single-user licenses, while businesses requiring broader access may choose multi-user or enterprise licenses for cost-effective access to the report.
13. Are there any additional resources or data provided in the Electronics Manufacturing Insurance report?
While the report offers comprehensive insights, it's advisable to review the specific contents or supplementary materials provided to ascertain if additional resources or data are available.
14. How can I stay updated on further developments or reports in the Electronics Manufacturing Insurance?
To stay informed about further developments, trends, and reports in the Electronics Manufacturing Insurance, consider subscribing to industry newsletters, following relevant companies and organizations, or regularly checking reputable industry news sources and publications.
Methodology
Step 1 - Identification of Relevant Samples Size from Population Database


Step 2 - Approaches for Defining Global Market Size (Value, Volume* & Price*)

Note*: In applicable scenarios
Step 3 - Data Sources
Primary Research
- Web Analytics
- Survey Reports
- Research Institute
- Latest Research Reports
- Opinion Leaders
Secondary Research
- Annual Reports
- White Paper
- Latest Press Release
- Industry Association
- Paid Database
- Investor Presentations

Step 4 - Data Triangulation
Involves using different sources of information in order to increase the validity of a study
These sources are likely to be stakeholders in a program - participants, other researchers, program staff, other community members, and so on.
Then we put all data in single framework & apply various statistical tools to find out the dynamic on the market.
During the analysis stage, feedback from the stakeholder groups would be compared to determine areas of agreement as well as areas of divergence