

Key Insights
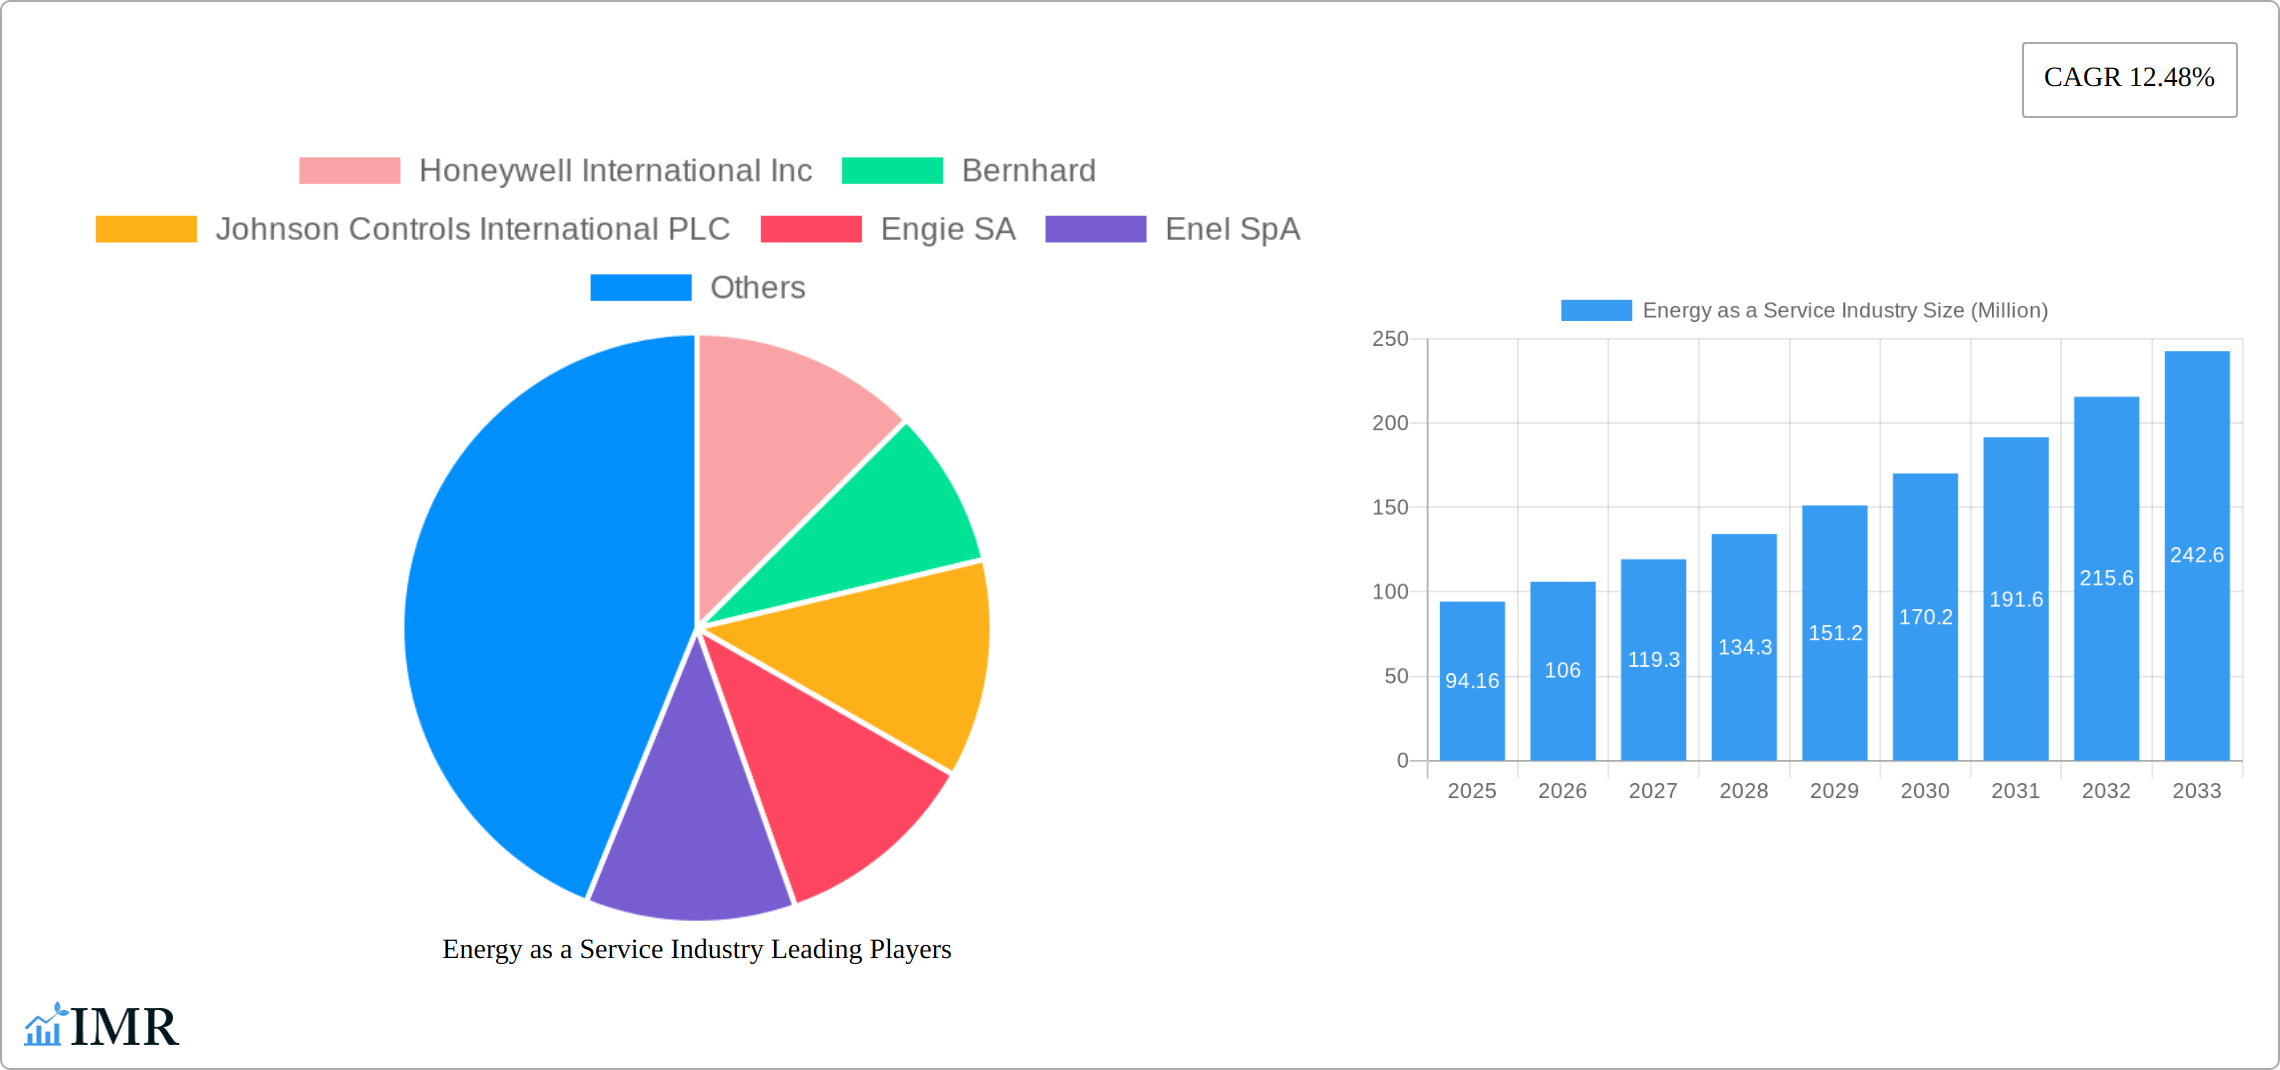
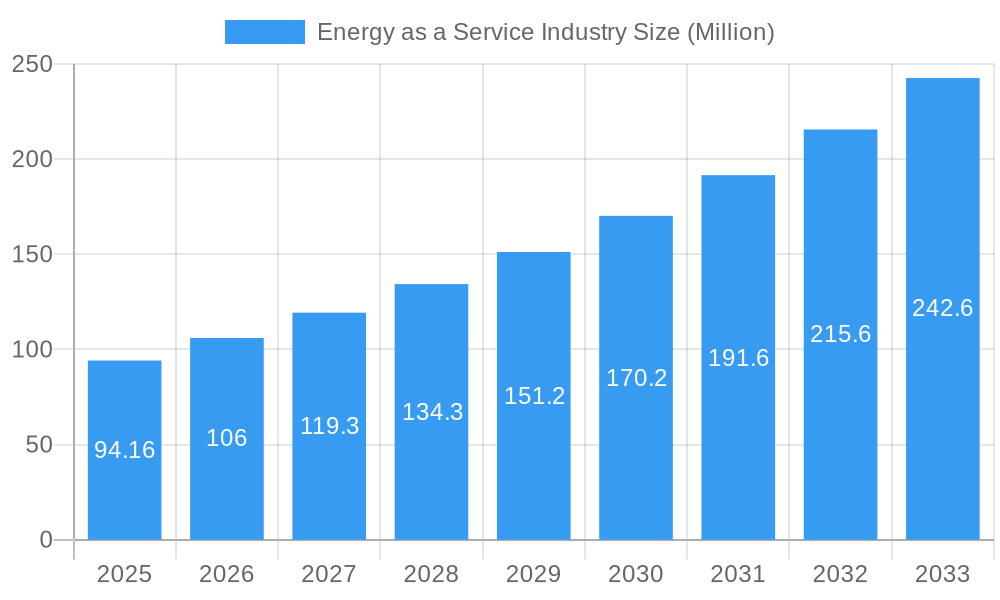
The Energy as a Service (EaaS) market is experiencing robust growth, projected to reach $94.16 million in 2025 and exhibiting a Compound Annual Growth Rate (CAGR) of 12.48% from 2025 to 2033. This expansion is driven by several key factors. Firstly, increasing demand for energy efficiency and sustainability initiatives across commercial and industrial sectors is fueling adoption. Businesses are actively seeking cost-effective solutions to reduce their carbon footprint and operational expenses, making EaaS an attractive alternative to traditional energy models. Secondly, technological advancements, such as smart grid technologies and advanced metering infrastructure (AMI), are enabling better energy management and optimizing energy consumption, further bolstering EaaS market growth. Finally, the emergence of innovative financing options and attractive business models, such as performance-based contracts, are making EaaS more accessible to a broader range of businesses. The market's segmentation, with a focus on commercial and industrial end-users, reflects the significant potential for EaaS adoption within these sectors, where energy consumption is substantial and optimization opportunities are abundant. Major players like Honeywell, Johnson Controls, and Schneider Electric are actively shaping the market through their innovative offerings and strategic partnerships. Geographic expansion is also a key driver; North America and Europe currently hold significant market share, but the Asia-Pacific region is expected to witness rapid growth driven by increasing industrialization and urbanization.
Energy as a Service Industry Market Size (In Million)
The competitive landscape is characterized by a mix of established energy companies, technology providers, and specialized EaaS providers. While established players leverage their existing infrastructure and expertise, specialized EaaS providers focus on innovative solutions and flexible service offerings. Despite these positive factors, the EaaS market faces some challenges. High initial investment costs for implementing smart technologies and the need for strong regulatory support to foster market adoption remain hurdles. However, these are being mitigated by ongoing technological advancements and government initiatives promoting energy efficiency and renewable energy sources. The long-term forecast indicates continued expansion, driven by the ongoing need for sustainable and cost-effective energy solutions, making EaaS a compelling investment and a critical component of the future energy landscape.
Energy as a Service Industry Company Market Share
This comprehensive report provides a detailed analysis of the Energy as a Service (EaaS) industry, encompassing market dynamics, growth trends, competitive landscape, and future outlook. With a focus on the parent market of energy services and the child markets of commercial and industrial end-users, this report is invaluable for industry professionals, investors, and strategic planners. The study period covers 2019-2033, with a base year of 2025 and a forecast period of 2025-2033. The historical period analyzed is 2019-2024. The market size is presented in millions of units.
Energy as a Service Industry Market Dynamics & Structure
This section analyzes the EaaS market structure, encompassing market concentration, technological innovation, regulatory influences, competitive substitutes, end-user demographics, and mergers & acquisitions (M&A) activity. The global EaaS market is characterized by a moderately consolidated structure, with a few major players holding significant market share. However, a number of smaller players are actively driving innovation and expansion. The market share of the top 5 players is estimated to be around xx%.
- Market Concentration: High concentration in certain segments, with a fragmented landscape in others.
- Technological Innovation: Rapid advancements in renewable energy technologies, smart grids, and IoT are fueling EaaS adoption. Innovation barriers include high initial investment costs and the need for skilled workforce.
- Regulatory Frameworks: Government policies promoting energy efficiency and renewable energy sources are stimulating EaaS growth. Regulatory uncertainty in some regions remains a challenge.
- Competitive Product Substitutes: Traditional energy procurement methods compete with EaaS. However, EaaS offers advantages in terms of cost savings, risk mitigation, and sustainability.
- End-User Demographics: Commercial and industrial sectors are the primary end-users, driven by the need for reduced energy costs and environmental responsibility. Growth in the residential sector is expected to follow.
- M&A Trends: The number of M&A deals in the EaaS sector has increased in recent years, as major players consolidate their market positions and acquire smaller innovative companies. The estimated number of M&A deals between 2019-2024 was xx.
Energy as a Service Industry Growth Trends & Insights
The Energy as a Service (EaaS) industry is experiencing explosive growth, fueled by a perfect storm of converging factors. Rising energy costs, escalating environmental concerns, and groundbreaking technological advancements are reshaping the energy consumption landscape, making EaaS a compelling solution for businesses and consumers alike. Our comprehensive data analysis reveals a global EaaS market exhibiting significant expansion, projected to achieve a Compound Annual Growth Rate (CAGR) of [Insert Projected CAGR]% during the forecast period (2025-2033). By 2033, market penetration is anticipated to reach [Insert Projected Market Penetration]%. This robust growth trajectory is propelled by several key drivers: increased awareness of environmental sustainability, supportive government policies promoting renewable energy adoption and energy efficiency, and the inherent appeal of predictable and manageable energy expenses for businesses of all sizes.
Dominant Regions, Countries, or Segments in Energy as a Service Industry
Currently, North America and Europe are spearheading the EaaS market, benefiting from robust government support, well-established infrastructure, and high adoption rates among commercial and industrial customers. The commercial sector currently holds the largest market share, driven by a higher concentration of buildings suitable for energy efficiency upgrades. However, the industrial sector presents significant untapped potential, given its substantial energy consumption and the considerable cost-reduction opportunities afforded by EaaS solutions.
- Key Drivers in North America: Strong regulatory frameworks emphasizing energy efficiency, coupled with a significant presence of established EaaS providers and a culture of technological adoption.
- Key Drivers in Europe: High energy costs, coupled with substantial government incentives for renewable energy adoption and a burgeoning environmental consciousness among consumers and businesses.
- Commercial Sector Drivers: High building density in urban centers, increasing awareness of corporate social responsibility and sustainability initiatives, and the relative ease of implementing energy efficiency measures in existing structures.
- Industrial Sector Drivers: Massive energy consumption in manufacturing processes, significant potential for cost optimization through energy efficiency improvements, and mounting regulatory pressure to decrease carbon emissions and achieve environmental sustainability goals.
Energy as a Service Industry Product Landscape
The EaaS market offers a range of products and services, including energy efficiency upgrades, renewable energy solutions, and smart energy management systems. These solutions are tailored to meet the specific needs of various end-users, ranging from small businesses to large industrial facilities. Key innovations focus on enhanced data analytics, AI-driven optimization, and the integration of renewable energy sources. The unique selling propositions center around cost savings, improved energy efficiency, reduced environmental impact, and predictable operational expenses.
Key Drivers, Barriers & Challenges in Energy as a Service Industry
Key Drivers:
- Increasing energy costs.
- Growing environmental concerns.
- Advancements in technology.
- Favorable government policies.
Key Challenges:
- High initial investment costs.
- Lack of awareness among potential customers.
- Regulatory uncertainty in some regions.
- Competition from traditional energy providers. This competition is estimated to have a xx% negative impact on market growth annually.
Emerging Opportunities in Energy as a Service Industry
- Expansion into untapped markets, particularly in developing economies.
- Development of innovative applications, such as microgrids and virtual power plants.
- Increasing integration of renewable energy sources into EaaS offerings.
- Growth of the residential EaaS market.
Growth Accelerators in the Energy as a Service Industry
Several key factors are accelerating the growth of the EaaS industry. Technological breakthroughs in energy storage (e.g., advanced battery technologies), AI-driven energy management systems offering real-time optimization and predictive analytics, and continuous improvements in renewable energy generation technologies (e.g., solar PV, wind power) are all significant contributors. Strategic collaborations between energy providers, technology companies specializing in smart grid technologies and energy management solutions, and building owners are also crucial for market expansion. Finally, expanding EaaS solutions into new geographical regions and diverse customer segments, including residential consumers, will be vital for long-term growth and market penetration.
Key Players Shaping the Energy as a Service Industry Market
- Honeywell International Inc
- Bernhard
- Johnson Controls International PLC
- Engie SA
- Enel SpA
- Spark Community Investment Co
- Schneider Electric SE
- Veolia Environnement SA
- Electricite de France (EDF) SA
Notable Milestones in Energy as a Service Industry Sector
- March 2023: Honeywell announced a strategic investment in Redaptive to accelerate EaaS capabilities for commercial and industrial buildings, focusing on carbon emission reduction.
- April 2023: Capstone Green Energy Corporation secured a contract for an additional C800S Signature Series microturbine, following an earlier 3.6 MW EaaS contract, highlighting the growing demand for EaaS solutions in the industrial sector.
In-Depth Energy as a Service Industry Market Outlook
The long-term outlook for the EaaS market is exceptionally promising. The convergence of technological innovation, supportive government policies promoting decarbonization and energy efficiency, and a growing global awareness of environmental sustainability positions EaaS for sustained and significant expansion. Strategic partnerships fostering innovation and collaboration, coupled with expansion into new and emerging markets, represent substantial opportunities for existing and new players in this dynamic and rapidly evolving sector. The potential for EaaS to transform the global energy landscape, contributing significantly to a more sustainable and efficient energy future, is considerable.
Energy as a Service Industry Segmentation
-
1. End User
- 1.1. Commercial
- 1.2. Industrial
Energy as a Service Industry Segmentation By Geography
-
1. North America
- 1.1. United States
- 1.2. Canada
- 1.3. Rest of North America
-
2. Europe
- 2.1. Germany
- 2.2. France
- 2.3. United Kingdom
- 2.4. Rest of Europe
-
3. Asia Pacific
- 3.1. China
- 3.2. India
- 3.3. Japan
- 3.4. South Korea
- 3.5. Rest of Asia Pacific
-
4. South America
- 4.1. Brazil
- 4.2. Argentina
- 4.3. Rest of South America
-
5. Middle East and Africa
- 5.1. Saudi Arabia
- 5.2. United Arab Emirates
- 5.3. South Africa
- 5.4. Rest of Middle East and Africa
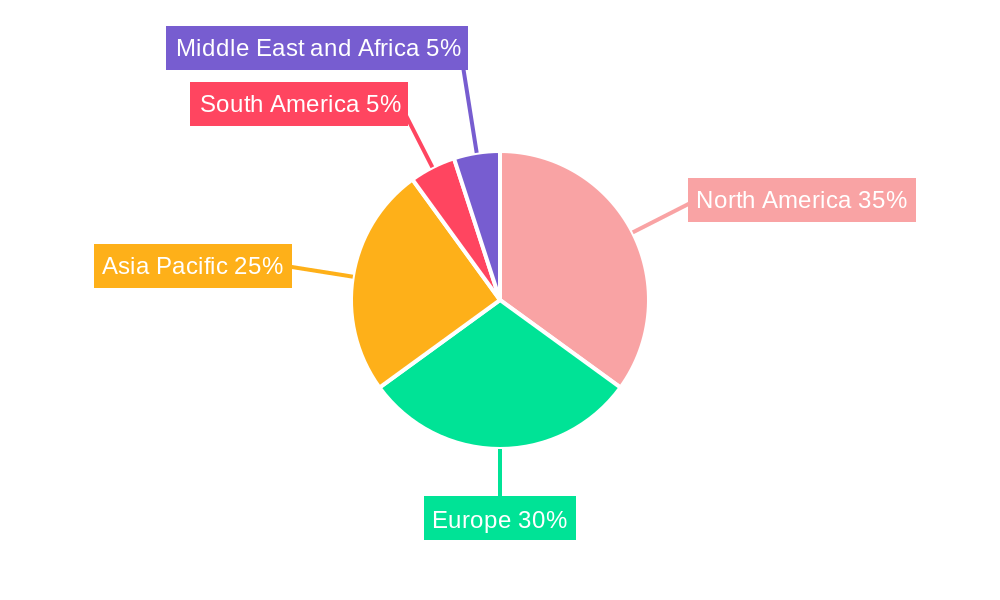
Energy as a Service Industry Regional Market Share
Geographic Coverage of Energy as a Service Industry
Energy as a Service Industry REPORT HIGHLIGHTS
| Aspects | Details |
|---|---|
| Study Period | 2020-2034 |
| Base Year | 2025 |
| Estimated Year | 2026 |
| Forecast Period | 2026-2034 |
| Historical Period | 2020-2025 |
| Growth Rate | CAGR of 12.48% from 2020-2034 |
| Segmentation |
|
Table of Contents
- 1. Introduction
- 1.1. Research Scope
- 1.2. Market Segmentation
- 1.3. Research Objective
- 1.4. Definitions and Assumptions
- 2. Executive Summary
- 2.1. Market Snapshot
- 3. Market Dynamics
- 3.1. Market Drivers
- 3.2. Market Restrains
- 3.3. Market Trends
- 3.4. Market Opportunities
- 4. Market Factor Analysis
- 4.1. Porters Five Forces
- 4.1.1. Bargaining Power of Suppliers
- 4.1.2. Bargaining Power of Buyers
- 4.1.3. Threat of New Entrants
- 4.1.4. Threat of Substitutes
- 4.1.5. Competitive Rivalry
- 4.2. PESTEL analysis
- 4.3. BCG Analysis
- 4.3.1. Stars (High Growth, High Market Share)
- 4.3.2. Cash Cows (Low Growth, High Market Share)
- 4.3.3. Question Mark (High Growth, Low Market Share)
- 4.3.4. Dogs (Low Growth, Low Market Share)
- 4.4. Ansoff Matrix Analysis
- 4.5. Supply Chain Analysis
- 4.6. Regulatory Landscape
- 4.7. Current Market Potential and Opportunity Assessment (TAM–SAM–SOM Framework)
- 4.8. IMR Analyst Note
- 4.1. Porters Five Forces
- 5. Market Analysis, Insights and Forecast 2021-2033
- 5.1. Market Analysis, Insights and Forecast - by End User
- 5.1.1. Commercial
- 5.1.2. Industrial
- 5.2. Market Analysis, Insights and Forecast - by Region
- 5.2.1. North America
- 5.2.2. Europe
- 5.2.3. Asia Pacific
- 5.2.4. South America
- 5.2.5. Middle East and Africa
- 5.1. Market Analysis, Insights and Forecast - by End User
- 6. Global Energy as a Service Industry Analysis, Insights and Forecast, 2021-2033
- 6.1. Market Analysis, Insights and Forecast - by End User
- 6.1.1. Commercial
- 6.1.2. Industrial
- 6.1. Market Analysis, Insights and Forecast - by End User
- 7. North America Energy as a Service Industry Analysis, Insights and Forecast, 2020-2032
- 7.1. Market Analysis, Insights and Forecast - by End User
- 7.1.1. Commercial
- 7.1.2. Industrial
- 7.1. Market Analysis, Insights and Forecast - by End User
- 8. Europe Energy as a Service Industry Analysis, Insights and Forecast, 2020-2032
- 8.1. Market Analysis, Insights and Forecast - by End User
- 8.1.1. Commercial
- 8.1.2. Industrial
- 8.1. Market Analysis, Insights and Forecast - by End User
- 9. Asia Pacific Energy as a Service Industry Analysis, Insights and Forecast, 2020-2032
- 9.1. Market Analysis, Insights and Forecast - by End User
- 9.1.1. Commercial
- 9.1.2. Industrial
- 9.1. Market Analysis, Insights and Forecast - by End User
- 10. South America Energy as a Service Industry Analysis, Insights and Forecast, 2020-2032
- 10.1. Market Analysis, Insights and Forecast - by End User
- 10.1.1. Commercial
- 10.1.2. Industrial
- 10.1. Market Analysis, Insights and Forecast - by End User
- 11. Middle East and Africa Energy as a Service Industry Analysis, Insights and Forecast, 2020-2032
- 11.1. Market Analysis, Insights and Forecast - by End User
- 11.1.1. Commercial
- 11.1.2. Industrial
- 11.1. Market Analysis, Insights and Forecast - by End User
- 12. Competitive Analysis
- 12.1. Company Profiles
- 12.1.1 Honeywell International Inc
- 12.1.1.1. Company Overview
- 12.1.1.2. Products
- 12.1.1.3. Company Financials
- 12.1.1.4. SWOT Analysis
- 12.1.2 Bernhard
- 12.1.2.1. Company Overview
- 12.1.2.2. Products
- 12.1.2.3. Company Financials
- 12.1.2.4. SWOT Analysis
- 12.1.3 Johnson Controls International PLC
- 12.1.3.1. Company Overview
- 12.1.3.2. Products
- 12.1.3.3. Company Financials
- 12.1.3.4. SWOT Analysis
- 12.1.4 Engie SA
- 12.1.4.1. Company Overview
- 12.1.4.2. Products
- 12.1.4.3. Company Financials
- 12.1.4.4. SWOT Analysis
- 12.1.5 Enel SpA
- 12.1.5.1. Company Overview
- 12.1.5.2. Products
- 12.1.5.3. Company Financials
- 12.1.5.4. SWOT Analysis
- 12.1.6 Spark Community Investment Co
- 12.1.6.1. Company Overview
- 12.1.6.2. Products
- 12.1.6.3. Company Financials
- 12.1.6.4. SWOT Analysis
- 12.1.7 Schneider Electric SE
- 12.1.7.1. Company Overview
- 12.1.7.2. Products
- 12.1.7.3. Company Financials
- 12.1.7.4. SWOT Analysis
- 12.1.8 Veolia Environnement SA
- 12.1.8.1. Company Overview
- 12.1.8.2. Products
- 12.1.8.3. Company Financials
- 12.1.8.4. SWOT Analysis
- 12.1.9 Electricite de France (EDF) SA
- 12.1.9.1. Company Overview
- 12.1.9.2. Products
- 12.1.9.3. Company Financials
- 12.1.9.4. SWOT Analysis
- 12.1.1 Honeywell International Inc
- 12.2. Market Entropy
- 12.2.1 Company's Key Areas Served
- 12.2.2 Recent Developments
- 12.3. Company Market Share Analysis 2025
- 12.3.1 Top 5 Companies Market Share Analysis
- 12.3.2 Top 3 Companies Market Share Analysis
- 12.4. List of Potential Customers
- 13. Research Methodology
List of Figures
- Figure 1: Global Energy as a Service Industry Revenue Breakdown (Million, %) by Region 2025 & 2033
- Figure 2: North America Energy as a Service Industry Revenue (Million), by End User 2025 & 2033
- Figure 3: North America Energy as a Service Industry Revenue Share (%), by End User 2025 & 2033
- Figure 4: North America Energy as a Service Industry Revenue (Million), by Country 2025 & 2033
- Figure 5: North America Energy as a Service Industry Revenue Share (%), by Country 2025 & 2033
- Figure 6: Europe Energy as a Service Industry Revenue (Million), by End User 2025 & 2033
- Figure 7: Europe Energy as a Service Industry Revenue Share (%), by End User 2025 & 2033
- Figure 8: Europe Energy as a Service Industry Revenue (Million), by Country 2025 & 2033
- Figure 9: Europe Energy as a Service Industry Revenue Share (%), by Country 2025 & 2033
- Figure 10: Asia Pacific Energy as a Service Industry Revenue (Million), by End User 2025 & 2033
- Figure 11: Asia Pacific Energy as a Service Industry Revenue Share (%), by End User 2025 & 2033
- Figure 12: Asia Pacific Energy as a Service Industry Revenue (Million), by Country 2025 & 2033
- Figure 13: Asia Pacific Energy as a Service Industry Revenue Share (%), by Country 2025 & 2033
- Figure 14: South America Energy as a Service Industry Revenue (Million), by End User 2025 & 2033
- Figure 15: South America Energy as a Service Industry Revenue Share (%), by End User 2025 & 2033
- Figure 16: South America Energy as a Service Industry Revenue (Million), by Country 2025 & 2033
- Figure 17: South America Energy as a Service Industry Revenue Share (%), by Country 2025 & 2033
- Figure 18: Middle East and Africa Energy as a Service Industry Revenue (Million), by End User 2025 & 2033
- Figure 19: Middle East and Africa Energy as a Service Industry Revenue Share (%), by End User 2025 & 2033
- Figure 20: Middle East and Africa Energy as a Service Industry Revenue (Million), by Country 2025 & 2033
- Figure 21: Middle East and Africa Energy as a Service Industry Revenue Share (%), by Country 2025 & 2033
List of Tables
- Table 1: Global Energy as a Service Industry Revenue Million Forecast, by End User 2020 & 2033
- Table 2: Global Energy as a Service Industry Revenue Million Forecast, by Region 2020 & 2033
- Table 3: Global Energy as a Service Industry Revenue Million Forecast, by End User 2020 & 2033
- Table 4: Global Energy as a Service Industry Revenue Million Forecast, by Country 2020 & 2033
- Table 5: United States Energy as a Service Industry Revenue (Million) Forecast, by Application 2020 & 2033
- Table 6: Canada Energy as a Service Industry Revenue (Million) Forecast, by Application 2020 & 2033
- Table 7: Rest of North America Energy as a Service Industry Revenue (Million) Forecast, by Application 2020 & 2033
- Table 8: Global Energy as a Service Industry Revenue Million Forecast, by End User 2020 & 2033
- Table 9: Global Energy as a Service Industry Revenue Million Forecast, by Country 2020 & 2033
- Table 10: Germany Energy as a Service Industry Revenue (Million) Forecast, by Application 2020 & 2033
- Table 11: France Energy as a Service Industry Revenue (Million) Forecast, by Application 2020 & 2033
- Table 12: United Kingdom Energy as a Service Industry Revenue (Million) Forecast, by Application 2020 & 2033
- Table 13: Rest of Europe Energy as a Service Industry Revenue (Million) Forecast, by Application 2020 & 2033
- Table 14: Global Energy as a Service Industry Revenue Million Forecast, by End User 2020 & 2033
- Table 15: Global Energy as a Service Industry Revenue Million Forecast, by Country 2020 & 2033
- Table 16: China Energy as a Service Industry Revenue (Million) Forecast, by Application 2020 & 2033
- Table 17: India Energy as a Service Industry Revenue (Million) Forecast, by Application 2020 & 2033
- Table 18: Japan Energy as a Service Industry Revenue (Million) Forecast, by Application 2020 & 2033
- Table 19: South Korea Energy as a Service Industry Revenue (Million) Forecast, by Application 2020 & 2033
- Table 20: Rest of Asia Pacific Energy as a Service Industry Revenue (Million) Forecast, by Application 2020 & 2033
- Table 21: Global Energy as a Service Industry Revenue Million Forecast, by End User 2020 & 2033
- Table 22: Global Energy as a Service Industry Revenue Million Forecast, by Country 2020 & 2033
- Table 23: Brazil Energy as a Service Industry Revenue (Million) Forecast, by Application 2020 & 2033
- Table 24: Argentina Energy as a Service Industry Revenue (Million) Forecast, by Application 2020 & 2033
- Table 25: Rest of South America Energy as a Service Industry Revenue (Million) Forecast, by Application 2020 & 2033
- Table 26: Global Energy as a Service Industry Revenue Million Forecast, by End User 2020 & 2033
- Table 27: Global Energy as a Service Industry Revenue Million Forecast, by Country 2020 & 2033
- Table 28: Saudi Arabia Energy as a Service Industry Revenue (Million) Forecast, by Application 2020 & 2033
- Table 29: United Arab Emirates Energy as a Service Industry Revenue (Million) Forecast, by Application 2020 & 2033
- Table 30: South Africa Energy as a Service Industry Revenue (Million) Forecast, by Application 2020 & 2033
- Table 31: Rest of Middle East and Africa Energy as a Service Industry Revenue (Million) Forecast, by Application 2020 & 2033
Frequently Asked Questions
1. What is the projected Compound Annual Growth Rate (CAGR) of the Energy as a Service Industry?
The projected CAGR is approximately 12.48%.
2. Which companies are prominent players in the Energy as a Service Industry?
Key companies in the market include Honeywell International Inc, Bernhard, Johnson Controls International PLC, Engie SA, Enel SpA, Spark Community Investment Co, Schneider Electric SE, Veolia Environnement SA, Electricite de France (EDF) SA.
3. What are the main segments of the Energy as a Service Industry?
The market segments include End User.
4. Can you provide details about the market size?
The market size is estimated to be USD 94.16 Million as of 2022.
5. What are some drivers contributing to market growth?
4.; Growing Demand for Energy As A Service4.; Increasing Adoption of Distributed Energy Generation in Commercial and Industrial Sectors.
6. What are the notable trends driving market growth?
Commercial Segment to Dominate the Market.
7. Are there any restraints impacting market growth?
4.; Lack of Awareness in Developing Economies and High Technological Costs.
8. Can you provide examples of recent developments in the market?
April 2023: Capstone Green Energy Corporation announced that its southern U.S. distributor, Lone Star Power Solutions, contracted with a large West Texas energy company to deliver an additional C800S Signature Series microturbine following Energy-as-a-Service (EaaS) for 3.6 MW contract earlier this year.
9. What pricing options are available for accessing the report?
Pricing options include single-user, multi-user, and enterprise licenses priced at USD 4750, USD 5250, and USD 8750 respectively.
10. Is the market size provided in terms of value or volume?
The market size is provided in terms of value, measured in Million.
11. Are there any specific market keywords associated with the report?
Yes, the market keyword associated with the report is "Energy as a Service Industry," which aids in identifying and referencing the specific market segment covered.
12. How do I determine which pricing option suits my needs best?
The pricing options vary based on user requirements and access needs. Individual users may opt for single-user licenses, while businesses requiring broader access may choose multi-user or enterprise licenses for cost-effective access to the report.
13. Are there any additional resources or data provided in the Energy as a Service Industry report?
While the report offers comprehensive insights, it's advisable to review the specific contents or supplementary materials provided to ascertain if additional resources or data are available.
14. How can I stay updated on further developments or reports in the Energy as a Service Industry?
To stay informed about further developments, trends, and reports in the Energy as a Service Industry, consider subscribing to industry newsletters, following relevant companies and organizations, or regularly checking reputable industry news sources and publications.
Methodology
Step 1 - Identification of Relevant Samples Size from Population Database


Step 2 - Approaches for Defining Global Market Size (Value, Volume* & Price*)

Note*: In applicable scenarios
Step 3 - Data Sources
Primary Research
- Web Analytics
- Survey Reports
- Research Institute
- Latest Research Reports
- Opinion Leaders
Secondary Research
- Annual Reports
- White Paper
- Latest Press Release
- Industry Association
- Paid Database
- Investor Presentations

Step 4 - Data Triangulation
Involves using different sources of information in order to increase the validity of a study
These sources are likely to be stakeholders in a program - participants, other researchers, program staff, other community members, and so on.
Then we put all data in single framework & apply various statistical tools to find out the dynamic on the market.
During the analysis stage, feedback from the stakeholder groups would be compared to determine areas of agreement as well as areas of divergence