

Key Insights
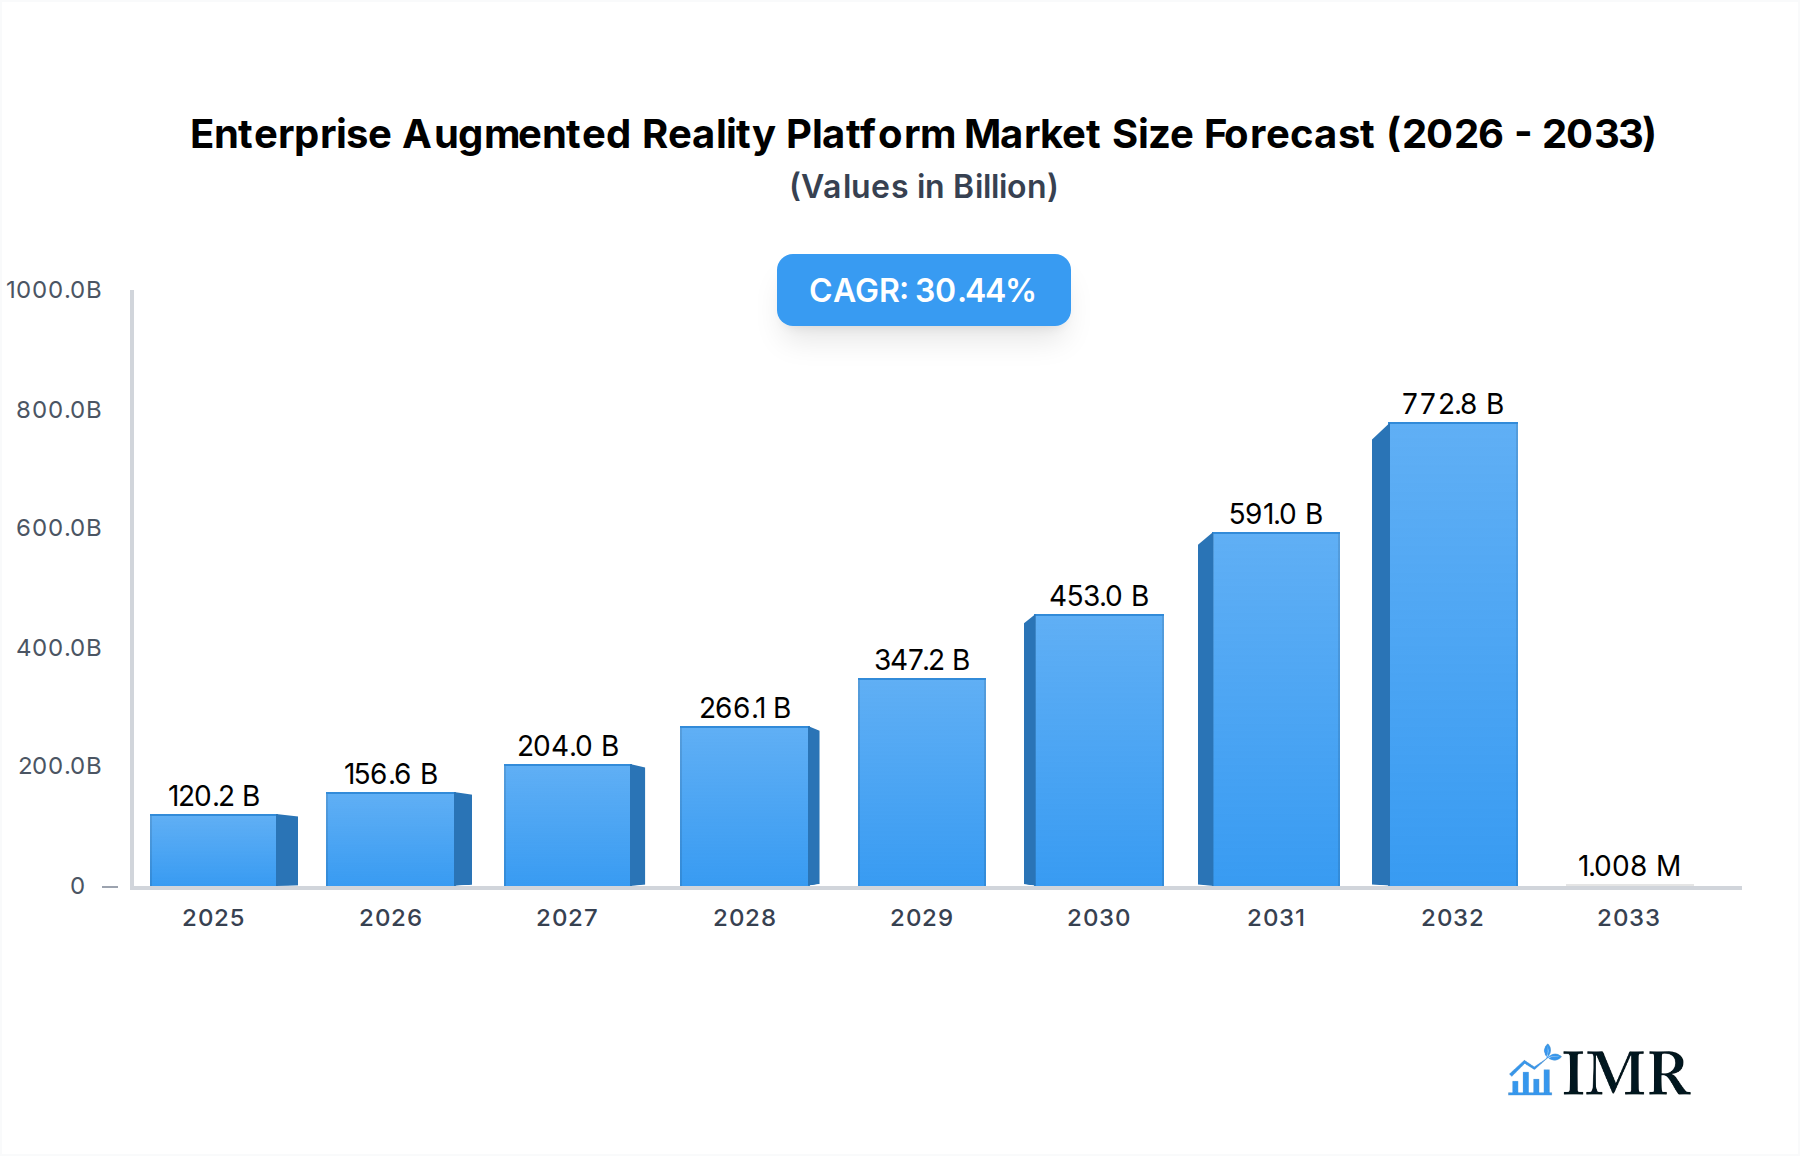
The Enterprise Augmented Reality (AR) Platform market is poised for exceptional growth, projected to reach $120.21 billion by 2025. This robust expansion is driven by an impressive CAGR of 29.7%, indicating a significant acceleration in adoption and investment over the forecast period of 2025-2033. The increasing demand for enhanced operational efficiency, improved training methodologies, and more immersive customer experiences across various industries is fueling this upward trajectory. Large enterprises, in particular, are at the forefront of adopting these platforms to streamline complex processes, from field service and maintenance to design and collaboration. The integration of AR hardware, such as smart glasses and tablets, with sophisticated software solutions is creating a powerful synergy, enabling real-time data visualization and interactive guidance for employees. This transformative technology is moving beyond niche applications to become an integral part of digital transformation strategies for businesses worldwide.

Enterprise Augmented Reality Platform Market Size (In Billion)
Several key trends are shaping the Enterprise AR Platform landscape. The growing maturity of AR hardware, coupled with advancements in cloud computing and 5G technology, is making AR solutions more accessible, scalable, and cost-effective. The development of AI-powered AR experiences, offering intelligent insights and predictive analytics, is further enhancing the value proposition for businesses. While the market is experiencing rapid growth, challenges such as the initial cost of implementation, the need for skilled personnel, and ensuring data security and privacy remain critical considerations. Overcoming these restraints will be pivotal for widespread adoption. Key players like PTC, Microsoft (implied through general market trends), and others are investing heavily in research and development to offer comprehensive platforms that address these challenges and unlock the full potential of AR in enterprise settings. The Asia Pacific region is anticipated to emerge as a significant growth engine, driven by rapid industrialization and increasing government support for technology adoption.
Enterprise Augmented Reality Platform Company Market Share
Enterprise Augmented Reality Platform Market Dynamics & Structure
The global Enterprise Augmented Reality (AR) Platform market is characterized by a dynamic interplay of technological innovation, evolving regulatory landscapes, and intense competition. Market concentration is moderately fragmented, with established technology giants and agile startups vying for dominance. Technological innovation is the primary driver, fueled by advancements in AI, 5G, computer vision, and immersive display technologies, creating new use cases across industries. Regulatory frameworks are still nascent, primarily focusing on data privacy and intellectual property, which can act as both enablers and barriers to widespread adoption. Competitive product substitutes include traditional training methods, video conferencing, and other digital collaboration tools, though AR offers a distinct level of immersion and interactivity. End-user demographics are expanding from early adopters in manufacturing and field service to broader enterprise segments seeking enhanced productivity, reduced operational costs, and improved employee training. Mergers and acquisitions (M&A) are on the rise as larger players seek to acquire innovative technologies and expand their market reach. For instance, the average annual deal volume for AR-related M&A has seen a steady increase of 15% over the historical period. The barrier to entry for new players is moderate, requiring significant R&D investment and strategic partnerships.
- Market Concentration: Moderately fragmented, with key players holding significant but not dominant market share.
- Technological Innovation Drivers: AI integration, 5G network capabilities, advancements in computer vision and spatial computing.
- Regulatory Frameworks: Evolving data privacy laws (e.g., GDPR, CCPA) and emerging standards for AR content and device interoperability.
- Competitive Product Substitutes: Traditional manuals, video-based training, VR platforms, and advanced remote assistance tools.
- End-User Demographics: Primarily large enterprises in manufacturing, healthcare, logistics, and retail, with growing adoption in SMEs.
- M&A Trends: Increasing consolidation as established companies acquire specialized AR startups for talent and technology.
Enterprise Augmented Reality Platform Growth Trends & Insights
The global Enterprise Augmented Reality Platform market is poised for substantial expansion, driven by a convergence of technological advancements and a growing recognition of its transformative potential across diverse industries. The market size is projected to escalate from an estimated $15.6 billion in 2025 to a projected $78.9 billion by 2033, exhibiting a robust Compound Annual Growth Rate (CAGR) of approximately 23.5% during the forecast period of 2025–2033. This remarkable growth trajectory is underpinned by increasing adoption rates, particularly within large enterprises seeking to optimize operations, enhance workforce efficiency, and drive innovation. Technological disruptions, such as the widespread deployment of 5G networks and the miniaturization of AR hardware, are significantly lowering adoption barriers and enhancing the user experience, moving from niche applications to mainstream enterprise solutions.
Consumer behavior shifts, while more pronounced in the consumer AR space, are indirectly influencing enterprise adoption. Employees accustomed to intuitive digital interfaces in their personal lives are increasingly expecting similar levels of user-friendliness and functionality from their professional tools. This demand is pushing enterprises to invest in AR platforms that offer seamless integration with existing workflows and provide immediate value. The market penetration of Enterprise AR Platforms, currently at an estimated 12.2% in 2025, is expected to surge to over 45% by 2033 as more businesses recognize the tangible ROI offered by AR in areas like remote assistance, training, design visualization, and quality control.
The evolution from basic AR overlays to sophisticated, context-aware intelligent AR experiences, powered by AI and machine learning, is a critical trend. These intelligent AR platforms can provide real-time guidance, predictive maintenance alerts, and personalized learning modules, thereby unlocking new levels of productivity and reducing operational downtime. Furthermore, the increasing affordability and accessibility of AR hardware, coupled with the development of more robust and scalable AR software platforms, are further accelerating market adoption. The shift towards cloud-based AR solutions is also a significant growth accelerator, enabling easier deployment, management, and scalability for enterprises of all sizes. The ability to provide immersive, hands-on learning experiences without the need for physical presence is particularly valuable in a world increasingly reliant on remote work and distributed teams.
Dominant Regions, Countries, or Segments in Enterprise Augmented Reality Platform
The global Enterprise Augmented Reality Platform market exhibits distinct regional and sectoral dominance, with North America and Europe leading in adoption and innovation. Within these regions, the Application: large Enterprise segment is the primary growth engine, driven by substantial investment capacity and the critical need to optimize complex operational workflows. The Type: Software segment is also experiencing rapid expansion, as sophisticated platforms offering advanced analytics, AI integration, and seamless integration capabilities become indispensable for unlocking the full potential of AR.
In North America, the United States spearheads the market, fueled by a mature technology ecosystem, significant R&D expenditure, and the presence of leading AR platform providers. Key drivers include robust government initiatives supporting digital transformation, a high concentration of Fortune 500 companies in sectors like technology, manufacturing, and healthcare, and a strong demand for remote assistance and guided workflows. The market penetration in the US is estimated to reach 15.5% in 2025, with a projected market share of 35% of the global Enterprise AR Platform market by the same year. Economic policies favoring innovation and substantial venture capital funding for AR startups further solidify its dominant position.
Europe follows closely, with Germany, the UK, and France emerging as key markets. The European region's dominance is bolstered by strong industrial sectors, particularly in automotive and aerospace, where AR offers significant advantages in design, assembly, and maintenance. The increasing focus on Industry 4.0 initiatives and the adoption of smart factory concepts are driving the demand for AR solutions. Furthermore, the European Union’s commitment to digital single market policies and funding for cross-border innovation projects contribute to market growth. Germany, in particular, is a powerhouse, with an estimated market share of 18% in the global Enterprise AR Platform market in 2025, driven by its strong manufacturing base and a growing ecosystem of AR solution providers.
The Type: Software segment is projected to account for approximately 65% of the total market revenue in 2025, indicating a strong preference for platform-based solutions that offer flexibility and scalability. This dominance is attributed to the increasing sophistication of AR software, enabling advanced features like AI-powered object recognition, real-time data overlay, and personalized user experiences. As enterprises seek integrated solutions rather than standalone hardware, the software component of AR platforms becomes increasingly critical. This segment's growth potential is further amplified by the growing adoption of cloud-based AR solutions, which facilitate easier deployment and management for large enterprises.
While SMEs are a significant and growing segment, particularly in specific use cases, large enterprises currently command a larger market share due to their greater investment capabilities and the scale of their operational challenges that AR can effectively address. However, the decreasing cost of AR hardware and the availability of more accessible software solutions are expected to drive accelerated adoption among SMEs in the coming years, particularly in sectors like retail and professional services.
Enterprise Augmented Reality Platform Product Landscape
The Enterprise Augmented Reality Platform product landscape is evolving rapidly, characterized by a focus on enhanced interactivity, AI-driven intelligence, and seamless integration. Leading platforms are now offering sophisticated features such as real-time 3D model manipulation, guided workflows with step-by-step instructions overlaid onto the real world, and collaborative AR environments for remote teamwork. Unique selling propositions often lie in the platform's ability to support a wide range of AR devices, from smart glasses to mobile phones, and its capacity to integrate with existing enterprise software like ERP and PLM systems. Technological advancements are pushing the boundaries of AR applications, enabling predictive maintenance alerts directly within a technician's field of view, immersive product design reviews, and highly personalized training modules that adapt to individual learning paces. The performance of these platforms is increasingly measured by their efficiency in reducing task completion times, minimizing errors, and improving knowledge transfer.
Key Drivers, Barriers & Challenges in Enterprise Augmented Reality Platform
Key Drivers:
- Enhanced Operational Efficiency: AR platforms significantly reduce downtime, improve first-time fix rates in field service, and streamline complex assembly processes.
- Improved Training and Skill Development: Immersive AR training modules offer hands-on experience, accelerate learning curves, and reduce the need for physical training resources.
- Cost Reduction: AR solutions minimize travel costs for remote assistance, reduce errors that lead to scrap or rework, and optimize inventory management.
- Technological Advancements: The continuous improvement in AR hardware (lighter, more powerful headsets) and software (AI, computer vision) makes solutions more viable and accessible.
Barriers & Challenges:
- High Initial Investment: While decreasing, the upfront cost of hardware, software licenses, and implementation can still be a barrier for some enterprises.
- Integration Complexity: Integrating AR platforms with existing legacy systems can be challenging and require significant IT resources.
- Lack of Standardization: The absence of universal standards for AR content creation and device interoperability can lead to vendor lock-in.
- Employee Adoption and Training: Overcoming resistance to new technology and ensuring adequate training for all users is crucial for successful deployment.
- Data Security and Privacy Concerns: The collection and transmission of sensitive operational data via AR platforms raise important security and privacy considerations.
Emerging Opportunities in Enterprise Augmented Reality Platform
Emerging opportunities in the Enterprise AR Platform sector lie in the continued development of AI-powered intelligent AR, which can proactively guide users and provide predictive insights. The expansion of AR into new verticals such as retail for enhanced customer experiences (virtual try-ons, in-store navigation) and education for interactive learning environments presents untapped markets. Furthermore, the growth of the metaverse and its potential integration with enterprise workflows offers a significant avenue for collaboration and visualization. The increasing demand for personalized and adaptive training solutions, especially in high-risk industries, is another key opportunity.
Growth Accelerators in the Enterprise Augmented Reality Platform Industry
Several catalysts are accelerating the growth of the Enterprise AR Platform industry. Technological breakthroughs, particularly in areas like spatial computing, edge AI, and advanced haptic feedback, are enhancing the realism and utility of AR experiences. Strategic partnerships between hardware manufacturers, software developers, and cloud providers are creating more integrated and end-to-end solutions, simplifying adoption for enterprises. Market expansion strategies, including the development of specialized AR solutions for niche industries and the increasing accessibility of AR platforms for SMEs, are broadening the market reach. The growing ecosystem of developers and content creators is also fueling innovation and creating a wider array of compelling AR applications.
Key Players Shaping the Enterprise Augmented Reality Platform Market
- AMA
- Atheer
- CareAR
- Librestream
- OverIT
- PTC
- RE'FLEKT
- ScopeAR
- Taqtile
- TeamViewer
Notable Milestones in Enterprise Augmented Reality Platform Sector
- 2020/04: Microsoft HoloLens 2 gains widespread enterprise adoption for remote assistance and training.
- 2021/01: PTC's Vuforia Engine integrates advanced AI capabilities for object recognition and tracking.
- 2021/07: TeamViewer acquires Ubimax, strengthening its enterprise AR remote assistance portfolio.
- 2022/03: ScopeAR launches a new platform focused on AR-guided assembly and quality control.
- 2022/09: CareAR expands its remote assistance capabilities with advanced collaboration tools.
- 2023/01: Librestream introduces enhanced analytics for its AR platform, providing deeper insights into field operations.
- 2023/05: OverIT enhances its AR platform with advanced 5G integration for real-time data streaming.
- 2023/11: RE'FLEKT introduces AI-driven AR content creation tools for faster deployment.
- 2024/02: Taqtile releases a new version of its AR platform with improved collaboration features for frontline workers.
- 2024/06: Atheer announces significant performance improvements in its AR platform for complex industrial use cases.
In-Depth Enterprise Augmented Reality Platform Market Outlook
The Enterprise Augmented Reality Platform market is projected for sustained and significant growth, driven by the ongoing digital transformation initiatives across global industries. The integration of AI and 5G technology will continue to be pivotal, enabling more intelligent, responsive, and immersive AR experiences. Strategic partnerships and M&A activities are expected to consolidate the market, leading to more comprehensive solution offerings. The expansion of AR into new application areas, coupled with increasing affordability and user-friendliness, will drive higher adoption rates among both large enterprises and SMEs. This evolution promises to unlock substantial value by enhancing productivity, reducing operational costs, and fostering innovation in the years to come.
Enterprise Augmented Reality Platform Segmentation
-
1. Application
- 1.1. large Enterprise
- 1.2. SME
-
2. Type
- 2.1. Hardware
- 2.2. Software
Enterprise Augmented Reality Platform Segmentation By Geography
-
1. North America
- 1.1. United States
- 1.2. Canada
- 1.3. Mexico
-
2. South America
- 2.1. Brazil
- 2.2. Argentina
- 2.3. Rest of South America
-
3. Europe
- 3.1. United Kingdom
- 3.2. Germany
- 3.3. France
- 3.4. Italy
- 3.5. Spain
- 3.6. Russia
- 3.7. Benelux
- 3.8. Nordics
- 3.9. Rest of Europe
-
4. Middle East & Africa
- 4.1. Turkey
- 4.2. Israel
- 4.3. GCC
- 4.4. North Africa
- 4.5. South Africa
- 4.6. Rest of Middle East & Africa
-
5. Asia Pacific
- 5.1. China
- 5.2. India
- 5.3. Japan
- 5.4. South Korea
- 5.5. ASEAN
- 5.6. Oceania
- 5.7. Rest of Asia Pacific

Enterprise Augmented Reality Platform Regional Market Share
Geographic Coverage of Enterprise Augmented Reality Platform
Enterprise Augmented Reality Platform REPORT HIGHLIGHTS
| Aspects | Details |
|---|---|
| Study Period | 2020-2034 |
| Base Year | 2025 |
| Estimated Year | 2026 |
| Forecast Period | 2026-2034 |
| Historical Period | 2020-2025 |
| Growth Rate | CAGR of 28.3% from 2020-2034 |
| Segmentation |
|
Table of Contents
- 1. Introduction
- 1.1. Research Scope
- 1.2. Market Segmentation
- 1.3. Research Objective
- 1.4. Definitions and Assumptions
- 2. Executive Summary
- 2.1. Market Snapshot
- 3. Market Dynamics
- 3.1. Market Drivers
- 3.2. Market Restrains
- 3.3. Market Trends
- 3.4. Market Opportunities
- 4. Market Factor Analysis
- 4.1. Porters Five Forces
- 4.1.1. Bargaining Power of Suppliers
- 4.1.2. Bargaining Power of Buyers
- 4.1.3. Threat of New Entrants
- 4.1.4. Threat of Substitutes
- 4.1.5. Competitive Rivalry
- 4.2. PESTEL analysis
- 4.3. BCG Analysis
- 4.3.1. Stars (High Growth, High Market Share)
- 4.3.2. Cash Cows (Low Growth, High Market Share)
- 4.3.3. Question Mark (High Growth, Low Market Share)
- 4.3.4. Dogs (Low Growth, Low Market Share)
- 4.4. Ansoff Matrix Analysis
- 4.5. Supply Chain Analysis
- 4.6. Regulatory Landscape
- 4.7. Current Market Potential and Opportunity Assessment (TAM–SAM–SOM Framework)
- 4.8. IMR Analyst Note
- 4.1. Porters Five Forces
- 5. Market Analysis, Insights and Forecast 2021-2033
- 5.1. Market Analysis, Insights and Forecast - by Application
- 5.1.1. large Enterprise
- 5.1.2. SME
- 5.2. Market Analysis, Insights and Forecast - by Type
- 5.2.1. Hardware
- 5.2.2. Software
- 5.3. Market Analysis, Insights and Forecast - by Region
- 5.3.1. North America
- 5.3.2. South America
- 5.3.3. Europe
- 5.3.4. Middle East & Africa
- 5.3.5. Asia Pacific
- 5.1. Market Analysis, Insights and Forecast - by Application
- 6. Global Enterprise Augmented Reality Platform Analysis, Insights and Forecast, 2021-2033
- 6.1. Market Analysis, Insights and Forecast - by Application
- 6.1.1. large Enterprise
- 6.1.2. SME
- 6.2. Market Analysis, Insights and Forecast - by Type
- 6.2.1. Hardware
- 6.2.2. Software
- 6.1. Market Analysis, Insights and Forecast - by Application
- 7. North America Enterprise Augmented Reality Platform Analysis, Insights and Forecast, 2020-2032
- 7.1. Market Analysis, Insights and Forecast - by Application
- 7.1.1. large Enterprise
- 7.1.2. SME
- 7.2. Market Analysis, Insights and Forecast - by Type
- 7.2.1. Hardware
- 7.2.2. Software
- 7.1. Market Analysis, Insights and Forecast - by Application
- 8. South America Enterprise Augmented Reality Platform Analysis, Insights and Forecast, 2020-2032
- 8.1. Market Analysis, Insights and Forecast - by Application
- 8.1.1. large Enterprise
- 8.1.2. SME
- 8.2. Market Analysis, Insights and Forecast - by Type
- 8.2.1. Hardware
- 8.2.2. Software
- 8.1. Market Analysis, Insights and Forecast - by Application
- 9. Europe Enterprise Augmented Reality Platform Analysis, Insights and Forecast, 2020-2032
- 9.1. Market Analysis, Insights and Forecast - by Application
- 9.1.1. large Enterprise
- 9.1.2. SME
- 9.2. Market Analysis, Insights and Forecast - by Type
- 9.2.1. Hardware
- 9.2.2. Software
- 9.1. Market Analysis, Insights and Forecast - by Application
- 10. Middle East & Africa Enterprise Augmented Reality Platform Analysis, Insights and Forecast, 2020-2032
- 10.1. Market Analysis, Insights and Forecast - by Application
- 10.1.1. large Enterprise
- 10.1.2. SME
- 10.2. Market Analysis, Insights and Forecast - by Type
- 10.2.1. Hardware
- 10.2.2. Software
- 10.1. Market Analysis, Insights and Forecast - by Application
- 11. Asia Pacific Enterprise Augmented Reality Platform Analysis, Insights and Forecast, 2020-2032
- 11.1. Market Analysis, Insights and Forecast - by Application
- 11.1.1. large Enterprise
- 11.1.2. SME
- 11.2. Market Analysis, Insights and Forecast - by Type
- 11.2.1. Hardware
- 11.2.2. Software
- 11.1. Market Analysis, Insights and Forecast - by Application
- 12. Competitive Analysis
- 12.1. Company Profiles
- 12.1.1 AMA
- 12.1.1.1. Company Overview
- 12.1.1.2. Products
- 12.1.1.3. Company Financials
- 12.1.1.4. SWOT Analysis
- 12.1.2 Atheer
- 12.1.2.1. Company Overview
- 12.1.2.2. Products
- 12.1.2.3. Company Financials
- 12.1.2.4. SWOT Analysis
- 12.1.3 CareAR
- 12.1.3.1. Company Overview
- 12.1.3.2. Products
- 12.1.3.3. Company Financials
- 12.1.3.4. SWOT Analysis
- 12.1.4 Librestream
- 12.1.4.1. Company Overview
- 12.1.4.2. Products
- 12.1.4.3. Company Financials
- 12.1.4.4. SWOT Analysis
- 12.1.5 OverIT
- 12.1.5.1. Company Overview
- 12.1.5.2. Products
- 12.1.5.3. Company Financials
- 12.1.5.4. SWOT Analysis
- 12.1.6 PTC
- 12.1.6.1. Company Overview
- 12.1.6.2. Products
- 12.1.6.3. Company Financials
- 12.1.6.4. SWOT Analysis
- 12.1.7 RE'FLEKT
- 12.1.7.1. Company Overview
- 12.1.7.2. Products
- 12.1.7.3. Company Financials
- 12.1.7.4. SWOT Analysis
- 12.1.8 ScopeAR
- 12.1.8.1. Company Overview
- 12.1.8.2. Products
- 12.1.8.3. Company Financials
- 12.1.8.4. SWOT Analysis
- 12.1.9 Taqtile
- 12.1.9.1. Company Overview
- 12.1.9.2. Products
- 12.1.9.3. Company Financials
- 12.1.9.4. SWOT Analysis
- 12.1.10 TeamViewer
- 12.1.10.1. Company Overview
- 12.1.10.2. Products
- 12.1.10.3. Company Financials
- 12.1.10.4. SWOT Analysis
- 12.1.1 AMA
- 12.2. Market Entropy
- 12.2.1 Company's Key Areas Served
- 12.2.2 Recent Developments
- 12.3. Company Market Share Analysis 2025
- 12.3.1 Top 5 Companies Market Share Analysis
- 12.3.2 Top 3 Companies Market Share Analysis
- 12.4. List of Potential Customers
- 13. Research Methodology
List of Figures
- Figure 1: Global Enterprise Augmented Reality Platform Revenue Breakdown (million, %) by Region 2025 & 2033
- Figure 2: North America Enterprise Augmented Reality Platform Revenue (million), by Application 2025 & 2033
- Figure 3: North America Enterprise Augmented Reality Platform Revenue Share (%), by Application 2025 & 2033
- Figure 4: North America Enterprise Augmented Reality Platform Revenue (million), by Type 2025 & 2033
- Figure 5: North America Enterprise Augmented Reality Platform Revenue Share (%), by Type 2025 & 2033
- Figure 6: North America Enterprise Augmented Reality Platform Revenue (million), by Country 2025 & 2033
- Figure 7: North America Enterprise Augmented Reality Platform Revenue Share (%), by Country 2025 & 2033
- Figure 8: South America Enterprise Augmented Reality Platform Revenue (million), by Application 2025 & 2033
- Figure 9: South America Enterprise Augmented Reality Platform Revenue Share (%), by Application 2025 & 2033
- Figure 10: South America Enterprise Augmented Reality Platform Revenue (million), by Type 2025 & 2033
- Figure 11: South America Enterprise Augmented Reality Platform Revenue Share (%), by Type 2025 & 2033
- Figure 12: South America Enterprise Augmented Reality Platform Revenue (million), by Country 2025 & 2033
- Figure 13: South America Enterprise Augmented Reality Platform Revenue Share (%), by Country 2025 & 2033
- Figure 14: Europe Enterprise Augmented Reality Platform Revenue (million), by Application 2025 & 2033
- Figure 15: Europe Enterprise Augmented Reality Platform Revenue Share (%), by Application 2025 & 2033
- Figure 16: Europe Enterprise Augmented Reality Platform Revenue (million), by Type 2025 & 2033
- Figure 17: Europe Enterprise Augmented Reality Platform Revenue Share (%), by Type 2025 & 2033
- Figure 18: Europe Enterprise Augmented Reality Platform Revenue (million), by Country 2025 & 2033
- Figure 19: Europe Enterprise Augmented Reality Platform Revenue Share (%), by Country 2025 & 2033
- Figure 20: Middle East & Africa Enterprise Augmented Reality Platform Revenue (million), by Application 2025 & 2033
- Figure 21: Middle East & Africa Enterprise Augmented Reality Platform Revenue Share (%), by Application 2025 & 2033
- Figure 22: Middle East & Africa Enterprise Augmented Reality Platform Revenue (million), by Type 2025 & 2033
- Figure 23: Middle East & Africa Enterprise Augmented Reality Platform Revenue Share (%), by Type 2025 & 2033
- Figure 24: Middle East & Africa Enterprise Augmented Reality Platform Revenue (million), by Country 2025 & 2033
- Figure 25: Middle East & Africa Enterprise Augmented Reality Platform Revenue Share (%), by Country 2025 & 2033
- Figure 26: Asia Pacific Enterprise Augmented Reality Platform Revenue (million), by Application 2025 & 2033
- Figure 27: Asia Pacific Enterprise Augmented Reality Platform Revenue Share (%), by Application 2025 & 2033
- Figure 28: Asia Pacific Enterprise Augmented Reality Platform Revenue (million), by Type 2025 & 2033
- Figure 29: Asia Pacific Enterprise Augmented Reality Platform Revenue Share (%), by Type 2025 & 2033
- Figure 30: Asia Pacific Enterprise Augmented Reality Platform Revenue (million), by Country 2025 & 2033
- Figure 31: Asia Pacific Enterprise Augmented Reality Platform Revenue Share (%), by Country 2025 & 2033
List of Tables
- Table 1: Global Enterprise Augmented Reality Platform Revenue million Forecast, by Application 2020 & 2033
- Table 2: Global Enterprise Augmented Reality Platform Revenue million Forecast, by Type 2020 & 2033
- Table 3: Global Enterprise Augmented Reality Platform Revenue million Forecast, by Region 2020 & 2033
- Table 4: Global Enterprise Augmented Reality Platform Revenue million Forecast, by Application 2020 & 2033
- Table 5: Global Enterprise Augmented Reality Platform Revenue million Forecast, by Type 2020 & 2033
- Table 6: Global Enterprise Augmented Reality Platform Revenue million Forecast, by Country 2020 & 2033
- Table 7: United States Enterprise Augmented Reality Platform Revenue (million) Forecast, by Application 2020 & 2033
- Table 8: Canada Enterprise Augmented Reality Platform Revenue (million) Forecast, by Application 2020 & 2033
- Table 9: Mexico Enterprise Augmented Reality Platform Revenue (million) Forecast, by Application 2020 & 2033
- Table 10: Global Enterprise Augmented Reality Platform Revenue million Forecast, by Application 2020 & 2033
- Table 11: Global Enterprise Augmented Reality Platform Revenue million Forecast, by Type 2020 & 2033
- Table 12: Global Enterprise Augmented Reality Platform Revenue million Forecast, by Country 2020 & 2033
- Table 13: Brazil Enterprise Augmented Reality Platform Revenue (million) Forecast, by Application 2020 & 2033
- Table 14: Argentina Enterprise Augmented Reality Platform Revenue (million) Forecast, by Application 2020 & 2033
- Table 15: Rest of South America Enterprise Augmented Reality Platform Revenue (million) Forecast, by Application 2020 & 2033
- Table 16: Global Enterprise Augmented Reality Platform Revenue million Forecast, by Application 2020 & 2033
- Table 17: Global Enterprise Augmented Reality Platform Revenue million Forecast, by Type 2020 & 2033
- Table 18: Global Enterprise Augmented Reality Platform Revenue million Forecast, by Country 2020 & 2033
- Table 19: United Kingdom Enterprise Augmented Reality Platform Revenue (million) Forecast, by Application 2020 & 2033
- Table 20: Germany Enterprise Augmented Reality Platform Revenue (million) Forecast, by Application 2020 & 2033
- Table 21: France Enterprise Augmented Reality Platform Revenue (million) Forecast, by Application 2020 & 2033
- Table 22: Italy Enterprise Augmented Reality Platform Revenue (million) Forecast, by Application 2020 & 2033
- Table 23: Spain Enterprise Augmented Reality Platform Revenue (million) Forecast, by Application 2020 & 2033
- Table 24: Russia Enterprise Augmented Reality Platform Revenue (million) Forecast, by Application 2020 & 2033
- Table 25: Benelux Enterprise Augmented Reality Platform Revenue (million) Forecast, by Application 2020 & 2033
- Table 26: Nordics Enterprise Augmented Reality Platform Revenue (million) Forecast, by Application 2020 & 2033
- Table 27: Rest of Europe Enterprise Augmented Reality Platform Revenue (million) Forecast, by Application 2020 & 2033
- Table 28: Global Enterprise Augmented Reality Platform Revenue million Forecast, by Application 2020 & 2033
- Table 29: Global Enterprise Augmented Reality Platform Revenue million Forecast, by Type 2020 & 2033
- Table 30: Global Enterprise Augmented Reality Platform Revenue million Forecast, by Country 2020 & 2033
- Table 31: Turkey Enterprise Augmented Reality Platform Revenue (million) Forecast, by Application 2020 & 2033
- Table 32: Israel Enterprise Augmented Reality Platform Revenue (million) Forecast, by Application 2020 & 2033
- Table 33: GCC Enterprise Augmented Reality Platform Revenue (million) Forecast, by Application 2020 & 2033
- Table 34: North Africa Enterprise Augmented Reality Platform Revenue (million) Forecast, by Application 2020 & 2033
- Table 35: South Africa Enterprise Augmented Reality Platform Revenue (million) Forecast, by Application 2020 & 2033
- Table 36: Rest of Middle East & Africa Enterprise Augmented Reality Platform Revenue (million) Forecast, by Application 2020 & 2033
- Table 37: Global Enterprise Augmented Reality Platform Revenue million Forecast, by Application 2020 & 2033
- Table 38: Global Enterprise Augmented Reality Platform Revenue million Forecast, by Type 2020 & 2033
- Table 39: Global Enterprise Augmented Reality Platform Revenue million Forecast, by Country 2020 & 2033
- Table 40: China Enterprise Augmented Reality Platform Revenue (million) Forecast, by Application 2020 & 2033
- Table 41: India Enterprise Augmented Reality Platform Revenue (million) Forecast, by Application 2020 & 2033
- Table 42: Japan Enterprise Augmented Reality Platform Revenue (million) Forecast, by Application 2020 & 2033
- Table 43: South Korea Enterprise Augmented Reality Platform Revenue (million) Forecast, by Application 2020 & 2033
- Table 44: ASEAN Enterprise Augmented Reality Platform Revenue (million) Forecast, by Application 2020 & 2033
- Table 45: Oceania Enterprise Augmented Reality Platform Revenue (million) Forecast, by Application 2020 & 2033
- Table 46: Rest of Asia Pacific Enterprise Augmented Reality Platform Revenue (million) Forecast, by Application 2020 & 2033
Frequently Asked Questions
1. What is the projected Compound Annual Growth Rate (CAGR) of the Enterprise Augmented Reality Platform?
The projected CAGR is approximately 28.3%.
2. Which companies are prominent players in the Enterprise Augmented Reality Platform?
Key companies in the market include AMA, Atheer, CareAR, Librestream, OverIT, PTC, RE'FLEKT, ScopeAR, Taqtile, TeamViewer.
3. What are the main segments of the Enterprise Augmented Reality Platform?
The market segments include Application, Type.
4. Can you provide details about the market size?
The market size is estimated to be USD 5167.2 million as of 2022.
5. What are some drivers contributing to market growth?
N/A
6. What are the notable trends driving market growth?
N/A
7. Are there any restraints impacting market growth?
N/A
8. Can you provide examples of recent developments in the market?
N/A
9. What pricing options are available for accessing the report?
Pricing options include single-user, multi-user, and enterprise licenses priced at USD 3950.00, USD 5925.00, and USD 7900.00 respectively.
10. Is the market size provided in terms of value or volume?
The market size is provided in terms of value, measured in million.
11. Are there any specific market keywords associated with the report?
Yes, the market keyword associated with the report is "Enterprise Augmented Reality Platform," which aids in identifying and referencing the specific market segment covered.
12. How do I determine which pricing option suits my needs best?
The pricing options vary based on user requirements and access needs. Individual users may opt for single-user licenses, while businesses requiring broader access may choose multi-user or enterprise licenses for cost-effective access to the report.
13. Are there any additional resources or data provided in the Enterprise Augmented Reality Platform report?
While the report offers comprehensive insights, it's advisable to review the specific contents or supplementary materials provided to ascertain if additional resources or data are available.
14. How can I stay updated on further developments or reports in the Enterprise Augmented Reality Platform?
To stay informed about further developments, trends, and reports in the Enterprise Augmented Reality Platform, consider subscribing to industry newsletters, following relevant companies and organizations, or regularly checking reputable industry news sources and publications.
Methodology
Step 1 - Identification of Relevant Samples Size from Population Database


Step 2 - Approaches for Defining Global Market Size (Value, Volume* & Price*)

Note*: In applicable scenarios
Step 3 - Data Sources
Primary Research
- Web Analytics
- Survey Reports
- Research Institute
- Latest Research Reports
- Opinion Leaders
Secondary Research
- Annual Reports
- White Paper
- Latest Press Release
- Industry Association
- Paid Database
- Investor Presentations

Step 4 - Data Triangulation
Involves using different sources of information in order to increase the validity of a study
These sources are likely to be stakeholders in a program - participants, other researchers, program staff, other community members, and so on.
Then we put all data in single framework & apply various statistical tools to find out the dynamic on the market.
During the analysis stage, feedback from the stakeholder groups would be compared to determine areas of agreement as well as areas of divergence