

Key Insights
The Event Stream Processing (ESP) market is experiencing robust growth, driven by the increasing need for real-time insights from high-velocity data streams across diverse industries. The market's Compound Annual Growth Rate (CAGR) of 15.70% from 2019-2024 indicates a significant expansion, projected to continue into the forecast period (2025-2033). Key drivers include the rising adoption of cloud-based solutions, the proliferation of IoT devices generating massive data volumes, and the growing demand for advanced analytics in areas like fraud detection, algorithmic trading, and predictive maintenance. The software and platform segment within the solutions category is expected to dominate, fueled by the increasing availability of sophisticated ESP platforms offering scalability and ease of integration. Furthermore, the BFSI (Banking, Financial Services, and Insurance) and IT & Telecommunications sectors are major end-user verticals, demonstrating significant investment in ESP technologies to enhance operational efficiency, improve customer experience, and gain a competitive edge. The market's growth is, however, somewhat restrained by factors such as the complexity of implementing ESP systems, the need for specialized skills, and concerns regarding data security and privacy.
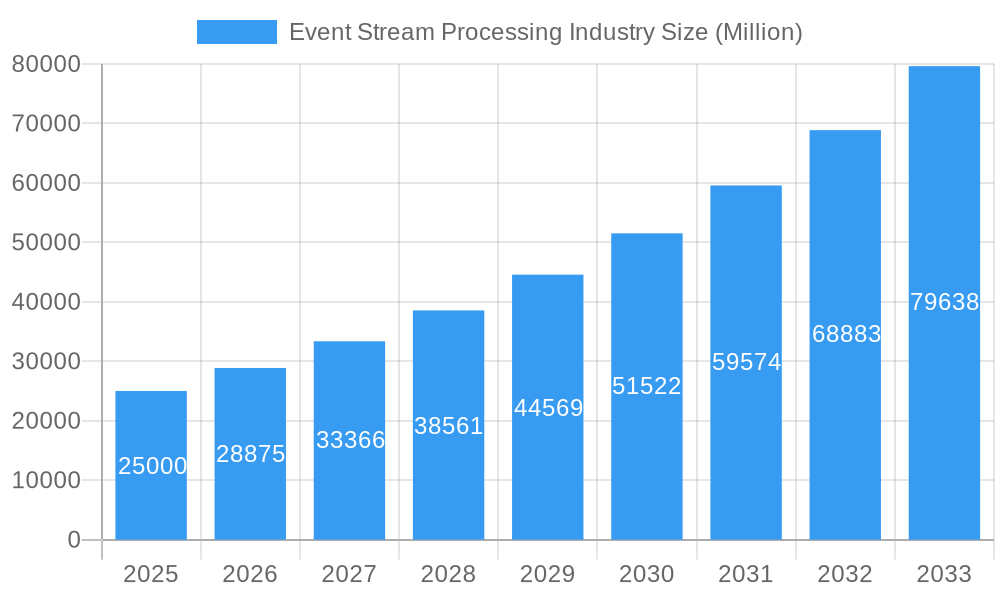
Event Stream Processing Industry Market Size (In Billion)
The geographic distribution of the ESP market reveals strong growth across North America and Europe, driven by early adoption and mature technological infrastructure. However, the Asia-Pacific region shows promising potential for future expansion, given the rapid digitalization and increasing investment in technological advancements across countries like China, India, and Japan. The cloud deployment model is witnessing a surge in popularity, owing to its scalability, cost-effectiveness, and accessibility. While on-premise deployments still hold a significant market share, the trend is clearly shifting towards cloud-based ESP solutions. Competition is fierce amongst established players like IBM, Microsoft, and SAP, as well as emerging technology providers. This competitive landscape fosters innovation and drives further adoption of ESP technologies across various industries. The continued focus on developing advanced analytical capabilities, enhancing data security, and simplifying implementation will be pivotal in shaping the future trajectory of the ESP market.
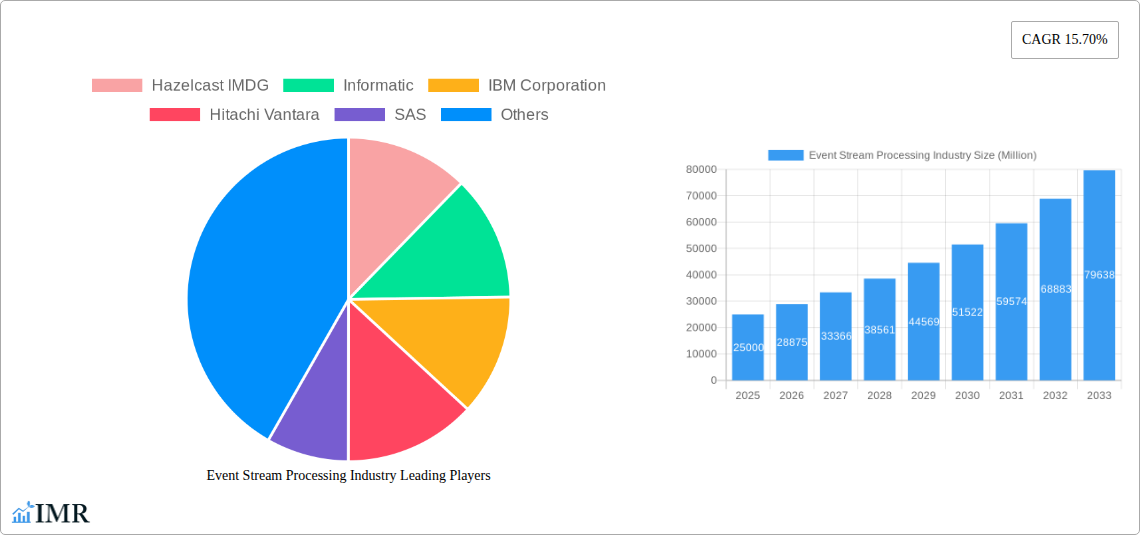
Event Stream Processing Industry Company Market Share
Event Stream Processing Industry Market Report: 2019-2033
This comprehensive report provides a detailed analysis of the Event Stream Processing (ESP) industry, encompassing market dynamics, growth trends, regional segmentation, product landscape, and key player analysis. The report covers the period from 2019 to 2033, with a focus on the forecast period of 2025-2033 and a base year of 2025. The ESP market is segmented by component (Solutions (Software & Platforms), Services), application (Fraud Detection, Algorithmic Trading, Process Monitoring, Predictive Maintenance, Sales and Marketing), end-user vertical (IT & Telecommunications, BFSI, Manufacturing, Retail & E-commerce, Energy & Utilities, Other End-user Verticals), and deployment type (Cloud, On-premise). This report is crucial for businesses, investors, and industry professionals seeking to understand and capitalize on the rapidly evolving ESP landscape.
Event Stream Processing Industry Market Dynamics & Structure
The Event Stream Processing market, valued at xx Million in 2024, is characterized by moderate concentration with several key players holding significant market share. Technological innovation, driven by advancements in cloud computing, big data analytics, and artificial intelligence (AI), is a primary growth driver. Regulatory frameworks concerning data privacy and security significantly impact market dynamics. The market faces competition from traditional data processing methods, but the increasing need for real-time insights fuels ESP adoption. End-user demographics show strong demand from IT & Telecommunications and BFSI sectors, while the manufacturing and retail sectors are rapidly adopting ESP solutions. Mergers and acquisitions (M&A) activity is moderate, with strategic partnerships playing a crucial role in market expansion.
- Market Concentration: Moderately concentrated, with top 5 players holding approximately xx% market share in 2024.
- Technological Innovation: Significant advancements in cloud-native platforms, serverless architectures, and AI-powered analytics drive innovation.
- Regulatory Frameworks: GDPR, CCPA, and other data privacy regulations influence product development and deployment strategies.
- Competitive Product Substitutes: Traditional batch processing systems and data warehousing solutions present competition.
- End-User Demographics: IT & Telecommunications and BFSI sectors represent the largest market segments, followed by the rapidly growing retail and manufacturing sectors.
- M&A Trends: Moderate M&A activity observed, primarily focused on expanding technological capabilities and market reach. xx M&A deals recorded in 2024.
Event Stream Processing Industry Growth Trends & Insights
The Event Stream Processing market exhibits strong growth potential, driven by the exponential increase in data volume and the demand for real-time insights across various industries. The market size is projected to reach xx Million by 2033, registering a Compound Annual Growth Rate (CAGR) of xx% during the forecast period (2025-2033). This growth is fueled by the rising adoption of cloud-based ESP solutions, the increasing penetration of IoT devices generating massive volumes of streaming data, and the growing need for real-time analytics in diverse sectors. Technological disruptions, such as the emergence of serverless computing and edge computing, further accelerate market expansion. Consumer behavior shifts toward personalized experiences and real-time interactions are driving demand for ESP solutions. Market penetration in key sectors like BFSI and IT & Telecommunications is expected to increase significantly over the forecast period.
Dominant Regions, Countries, or Segments in Event Stream Processing Industry
North America currently dominates the Event Stream Processing market, driven by high technological adoption, robust IT infrastructure, and the presence of major ESP vendors. Within North America, the United States holds the largest market share. Europe is another key region exhibiting strong growth, fueled by increasing digitalization and stringent data privacy regulations driving demand for secure and compliant ESP solutions. Asia-Pacific is expected to witness significant growth, driven by burgeoning economies and increasing adoption of cloud-based technologies. The Software & Platforms segment leads the component market, while Fraud Detection and Algorithmic Trading are prominent application segments driving market growth. The Cloud deployment type dominates due to scalability and cost efficiency.
Key Drivers:
- North America: High technological adoption, strong IT infrastructure, presence of major vendors.
- Europe: Increasing digitalization, stringent data privacy regulations.
- Asia-Pacific: Burgeoning economies, increasing cloud adoption.
- Software & Platforms: High demand for feature-rich and scalable solutions.
- Fraud Detection & Algorithmic Trading: High ROI and critical need for real-time analysis.
- Cloud Deployment: Scalability, cost-effectiveness, and ease of implementation.
Dominance Factors: High technological maturity, strong regulatory support, and substantial investments in IT infrastructure contribute to regional dominance.
Event Stream Processing Industry Product Landscape
The Event Stream Processing market offers a wide range of solutions, including real-time data ingestion platforms, stream processing engines, and analytics tools. Product innovation focuses on improving scalability, performance, and ease of use. Many solutions integrate AI and machine learning capabilities for advanced analytics. Unique selling propositions include low-latency processing, high throughput, and seamless integration with existing IT infrastructure. Technological advancements like serverless computing and edge processing are transforming the product landscape, leading to improved efficiency and cost-effectiveness.
Key Drivers, Barriers & Challenges in Event Stream Processing Industry
Key Drivers: The burgeoning amount of real-time data generated by IoT devices, the need for real-time insights across industries, and the rise of cloud-native platforms are key drivers. Government initiatives promoting digital transformation also fuel market growth.
Key Challenges: Integration complexities with existing systems, the skill gap in managing and utilizing ESP solutions, and concerns over data security and privacy pose significant challenges. Competition from established players also restricts market expansion. Supply chain disruptions related to hardware components can also impact the market.
Emerging Opportunities in Event Stream Processing Industry
Untapped markets in developing economies, the increasing adoption of ESP in new applications such as autonomous vehicles and smart cities, and evolving consumer preferences for personalized and real-time services present significant growth opportunities. The integration of ESP with blockchain technology for secure data processing offers a niche opportunity.
Growth Accelerators in the Event Stream Processing Industry Industry
Technological breakthroughs in areas such as AI and machine learning, strategic partnerships between ESP vendors and cloud providers, and expansion into new verticals like healthcare and transportation are major catalysts driving long-term growth. Government regulations mandating real-time data processing further accelerate market expansion.
Key Players Shaping the Event Stream Processing Industry Market
Notable Milestones in Event Stream Processing Industry Sector
- October 2022: Microsoft released the Azure Stream Analytics no-code editor, simplifying stream processing job design.
- August 2022: DataStax and Decodable partnered to offer streamlined real-time application development using Apache Cassandra, Pulsar, and Flink.
In-Depth Event Stream Processing Industry Market Outlook
The Event Stream Processing market is poised for robust growth, driven by ongoing technological advancements and increasing demand for real-time data insights across various sectors. Strategic partnerships, expansion into new markets, and the development of innovative applications will shape future market dynamics. The market holds significant potential for companies that can offer scalable, secure, and user-friendly solutions that address the evolving needs of businesses.
Event Stream Processing Industry Segmentation
-
1. Deployment Type
- 1.1. Cloud
- 1.2. On-premise
-
2. Component
- 2.1. Solutions (Software & Platforms)
- 2.2. Services
-
3. Application**
- 3.1. Fraud Detection
- 3.2. Algorithmic Trading
- 3.3. Process Monitoring
- 3.4. Predictive Maintenance
- 3.5. Sales and Marketing
-
4. End-user Vertical
- 4.1. IT & Telecommunications
- 4.2. BFSI
- 4.3. Manufacturing
- 4.4. Retail & E-commerce
- 4.5. Energy & Utilities
- 4.6. Other End-user Verticals
Event Stream Processing Industry Segmentation By Geography
- 1. North America
- 2. Europe
- 3. Asia Pacific
- 4. Latin America
- 5. Middle East and Africa
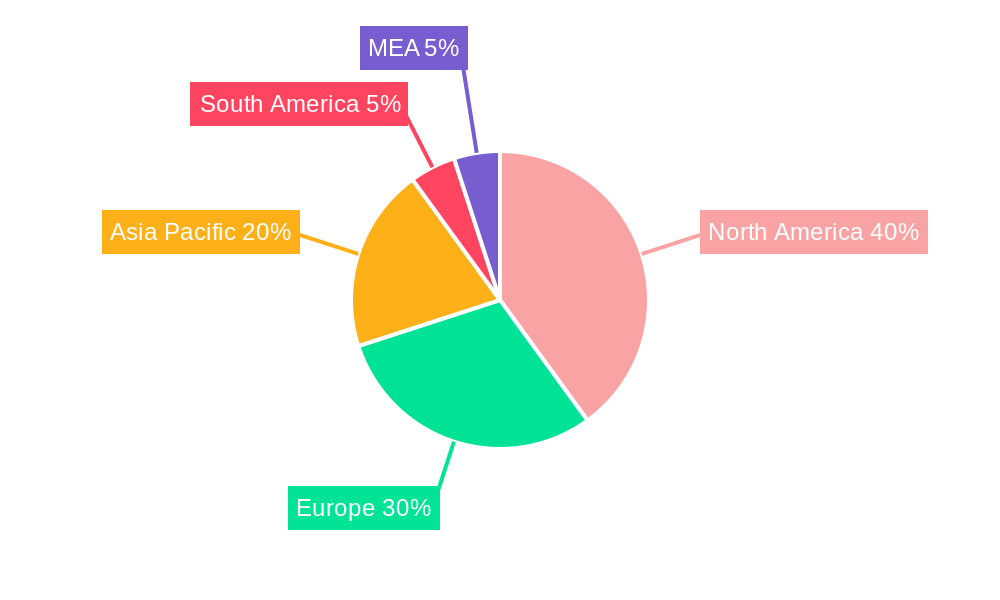
Event Stream Processing Industry Regional Market Share
Geographic Coverage of Event Stream Processing Industry
Event Stream Processing Industry REPORT HIGHLIGHTS
| Aspects | Details |
|---|---|
| Study Period | 2020-2034 |
| Base Year | 2025 |
| Estimated Year | 2026 |
| Forecast Period | 2026-2034 |
| Historical Period | 2020-2025 |
| Growth Rate | CAGR of 15.91% from 2020-2034 |
| Segmentation |
|
Table of Contents
- 1. Introduction
- 1.1. Research Scope
- 1.2. Market Segmentation
- 1.3. Research Objective
- 1.4. Definitions and Assumptions
- 2. Executive Summary
- 2.1. Market Snapshot
- 3. Market Dynamics
- 3.1. Market Drivers
- 3.2. Market Restrains
- 3.3. Market Trends
- 3.4. Market Opportunities
- 4. Market Factor Analysis
- 4.1. Porters Five Forces
- 4.1.1. Bargaining Power of Suppliers
- 4.1.2. Bargaining Power of Buyers
- 4.1.3. Threat of New Entrants
- 4.1.4. Threat of Substitutes
- 4.1.5. Competitive Rivalry
- 4.2. PESTEL analysis
- 4.3. BCG Analysis
- 4.3.1. Stars (High Growth, High Market Share)
- 4.3.2. Cash Cows (Low Growth, High Market Share)
- 4.3.3. Question Mark (High Growth, Low Market Share)
- 4.3.4. Dogs (Low Growth, Low Market Share)
- 4.4. Ansoff Matrix Analysis
- 4.5. Supply Chain Analysis
- 4.6. Regulatory Landscape
- 4.7. Current Market Potential and Opportunity Assessment (TAM–SAM–SOM Framework)
- 4.8. IMR Analyst Note
- 4.1. Porters Five Forces
- 5. Market Analysis, Insights and Forecast 2021-2033
- 5.1. Market Analysis, Insights and Forecast - by Deployment Type
- 5.1.1. Cloud
- 5.1.2. On-premise
- 5.2. Market Analysis, Insights and Forecast - by Component
- 5.2.1. Solutions (Software & Platforms)
- 5.2.2. Services
- 5.3. Market Analysis, Insights and Forecast - by Application**
- 5.3.1. Fraud Detection
- 5.3.2. Algorithmic Trading
- 5.3.3. Process Monitoring
- 5.3.4. Predictive Maintenance
- 5.3.5. Sales and Marketing
- 5.4. Market Analysis, Insights and Forecast - by End-user Vertical
- 5.4.1. IT & Telecommunications
- 5.4.2. BFSI
- 5.4.3. Manufacturing
- 5.4.4. Retail & E-commerce
- 5.4.5. Energy & Utilities
- 5.4.6. Other End-user Verticals
- 5.5. Market Analysis, Insights and Forecast - by Region
- 5.5.1. North America
- 5.5.2. Europe
- 5.5.3. Asia Pacific
- 5.5.4. Latin America
- 5.5.5. Middle East and Africa
- 5.1. Market Analysis, Insights and Forecast - by Deployment Type
- 6. Global Event Stream Processing Industry Analysis, Insights and Forecast, 2021-2033
- 6.1. Market Analysis, Insights and Forecast - by Deployment Type
- 6.1.1. Cloud
- 6.1.2. On-premise
- 6.2. Market Analysis, Insights and Forecast - by Component
- 6.2.1. Solutions (Software & Platforms)
- 6.2.2. Services
- 6.3. Market Analysis, Insights and Forecast - by Application**
- 6.3.1. Fraud Detection
- 6.3.2. Algorithmic Trading
- 6.3.3. Process Monitoring
- 6.3.4. Predictive Maintenance
- 6.3.5. Sales and Marketing
- 6.4. Market Analysis, Insights and Forecast - by End-user Vertical
- 6.4.1. IT & Telecommunications
- 6.4.2. BFSI
- 6.4.3. Manufacturing
- 6.4.4. Retail & E-commerce
- 6.4.5. Energy & Utilities
- 6.4.6. Other End-user Verticals
- 6.1. Market Analysis, Insights and Forecast - by Deployment Type
- 7. North America Event Stream Processing Industry Analysis, Insights and Forecast, 2020-2032
- 7.1. Market Analysis, Insights and Forecast - by Deployment Type
- 7.1.1. Cloud
- 7.1.2. On-premise
- 7.2. Market Analysis, Insights and Forecast - by Component
- 7.2.1. Solutions (Software & Platforms)
- 7.2.2. Services
- 7.3. Market Analysis, Insights and Forecast - by Application**
- 7.3.1. Fraud Detection
- 7.3.2. Algorithmic Trading
- 7.3.3. Process Monitoring
- 7.3.4. Predictive Maintenance
- 7.3.5. Sales and Marketing
- 7.4. Market Analysis, Insights and Forecast - by End-user Vertical
- 7.4.1. IT & Telecommunications
- 7.4.2. BFSI
- 7.4.3. Manufacturing
- 7.4.4. Retail & E-commerce
- 7.4.5. Energy & Utilities
- 7.4.6. Other End-user Verticals
- 7.1. Market Analysis, Insights and Forecast - by Deployment Type
- 8. Europe Event Stream Processing Industry Analysis, Insights and Forecast, 2020-2032
- 8.1. Market Analysis, Insights and Forecast - by Deployment Type
- 8.1.1. Cloud
- 8.1.2. On-premise
- 8.2. Market Analysis, Insights and Forecast - by Component
- 8.2.1. Solutions (Software & Platforms)
- 8.2.2. Services
- 8.3. Market Analysis, Insights and Forecast - by Application**
- 8.3.1. Fraud Detection
- 8.3.2. Algorithmic Trading
- 8.3.3. Process Monitoring
- 8.3.4. Predictive Maintenance
- 8.3.5. Sales and Marketing
- 8.4. Market Analysis, Insights and Forecast - by End-user Vertical
- 8.4.1. IT & Telecommunications
- 8.4.2. BFSI
- 8.4.3. Manufacturing
- 8.4.4. Retail & E-commerce
- 8.4.5. Energy & Utilities
- 8.4.6. Other End-user Verticals
- 8.1. Market Analysis, Insights and Forecast - by Deployment Type
- 9. Asia Pacific Event Stream Processing Industry Analysis, Insights and Forecast, 2020-2032
- 9.1. Market Analysis, Insights and Forecast - by Deployment Type
- 9.1.1. Cloud
- 9.1.2. On-premise
- 9.2. Market Analysis, Insights and Forecast - by Component
- 9.2.1. Solutions (Software & Platforms)
- 9.2.2. Services
- 9.3. Market Analysis, Insights and Forecast - by Application**
- 9.3.1. Fraud Detection
- 9.3.2. Algorithmic Trading
- 9.3.3. Process Monitoring
- 9.3.4. Predictive Maintenance
- 9.3.5. Sales and Marketing
- 9.4. Market Analysis, Insights and Forecast - by End-user Vertical
- 9.4.1. IT & Telecommunications
- 9.4.2. BFSI
- 9.4.3. Manufacturing
- 9.4.4. Retail & E-commerce
- 9.4.5. Energy & Utilities
- 9.4.6. Other End-user Verticals
- 9.1. Market Analysis, Insights and Forecast - by Deployment Type
- 10. Latin America Event Stream Processing Industry Analysis, Insights and Forecast, 2020-2032
- 10.1. Market Analysis, Insights and Forecast - by Deployment Type
- 10.1.1. Cloud
- 10.1.2. On-premise
- 10.2. Market Analysis, Insights and Forecast - by Component
- 10.2.1. Solutions (Software & Platforms)
- 10.2.2. Services
- 10.3. Market Analysis, Insights and Forecast - by Application**
- 10.3.1. Fraud Detection
- 10.3.2. Algorithmic Trading
- 10.3.3. Process Monitoring
- 10.3.4. Predictive Maintenance
- 10.3.5. Sales and Marketing
- 10.4. Market Analysis, Insights and Forecast - by End-user Vertical
- 10.4.1. IT & Telecommunications
- 10.4.2. BFSI
- 10.4.3. Manufacturing
- 10.4.4. Retail & E-commerce
- 10.4.5. Energy & Utilities
- 10.4.6. Other End-user Verticals
- 10.1. Market Analysis, Insights and Forecast - by Deployment Type
- 11. Middle East and Africa Event Stream Processing Industry Analysis, Insights and Forecast, 2020-2032
- 11.1. Market Analysis, Insights and Forecast - by Deployment Type
- 11.1.1. Cloud
- 11.1.2. On-premise
- 11.2. Market Analysis, Insights and Forecast - by Component
- 11.2.1. Solutions (Software & Platforms)
- 11.2.2. Services
- 11.3. Market Analysis, Insights and Forecast - by Application**
- 11.3.1. Fraud Detection
- 11.3.2. Algorithmic Trading
- 11.3.3. Process Monitoring
- 11.3.4. Predictive Maintenance
- 11.3.5. Sales and Marketing
- 11.4. Market Analysis, Insights and Forecast - by End-user Vertical
- 11.4.1. IT & Telecommunications
- 11.4.2. BFSI
- 11.4.3. Manufacturing
- 11.4.4. Retail & E-commerce
- 11.4.5. Energy & Utilities
- 11.4.6. Other End-user Verticals
- 11.1. Market Analysis, Insights and Forecast - by Deployment Type
- 12. Competitive Analysis
- 12.1. Company Profiles
- 12.1.1 Hazelcast IMDG
- 12.1.1.1. Company Overview
- 12.1.1.2. Products
- 12.1.1.3. Company Financials
- 12.1.1.4. SWOT Analysis
- 12.1.2 Informatic
- 12.1.2.1. Company Overview
- 12.1.2.2. Products
- 12.1.2.3. Company Financials
- 12.1.2.4. SWOT Analysis
- 12.1.3 IBM Corporation
- 12.1.3.1. Company Overview
- 12.1.3.2. Products
- 12.1.3.3. Company Financials
- 12.1.3.4. SWOT Analysis
- 12.1.4 Hitachi Vantara
- 12.1.4.1. Company Overview
- 12.1.4.2. Products
- 12.1.4.3. Company Financials
- 12.1.4.4. SWOT Analysis
- 12.1.5 SAS
- 12.1.5.1. Company Overview
- 12.1.5.2. Products
- 12.1.5.3. Company Financials
- 12.1.5.4. SWOT Analysis
- 12.1.6 Microsoft Corporation
- 12.1.6.1. Company Overview
- 12.1.6.2. Products
- 12.1.6.3. Company Financials
- 12.1.6.4. SWOT Analysis
- 12.1.7 Confluent Inc
- 12.1.7.1. Company Overview
- 12.1.7.2. Products
- 12.1.7.3. Company Financials
- 12.1.7.4. SWOT Analysis
- 12.1.8 Redhat
- 12.1.8.1. Company Overview
- 12.1.8.2. Products
- 12.1.8.3. Company Financials
- 12.1.8.4. SWOT Analysis
- 12.1.9 Amazon Web Services Inc
- 12.1.9.1. Company Overview
- 12.1.9.2. Products
- 12.1.9.3. Company Financials
- 12.1.9.4. SWOT Analysis
- 12.1.10 Oracle Corporation
- 12.1.10.1. Company Overview
- 12.1.10.2. Products
- 12.1.10.3. Company Financials
- 12.1.10.4. SWOT Analysis
- 12.1.11 Salesforce
- 12.1.11.1. Company Overview
- 12.1.11.2. Products
- 12.1.11.3. Company Financials
- 12.1.11.4. SWOT Analysis
- 12.1.12 TIBCO
- 12.1.12.1. Company Overview
- 12.1.12.2. Products
- 12.1.12.3. Company Financials
- 12.1.12.4. SWOT Analysis
- 12.1.13 Google Inc
- 12.1.13.1. Company Overview
- 12.1.13.2. Products
- 12.1.13.3. Company Financials
- 12.1.13.4. SWOT Analysis
- 12.1.14 SAP SE
- 12.1.14.1. Company Overview
- 12.1.14.2. Products
- 12.1.14.3. Company Financials
- 12.1.14.4. SWOT Analysis
- 12.1.1 Hazelcast IMDG
- 12.2. Market Entropy
- 12.2.1 Company's Key Areas Served
- 12.2.2 Recent Developments
- 12.3. Company Market Share Analysis 2025
- 12.3.1 Top 5 Companies Market Share Analysis
- 12.3.2 Top 3 Companies Market Share Analysis
- 12.4. List of Potential Customers
- 13. Research Methodology
List of Figures
- Figure 1: Global Event Stream Processing Industry Revenue Breakdown (billion, %) by Region 2025 & 2033
- Figure 2: North America Event Stream Processing Industry Revenue (billion), by Deployment Type 2025 & 2033
- Figure 3: North America Event Stream Processing Industry Revenue Share (%), by Deployment Type 2025 & 2033
- Figure 4: North America Event Stream Processing Industry Revenue (billion), by Component 2025 & 2033
- Figure 5: North America Event Stream Processing Industry Revenue Share (%), by Component 2025 & 2033
- Figure 6: North America Event Stream Processing Industry Revenue (billion), by Application** 2025 & 2033
- Figure 7: North America Event Stream Processing Industry Revenue Share (%), by Application** 2025 & 2033
- Figure 8: North America Event Stream Processing Industry Revenue (billion), by End-user Vertical 2025 & 2033
- Figure 9: North America Event Stream Processing Industry Revenue Share (%), by End-user Vertical 2025 & 2033
- Figure 10: North America Event Stream Processing Industry Revenue (billion), by Country 2025 & 2033
- Figure 11: North America Event Stream Processing Industry Revenue Share (%), by Country 2025 & 2033
- Figure 12: Europe Event Stream Processing Industry Revenue (billion), by Deployment Type 2025 & 2033
- Figure 13: Europe Event Stream Processing Industry Revenue Share (%), by Deployment Type 2025 & 2033
- Figure 14: Europe Event Stream Processing Industry Revenue (billion), by Component 2025 & 2033
- Figure 15: Europe Event Stream Processing Industry Revenue Share (%), by Component 2025 & 2033
- Figure 16: Europe Event Stream Processing Industry Revenue (billion), by Application** 2025 & 2033
- Figure 17: Europe Event Stream Processing Industry Revenue Share (%), by Application** 2025 & 2033
- Figure 18: Europe Event Stream Processing Industry Revenue (billion), by End-user Vertical 2025 & 2033
- Figure 19: Europe Event Stream Processing Industry Revenue Share (%), by End-user Vertical 2025 & 2033
- Figure 20: Europe Event Stream Processing Industry Revenue (billion), by Country 2025 & 2033
- Figure 21: Europe Event Stream Processing Industry Revenue Share (%), by Country 2025 & 2033
- Figure 22: Asia Pacific Event Stream Processing Industry Revenue (billion), by Deployment Type 2025 & 2033
- Figure 23: Asia Pacific Event Stream Processing Industry Revenue Share (%), by Deployment Type 2025 & 2033
- Figure 24: Asia Pacific Event Stream Processing Industry Revenue (billion), by Component 2025 & 2033
- Figure 25: Asia Pacific Event Stream Processing Industry Revenue Share (%), by Component 2025 & 2033
- Figure 26: Asia Pacific Event Stream Processing Industry Revenue (billion), by Application** 2025 & 2033
- Figure 27: Asia Pacific Event Stream Processing Industry Revenue Share (%), by Application** 2025 & 2033
- Figure 28: Asia Pacific Event Stream Processing Industry Revenue (billion), by End-user Vertical 2025 & 2033
- Figure 29: Asia Pacific Event Stream Processing Industry Revenue Share (%), by End-user Vertical 2025 & 2033
- Figure 30: Asia Pacific Event Stream Processing Industry Revenue (billion), by Country 2025 & 2033
- Figure 31: Asia Pacific Event Stream Processing Industry Revenue Share (%), by Country 2025 & 2033
- Figure 32: Latin America Event Stream Processing Industry Revenue (billion), by Deployment Type 2025 & 2033
- Figure 33: Latin America Event Stream Processing Industry Revenue Share (%), by Deployment Type 2025 & 2033
- Figure 34: Latin America Event Stream Processing Industry Revenue (billion), by Component 2025 & 2033
- Figure 35: Latin America Event Stream Processing Industry Revenue Share (%), by Component 2025 & 2033
- Figure 36: Latin America Event Stream Processing Industry Revenue (billion), by Application** 2025 & 2033
- Figure 37: Latin America Event Stream Processing Industry Revenue Share (%), by Application** 2025 & 2033
- Figure 38: Latin America Event Stream Processing Industry Revenue (billion), by End-user Vertical 2025 & 2033
- Figure 39: Latin America Event Stream Processing Industry Revenue Share (%), by End-user Vertical 2025 & 2033
- Figure 40: Latin America Event Stream Processing Industry Revenue (billion), by Country 2025 & 2033
- Figure 41: Latin America Event Stream Processing Industry Revenue Share (%), by Country 2025 & 2033
- Figure 42: Middle East and Africa Event Stream Processing Industry Revenue (billion), by Deployment Type 2025 & 2033
- Figure 43: Middle East and Africa Event Stream Processing Industry Revenue Share (%), by Deployment Type 2025 & 2033
- Figure 44: Middle East and Africa Event Stream Processing Industry Revenue (billion), by Component 2025 & 2033
- Figure 45: Middle East and Africa Event Stream Processing Industry Revenue Share (%), by Component 2025 & 2033
- Figure 46: Middle East and Africa Event Stream Processing Industry Revenue (billion), by Application** 2025 & 2033
- Figure 47: Middle East and Africa Event Stream Processing Industry Revenue Share (%), by Application** 2025 & 2033
- Figure 48: Middle East and Africa Event Stream Processing Industry Revenue (billion), by End-user Vertical 2025 & 2033
- Figure 49: Middle East and Africa Event Stream Processing Industry Revenue Share (%), by End-user Vertical 2025 & 2033
- Figure 50: Middle East and Africa Event Stream Processing Industry Revenue (billion), by Country 2025 & 2033
- Figure 51: Middle East and Africa Event Stream Processing Industry Revenue Share (%), by Country 2025 & 2033
List of Tables
- Table 1: Global Event Stream Processing Industry Revenue billion Forecast, by Deployment Type 2020 & 2033
- Table 2: Global Event Stream Processing Industry Revenue billion Forecast, by Component 2020 & 2033
- Table 3: Global Event Stream Processing Industry Revenue billion Forecast, by Application** 2020 & 2033
- Table 4: Global Event Stream Processing Industry Revenue billion Forecast, by End-user Vertical 2020 & 2033
- Table 5: Global Event Stream Processing Industry Revenue billion Forecast, by Region 2020 & 2033
- Table 6: Global Event Stream Processing Industry Revenue billion Forecast, by Deployment Type 2020 & 2033
- Table 7: Global Event Stream Processing Industry Revenue billion Forecast, by Component 2020 & 2033
- Table 8: Global Event Stream Processing Industry Revenue billion Forecast, by Application** 2020 & 2033
- Table 9: Global Event Stream Processing Industry Revenue billion Forecast, by End-user Vertical 2020 & 2033
- Table 10: Global Event Stream Processing Industry Revenue billion Forecast, by Country 2020 & 2033
- Table 11: Global Event Stream Processing Industry Revenue billion Forecast, by Deployment Type 2020 & 2033
- Table 12: Global Event Stream Processing Industry Revenue billion Forecast, by Component 2020 & 2033
- Table 13: Global Event Stream Processing Industry Revenue billion Forecast, by Application** 2020 & 2033
- Table 14: Global Event Stream Processing Industry Revenue billion Forecast, by End-user Vertical 2020 & 2033
- Table 15: Global Event Stream Processing Industry Revenue billion Forecast, by Country 2020 & 2033
- Table 16: Global Event Stream Processing Industry Revenue billion Forecast, by Deployment Type 2020 & 2033
- Table 17: Global Event Stream Processing Industry Revenue billion Forecast, by Component 2020 & 2033
- Table 18: Global Event Stream Processing Industry Revenue billion Forecast, by Application** 2020 & 2033
- Table 19: Global Event Stream Processing Industry Revenue billion Forecast, by End-user Vertical 2020 & 2033
- Table 20: Global Event Stream Processing Industry Revenue billion Forecast, by Country 2020 & 2033
- Table 21: Global Event Stream Processing Industry Revenue billion Forecast, by Deployment Type 2020 & 2033
- Table 22: Global Event Stream Processing Industry Revenue billion Forecast, by Component 2020 & 2033
- Table 23: Global Event Stream Processing Industry Revenue billion Forecast, by Application** 2020 & 2033
- Table 24: Global Event Stream Processing Industry Revenue billion Forecast, by End-user Vertical 2020 & 2033
- Table 25: Global Event Stream Processing Industry Revenue billion Forecast, by Country 2020 & 2033
- Table 26: Global Event Stream Processing Industry Revenue billion Forecast, by Deployment Type 2020 & 2033
- Table 27: Global Event Stream Processing Industry Revenue billion Forecast, by Component 2020 & 2033
- Table 28: Global Event Stream Processing Industry Revenue billion Forecast, by Application** 2020 & 2033
- Table 29: Global Event Stream Processing Industry Revenue billion Forecast, by End-user Vertical 2020 & 2033
- Table 30: Global Event Stream Processing Industry Revenue billion Forecast, by Country 2020 & 2033
Frequently Asked Questions
1. What is the projected Compound Annual Growth Rate (CAGR) of the Event Stream Processing Industry?
The projected CAGR is approximately 15.91%.
2. Which companies are prominent players in the Event Stream Processing Industry?
Key companies in the market include Hazelcast IMDG, Informatic, IBM Corporation, Hitachi Vantara, SAS, Microsoft Corporation, Confluent Inc, Redhat, Amazon Web Services Inc, Oracle Corporation, Salesforce, TIBCO, Google Inc, SAP SE.
3. What are the main segments of the Event Stream Processing Industry?
The market segments include Deployment Type, Component, Application**, End-user Vertical.
4. Can you provide details about the market size?
The market size is estimated to be USD 1.12 billion as of 2022.
5. What are some drivers contributing to market growth?
Increasing Adoption of the Internet of Things (IoT) and Smart Devices; Increasing Need to Analyze Large Volumes of Data From Diverse Sources.
6. What are the notable trends driving market growth?
Increasing Adoption of the Internet of Things (IoT) and Smart Devices.
7. Are there any restraints impacting market growth?
Concerns Associated with Data Security and Privacy.
8. Can you provide examples of recent developments in the market?
October 2022: Microsoft has released the Azure Stream Analytics no-code editor, a drag-and-drop canvas for designing jobs for stream processing scenarios such as streaming ETL, ingestion, and data materialization, to general availability. The no-code editor is hosted by Azure Event Hubs, the company's big-data streaming platform and event ingestion service. Azure Stream Analytics is a service for managed real-time analytics. Its no-code editor allows users to develop a Stream Analytics job without writing a single line of code.
9. What pricing options are available for accessing the report?
Pricing options include single-user, multi-user, and enterprise licenses priced at USD 4750, USD 5250, and USD 8750 respectively.
10. Is the market size provided in terms of value or volume?
The market size is provided in terms of value, measured in billion.
11. Are there any specific market keywords associated with the report?
Yes, the market keyword associated with the report is "Event Stream Processing Industry," which aids in identifying and referencing the specific market segment covered.
12. How do I determine which pricing option suits my needs best?
The pricing options vary based on user requirements and access needs. Individual users may opt for single-user licenses, while businesses requiring broader access may choose multi-user or enterprise licenses for cost-effective access to the report.
13. Are there any additional resources or data provided in the Event Stream Processing Industry report?
While the report offers comprehensive insights, it's advisable to review the specific contents or supplementary materials provided to ascertain if additional resources or data are available.
14. How can I stay updated on further developments or reports in the Event Stream Processing Industry?
To stay informed about further developments, trends, and reports in the Event Stream Processing Industry, consider subscribing to industry newsletters, following relevant companies and organizations, or regularly checking reputable industry news sources and publications.
Methodology
Step 1 - Identification of Relevant Samples Size from Population Database


Step 2 - Approaches for Defining Global Market Size (Value, Volume* & Price*)

Note*: In applicable scenarios
Step 3 - Data Sources
Primary Research
- Web Analytics
- Survey Reports
- Research Institute
- Latest Research Reports
- Opinion Leaders
Secondary Research
- Annual Reports
- White Paper
- Latest Press Release
- Industry Association
- Paid Database
- Investor Presentations

Step 4 - Data Triangulation
Involves using different sources of information in order to increase the validity of a study
These sources are likely to be stakeholders in a program - participants, other researchers, program staff, other community members, and so on.
Then we put all data in single framework & apply various statistical tools to find out the dynamic on the market.
During the analysis stage, feedback from the stakeholder groups would be compared to determine areas of agreement as well as areas of divergence