

Key Insights
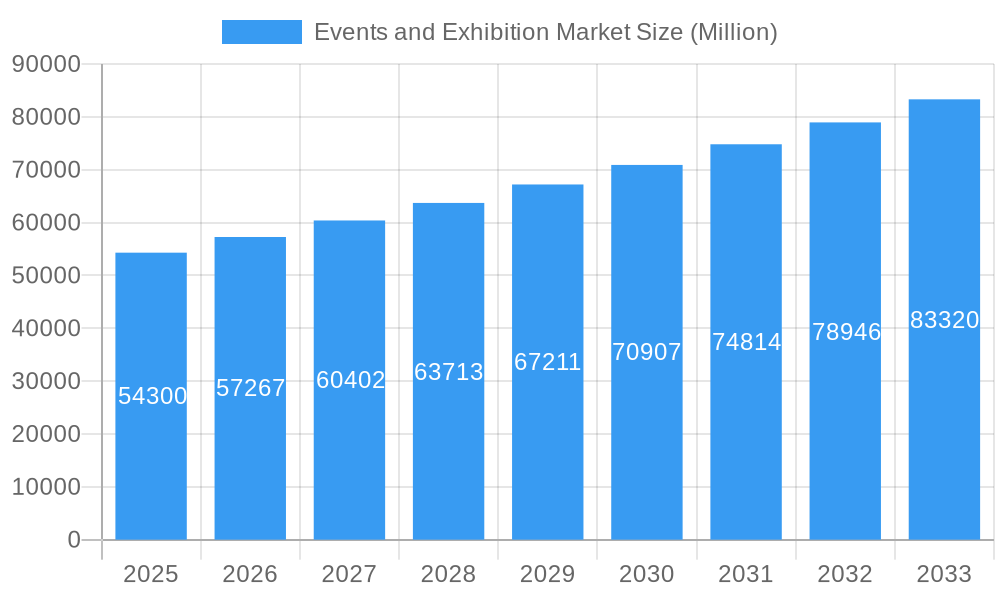
The global events and exhibition market, currently valued at $54.30 billion in 2025, is projected to experience robust growth, exhibiting a Compound Annual Growth Rate (CAGR) of 5.29% from 2025 to 2033. This expansion is fueled by several key drivers. The increasing adoption of digital technologies for event management and marketing enhances reach and engagement, attracting both exhibitors and attendees. Simultaneously, a growing preference for experiential marketing among businesses across diverse sectors, including consumer goods, automotive, and industrial manufacturing, is bolstering demand for high-quality events and exhibitions as platforms for product launches, networking, and lead generation. Furthermore, the resurgence of in-person events post-pandemic, coupled with the evolution of hybrid models incorporating virtual components, contributes significantly to market growth. While economic fluctuations and potential geopolitical uncertainties pose some constraints, the inherent value proposition of events and exhibitions as catalysts for business development and brand building ensures ongoing market expansion.
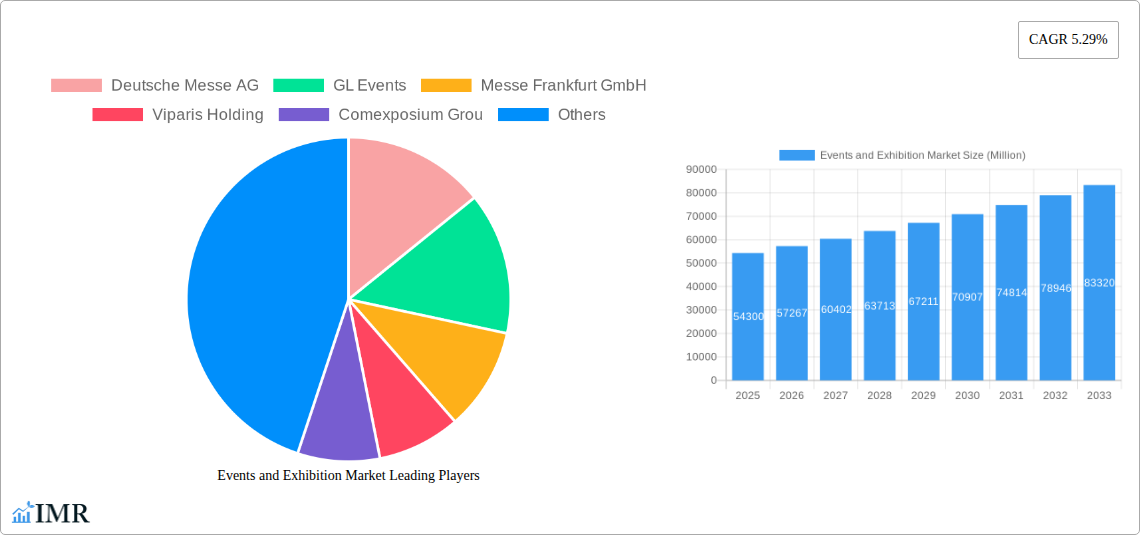
Events and Exhibition Market Market Size (In Billion)
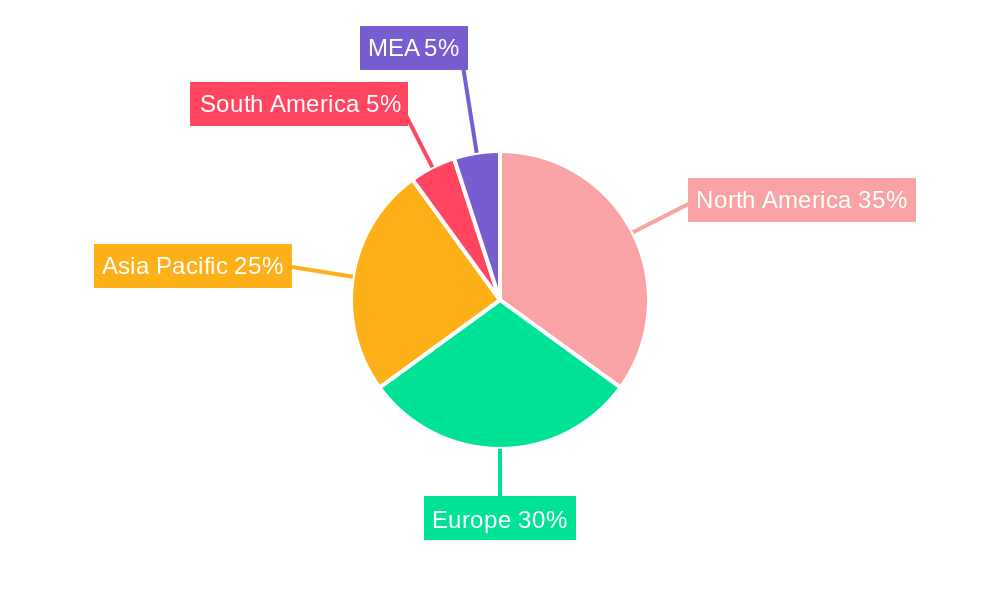
Market segmentation reveals significant opportunities within specific niches. The B2B segment currently dominates, driven by the needs of corporations for strategic networking and business development. However, the B2C segment is also experiencing substantial growth, reflecting the rising consumer appetite for engaging experiences and entertainment. Revenue streams are diversified, with exhibitor fees, sponsorship packages, and entrance fees constituting major revenue components. Service offerings, including event planning, logistics, and technology solutions, further enhance the market's value proposition. Geographically, North America and Europe are currently the largest markets, but the Asia-Pacific region is anticipated to witness the most significant growth in the coming years, fueled by rapid economic development and increasing disposable incomes. Key players like Deutsche Messe AG, GL Events, and Messe Frankfurt GmbH are driving innovation and market consolidation through strategic acquisitions and technological advancements. The forecast indicates a substantial market expansion in the coming years, making it an attractive investment and growth opportunity.
Events and Exhibition Market Company Market Share
Events and Exhibition Market: A Comprehensive Report (2019-2033)
This in-depth report provides a comprehensive analysis of the global Events and Exhibition Market, encompassing market dynamics, growth trends, regional segmentation, key players, and future outlook. The study period covers 2019-2033, with 2025 as the base year and a forecast period extending to 2033. This report is invaluable for industry professionals, investors, and strategic decision-makers seeking a clear understanding of this dynamic market. The market size is projected to reach xx Million by 2033.
Events and Exhibition Market Market Dynamics & Structure
The Events and Exhibition Market is a highly competitive landscape characterized by both large multinational corporations and specialized event organizers. Market concentration is moderate, with a few key players holding significant market share, while numerous smaller players cater to niche segments. Technological innovation is a crucial driver, with digital platforms and virtual event solutions transforming how events are planned, executed, and experienced. Regulatory frameworks, varying across regions, significantly impact operational costs and event planning. Competitive substitutes, such as online webinars and virtual conferences, exert pressure on traditional event formats. End-user demographics are diversifying, with increased participation from younger generations and professionals across various sectors. The recent period has seen a noticeable uptick in mergers and acquisitions (M&A) activity, indicative of consolidation and expansion within the industry.
- Market Concentration: Moderate, with top 10 players holding approximately 60% market share (2024).
- Technological Innovation: Rapid adoption of virtual and hybrid event technologies, driven by advancements in streaming, VR/AR, and data analytics.
- Regulatory Framework: Compliance with safety, accessibility, and data privacy regulations varies across regions, creating challenges for event organizers.
- Competitive Substitutes: The rise of online alternatives poses a threat to traditional in-person events.
- End-User Demographics: Growing participation from millennial and Gen Z professionals, increasing demand for personalized and interactive experiences.
- M&A Activity: An estimated xx M&A deals in the past 5 years, with a significant increase in 2023.
Events and Exhibition Market Growth Trends & Insights
The global Events and Exhibition Market experienced significant growth during the historical period (2019-2024), albeit with a temporary setback due to the pandemic. Post-pandemic recovery has been robust, with a resurgence in both physical and hybrid events. Market size is projected to exhibit a CAGR of xx% during the forecast period (2025-2033), driven by increasing corporate budgets for marketing and employee engagement, growing demand for experiential marketing, and technological advancements enabling more immersive and interactive event experiences. Market penetration of hybrid and virtual event solutions is steadily rising, driven by cost-effectiveness and broader accessibility. Consumer behavior shifts towards personalized experiences and sustainable practices are also shaping market trends. The B2B segment is anticipated to retain its dominance due to the increasing importance of networking and relationship building in professional environments.
Dominant Regions, Countries, or Segments in Events and Exhibition Market
North America and Europe currently dominate the Events and Exhibition Market, accounting for approximately 65% of the global revenue in 2024. However, Asia-Pacific is demonstrating rapid growth potential, driven by strong economic growth and increasing urbanization in emerging markets. Within market segmentation, the B2B events segment remains the largest, owing to its significant contribution from trade shows and conferences. The Exhibitor Fee revenue stream represents the largest portion of market revenue, indicating the significant role of exhibitors in event profitability. Among end-users, the Consumer Goods and Retail Sector is leading, followed by the Industrial and Automotive sectors.
- Regional Dominance: North America and Europe (market share: 65% in 2024). Rapid growth in Asia-Pacific.
- Segment Dominance: B2B events (market share: 55% in 2024); Exhibitor Fee as largest revenue stream.
- End-User Dominance: Consumer Goods and Retail Sector followed by Industrial and Automotive Sectors.
- Key Drivers: Strong economic growth in key regions, increasing investments in marketing and events, rising disposable incomes, and technological advancements.
Events and Exhibition Market Product Landscape
The Events and Exhibition Market encompasses a diverse range of products and services, including event planning and management software, virtual event platforms, registration and ticketing systems, and on-site event technologies. Recent innovations include AI-powered event personalization tools, immersive virtual reality experiences, and sustainable event management solutions. These advancements aim to enhance attendee engagement, optimize event logistics, and minimize environmental impact. Key performance indicators include attendee engagement metrics (e.g., dwell time, social media interactions), lead generation rates, and customer satisfaction scores.
Key Drivers, Barriers & Challenges in Events and Exhibition Market
Key Drivers: Rising disposable incomes, increasing corporate event budgets, growing demand for experiential marketing, technological advancements enabling interactive events, and supportive government policies in some regions.
Key Challenges: Economic downturns, competition from virtual events, high operational costs, event security concerns, and regulatory compliance complexities impacting event organization and profitability. The pandemic-induced disruption still influences recovery timelines and logistical challenges in some regions.
Emerging Opportunities in Events and Exhibition Market
Emerging opportunities lie in the growing adoption of hybrid and virtual event formats, the expansion of niche event segments (e.g., sustainability-focused events, gaming events), and the integration of advanced technologies like AI and VR/AR. Untapped markets in developing economies represent significant growth potential. Personalized event experiences and data-driven event marketing are gaining traction.
Growth Accelerators in the Events and Exhibition Market Industry
Long-term growth will be propelled by strategic partnerships between technology providers and event organizers, expanding into new geographical markets, and continued innovation in event technologies. The increasing focus on data analytics for enhancing event ROI, personalization, and marketing strategies is a strong accelerator.
Key Players Shaping the Events and Exhibition Market Market
- Deutsche Messe AG
- GL Events
- Messe Frankfurt GmbH
- Viparis Holding
- Comexposium Group
- Koelnmesse GmbH
- Messe Düsseldorf GmbH
- Percept Limited
- Fiera Milano SpA
- MCH Group AG
Notable Milestones in Events and Exhibition Market Sector
- November 2023: Art Design Chicago initiative showcases the city's artistic heritage, highlighting the growing importance of community-focused events.
- November 2023: Merger of EventWorks and Quest Events strengthens the Southeast event rental market, demonstrating consolidation trends in the industry.
In-Depth Events and Exhibition Market Market Outlook
The Events and Exhibition Market is poised for sustained growth in the coming years, driven by technological innovation, increasing demand for experiential marketing, and economic recovery in key regions. Strategic opportunities lie in leveraging data analytics for enhanced event personalization, expanding into niche segments, and developing innovative hybrid and virtual event formats. The market’s future hinges on adapting to evolving consumer preferences and embracing sustainable practices.
Events and Exhibition Market Segmentation
-
1. Type
- 1.1. B2B
- 1.2. B2C
- 1.3. Mixed/Hybrid
-
2. Revenue Stream
- 2.1. Exhibitor Fee
- 2.2. Sponsorship Fee
- 2.3. Entrance Fee
- 2.4. Services
-
3. End User
- 3.1. Consumer Goods and Retail Sector
- 3.2. Automotive and Transportation Sector
- 3.3. Industrial
- 3.4. Entertainment
- 3.5. Real Estate and Property
- 3.6. Hospitality Sector
- 3.7. Other End Users
Events and Exhibition Market Segmentation By Geography
-
1. North America
- 1.1. United States
- 1.2. Canada
-
2. Europe
- 2.1. Germany
- 2.2. United Kingdom
- 2.3. France
-
3. Asia Pacific
- 3.1. China
- 3.2. Japan
- 3.3. India
- 3.4. South Korea
- 3.5. Australia and New Zealand
- 4. Latin America
- 5. Middle East and Africa
Events and Exhibition Market Regional Market Share
Geographic Coverage of Events and Exhibition Market
Events and Exhibition Market REPORT HIGHLIGHTS
| Aspects | Details |
|---|---|
| Study Period | 2020-2034 |
| Base Year | 2025 |
| Estimated Year | 2026 |
| Forecast Period | 2026-2034 |
| Historical Period | 2020-2025 |
| Growth Rate | CAGR of 5.29% from 2020-2034 |
| Segmentation |
|
Table of Contents
- 1. Introduction
- 1.1. Research Scope
- 1.2. Market Segmentation
- 1.3. Research Objective
- 1.4. Definitions and Assumptions
- 2. Executive Summary
- 2.1. Market Snapshot
- 3. Market Dynamics
- 3.1. Market Drivers
- 3.2. Market Restrains
- 3.3. Market Trends
- 3.4. Market Opportunities
- 4. Market Factor Analysis
- 4.1. Porters Five Forces
- 4.1.1. Bargaining Power of Suppliers
- 4.1.2. Bargaining Power of Buyers
- 4.1.3. Threat of New Entrants
- 4.1.4. Threat of Substitutes
- 4.1.5. Competitive Rivalry
- 4.2. PESTEL analysis
- 4.3. BCG Analysis
- 4.3.1. Stars (High Growth, High Market Share)
- 4.3.2. Cash Cows (Low Growth, High Market Share)
- 4.3.3. Question Mark (High Growth, Low Market Share)
- 4.3.4. Dogs (Low Growth, Low Market Share)
- 4.4. Ansoff Matrix Analysis
- 4.5. Supply Chain Analysis
- 4.6. Regulatory Landscape
- 4.7. Current Market Potential and Opportunity Assessment (TAM–SAM–SOM Framework)
- 4.8. IMR Analyst Note
- 4.1. Porters Five Forces
- 5. Market Analysis, Insights and Forecast 2021-2033
- 5.1. Market Analysis, Insights and Forecast - by Type
- 5.1.1. B2B
- 5.1.2. B2C
- 5.1.3. Mixed/Hybrid
- 5.2. Market Analysis, Insights and Forecast - by Revenue Stream
- 5.2.1. Exhibitor Fee
- 5.2.2. Sponsorship Fee
- 5.2.3. Entrance Fee
- 5.2.4. Services
- 5.3. Market Analysis, Insights and Forecast - by End User
- 5.3.1. Consumer Goods and Retail Sector
- 5.3.2. Automotive and Transportation Sector
- 5.3.3. Industrial
- 5.3.4. Entertainment
- 5.3.5. Real Estate and Property
- 5.3.6. Hospitality Sector
- 5.3.7. Other End Users
- 5.4. Market Analysis, Insights and Forecast - by Region
- 5.4.1. North America
- 5.4.2. Europe
- 5.4.3. Asia Pacific
- 5.4.4. Latin America
- 5.4.5. Middle East and Africa
- 5.1. Market Analysis, Insights and Forecast - by Type
- 6. Global Events and Exhibition Market Analysis, Insights and Forecast, 2021-2033
- 6.1. Market Analysis, Insights and Forecast - by Type
- 6.1.1. B2B
- 6.1.2. B2C
- 6.1.3. Mixed/Hybrid
- 6.2. Market Analysis, Insights and Forecast - by Revenue Stream
- 6.2.1. Exhibitor Fee
- 6.2.2. Sponsorship Fee
- 6.2.3. Entrance Fee
- 6.2.4. Services
- 6.3. Market Analysis, Insights and Forecast - by End User
- 6.3.1. Consumer Goods and Retail Sector
- 6.3.2. Automotive and Transportation Sector
- 6.3.3. Industrial
- 6.3.4. Entertainment
- 6.3.5. Real Estate and Property
- 6.3.6. Hospitality Sector
- 6.3.7. Other End Users
- 6.1. Market Analysis, Insights and Forecast - by Type
- 7. North America Events and Exhibition Market Analysis, Insights and Forecast, 2020-2032
- 7.1. Market Analysis, Insights and Forecast - by Type
- 7.1.1. B2B
- 7.1.2. B2C
- 7.1.3. Mixed/Hybrid
- 7.2. Market Analysis, Insights and Forecast - by Revenue Stream
- 7.2.1. Exhibitor Fee
- 7.2.2. Sponsorship Fee
- 7.2.3. Entrance Fee
- 7.2.4. Services
- 7.3. Market Analysis, Insights and Forecast - by End User
- 7.3.1. Consumer Goods and Retail Sector
- 7.3.2. Automotive and Transportation Sector
- 7.3.3. Industrial
- 7.3.4. Entertainment
- 7.3.5. Real Estate and Property
- 7.3.6. Hospitality Sector
- 7.3.7. Other End Users
- 7.1. Market Analysis, Insights and Forecast - by Type
- 8. Europe Events and Exhibition Market Analysis, Insights and Forecast, 2020-2032
- 8.1. Market Analysis, Insights and Forecast - by Type
- 8.1.1. B2B
- 8.1.2. B2C
- 8.1.3. Mixed/Hybrid
- 8.2. Market Analysis, Insights and Forecast - by Revenue Stream
- 8.2.1. Exhibitor Fee
- 8.2.2. Sponsorship Fee
- 8.2.3. Entrance Fee
- 8.2.4. Services
- 8.3. Market Analysis, Insights and Forecast - by End User
- 8.3.1. Consumer Goods and Retail Sector
- 8.3.2. Automotive and Transportation Sector
- 8.3.3. Industrial
- 8.3.4. Entertainment
- 8.3.5. Real Estate and Property
- 8.3.6. Hospitality Sector
- 8.3.7. Other End Users
- 8.1. Market Analysis, Insights and Forecast - by Type
- 9. Asia Pacific Events and Exhibition Market Analysis, Insights and Forecast, 2020-2032
- 9.1. Market Analysis, Insights and Forecast - by Type
- 9.1.1. B2B
- 9.1.2. B2C
- 9.1.3. Mixed/Hybrid
- 9.2. Market Analysis, Insights and Forecast - by Revenue Stream
- 9.2.1. Exhibitor Fee
- 9.2.2. Sponsorship Fee
- 9.2.3. Entrance Fee
- 9.2.4. Services
- 9.3. Market Analysis, Insights and Forecast - by End User
- 9.3.1. Consumer Goods and Retail Sector
- 9.3.2. Automotive and Transportation Sector
- 9.3.3. Industrial
- 9.3.4. Entertainment
- 9.3.5. Real Estate and Property
- 9.3.6. Hospitality Sector
- 9.3.7. Other End Users
- 9.1. Market Analysis, Insights and Forecast - by Type
- 10. Latin America Events and Exhibition Market Analysis, Insights and Forecast, 2020-2032
- 10.1. Market Analysis, Insights and Forecast - by Type
- 10.1.1. B2B
- 10.1.2. B2C
- 10.1.3. Mixed/Hybrid
- 10.2. Market Analysis, Insights and Forecast - by Revenue Stream
- 10.2.1. Exhibitor Fee
- 10.2.2. Sponsorship Fee
- 10.2.3. Entrance Fee
- 10.2.4. Services
- 10.3. Market Analysis, Insights and Forecast - by End User
- 10.3.1. Consumer Goods and Retail Sector
- 10.3.2. Automotive and Transportation Sector
- 10.3.3. Industrial
- 10.3.4. Entertainment
- 10.3.5. Real Estate and Property
- 10.3.6. Hospitality Sector
- 10.3.7. Other End Users
- 10.1. Market Analysis, Insights and Forecast - by Type
- 11. Middle East and Africa Events and Exhibition Market Analysis, Insights and Forecast, 2020-2032
- 11.1. Market Analysis, Insights and Forecast - by Type
- 11.1.1. B2B
- 11.1.2. B2C
- 11.1.3. Mixed/Hybrid
- 11.2. Market Analysis, Insights and Forecast - by Revenue Stream
- 11.2.1. Exhibitor Fee
- 11.2.2. Sponsorship Fee
- 11.2.3. Entrance Fee
- 11.2.4. Services
- 11.3. Market Analysis, Insights and Forecast - by End User
- 11.3.1. Consumer Goods and Retail Sector
- 11.3.2. Automotive and Transportation Sector
- 11.3.3. Industrial
- 11.3.4. Entertainment
- 11.3.5. Real Estate and Property
- 11.3.6. Hospitality Sector
- 11.3.7. Other End Users
- 11.1. Market Analysis, Insights and Forecast - by Type
- 12. Competitive Analysis
- 12.1. Company Profiles
- 12.1.1 Deutsche Messe AG
- 12.1.1.1. Company Overview
- 12.1.1.2. Products
- 12.1.1.3. Company Financials
- 12.1.1.4. SWOT Analysis
- 12.1.2 GL Events
- 12.1.2.1. Company Overview
- 12.1.2.2. Products
- 12.1.2.3. Company Financials
- 12.1.2.4. SWOT Analysis
- 12.1.3 Messe Frankfurt GmbH
- 12.1.3.1. Company Overview
- 12.1.3.2. Products
- 12.1.3.3. Company Financials
- 12.1.3.4. SWOT Analysis
- 12.1.4 Viparis Holding
- 12.1.4.1. Company Overview
- 12.1.4.2. Products
- 12.1.4.3. Company Financials
- 12.1.4.4. SWOT Analysis
- 12.1.5 Comexposium Grou
- 12.1.5.1. Company Overview
- 12.1.5.2. Products
- 12.1.5.3. Company Financials
- 12.1.5.4. SWOT Analysis
- 12.1.6 Koelnmesse GmbH
- 12.1.6.1. Company Overview
- 12.1.6.2. Products
- 12.1.6.3. Company Financials
- 12.1.6.4. SWOT Analysis
- 12.1.7 Messe Dsseldorf GmbH
- 12.1.7.1. Company Overview
- 12.1.7.2. Products
- 12.1.7.3. Company Financials
- 12.1.7.4. SWOT Analysis
- 12.1.8 Percept Limited
- 12.1.8.1. Company Overview
- 12.1.8.2. Products
- 12.1.8.3. Company Financials
- 12.1.8.4. SWOT Analysis
- 12.1.9 Fiera Milano SpA
- 12.1.9.1. Company Overview
- 12.1.9.2. Products
- 12.1.9.3. Company Financials
- 12.1.9.4. SWOT Analysis
- 12.1.10 MCH Group AG
- 12.1.10.1. Company Overview
- 12.1.10.2. Products
- 12.1.10.3. Company Financials
- 12.1.10.4. SWOT Analysis
- 12.1.1 Deutsche Messe AG
- 12.2. Market Entropy
- 12.2.1 Company's Key Areas Served
- 12.2.2 Recent Developments
- 12.3. Company Market Share Analysis 2025
- 12.3.1 Top 5 Companies Market Share Analysis
- 12.3.2 Top 3 Companies Market Share Analysis
- 12.4. List of Potential Customers
- 13. Research Methodology
List of Figures
- Figure 1: Global Events and Exhibition Market Revenue Breakdown (Million, %) by Region 2025 & 2033
- Figure 2: North America Events and Exhibition Market Revenue (Million), by Type 2025 & 2033
- Figure 3: North America Events and Exhibition Market Revenue Share (%), by Type 2025 & 2033
- Figure 4: North America Events and Exhibition Market Revenue (Million), by Revenue Stream 2025 & 2033
- Figure 5: North America Events and Exhibition Market Revenue Share (%), by Revenue Stream 2025 & 2033
- Figure 6: North America Events and Exhibition Market Revenue (Million), by End User 2025 & 2033
- Figure 7: North America Events and Exhibition Market Revenue Share (%), by End User 2025 & 2033
- Figure 8: North America Events and Exhibition Market Revenue (Million), by Country 2025 & 2033
- Figure 9: North America Events and Exhibition Market Revenue Share (%), by Country 2025 & 2033
- Figure 10: Europe Events and Exhibition Market Revenue (Million), by Type 2025 & 2033
- Figure 11: Europe Events and Exhibition Market Revenue Share (%), by Type 2025 & 2033
- Figure 12: Europe Events and Exhibition Market Revenue (Million), by Revenue Stream 2025 & 2033
- Figure 13: Europe Events and Exhibition Market Revenue Share (%), by Revenue Stream 2025 & 2033
- Figure 14: Europe Events and Exhibition Market Revenue (Million), by End User 2025 & 2033
- Figure 15: Europe Events and Exhibition Market Revenue Share (%), by End User 2025 & 2033
- Figure 16: Europe Events and Exhibition Market Revenue (Million), by Country 2025 & 2033
- Figure 17: Europe Events and Exhibition Market Revenue Share (%), by Country 2025 & 2033
- Figure 18: Asia Pacific Events and Exhibition Market Revenue (Million), by Type 2025 & 2033
- Figure 19: Asia Pacific Events and Exhibition Market Revenue Share (%), by Type 2025 & 2033
- Figure 20: Asia Pacific Events and Exhibition Market Revenue (Million), by Revenue Stream 2025 & 2033
- Figure 21: Asia Pacific Events and Exhibition Market Revenue Share (%), by Revenue Stream 2025 & 2033
- Figure 22: Asia Pacific Events and Exhibition Market Revenue (Million), by End User 2025 & 2033
- Figure 23: Asia Pacific Events and Exhibition Market Revenue Share (%), by End User 2025 & 2033
- Figure 24: Asia Pacific Events and Exhibition Market Revenue (Million), by Country 2025 & 2033
- Figure 25: Asia Pacific Events and Exhibition Market Revenue Share (%), by Country 2025 & 2033
- Figure 26: Latin America Events and Exhibition Market Revenue (Million), by Type 2025 & 2033
- Figure 27: Latin America Events and Exhibition Market Revenue Share (%), by Type 2025 & 2033
- Figure 28: Latin America Events and Exhibition Market Revenue (Million), by Revenue Stream 2025 & 2033
- Figure 29: Latin America Events and Exhibition Market Revenue Share (%), by Revenue Stream 2025 & 2033
- Figure 30: Latin America Events and Exhibition Market Revenue (Million), by End User 2025 & 2033
- Figure 31: Latin America Events and Exhibition Market Revenue Share (%), by End User 2025 & 2033
- Figure 32: Latin America Events and Exhibition Market Revenue (Million), by Country 2025 & 2033
- Figure 33: Latin America Events and Exhibition Market Revenue Share (%), by Country 2025 & 2033
- Figure 34: Middle East and Africa Events and Exhibition Market Revenue (Million), by Type 2025 & 2033
- Figure 35: Middle East and Africa Events and Exhibition Market Revenue Share (%), by Type 2025 & 2033
- Figure 36: Middle East and Africa Events and Exhibition Market Revenue (Million), by Revenue Stream 2025 & 2033
- Figure 37: Middle East and Africa Events and Exhibition Market Revenue Share (%), by Revenue Stream 2025 & 2033
- Figure 38: Middle East and Africa Events and Exhibition Market Revenue (Million), by End User 2025 & 2033
- Figure 39: Middle East and Africa Events and Exhibition Market Revenue Share (%), by End User 2025 & 2033
- Figure 40: Middle East and Africa Events and Exhibition Market Revenue (Million), by Country 2025 & 2033
- Figure 41: Middle East and Africa Events and Exhibition Market Revenue Share (%), by Country 2025 & 2033
List of Tables
- Table 1: Global Events and Exhibition Market Revenue Million Forecast, by Type 2020 & 2033
- Table 2: Global Events and Exhibition Market Revenue Million Forecast, by Revenue Stream 2020 & 2033
- Table 3: Global Events and Exhibition Market Revenue Million Forecast, by End User 2020 & 2033
- Table 4: Global Events and Exhibition Market Revenue Million Forecast, by Region 2020 & 2033
- Table 5: Global Events and Exhibition Market Revenue Million Forecast, by Type 2020 & 2033
- Table 6: Global Events and Exhibition Market Revenue Million Forecast, by Revenue Stream 2020 & 2033
- Table 7: Global Events and Exhibition Market Revenue Million Forecast, by End User 2020 & 2033
- Table 8: Global Events and Exhibition Market Revenue Million Forecast, by Country 2020 & 2033
- Table 9: United States Events and Exhibition Market Revenue (Million) Forecast, by Application 2020 & 2033
- Table 10: Canada Events and Exhibition Market Revenue (Million) Forecast, by Application 2020 & 2033
- Table 11: Global Events and Exhibition Market Revenue Million Forecast, by Type 2020 & 2033
- Table 12: Global Events and Exhibition Market Revenue Million Forecast, by Revenue Stream 2020 & 2033
- Table 13: Global Events and Exhibition Market Revenue Million Forecast, by End User 2020 & 2033
- Table 14: Global Events and Exhibition Market Revenue Million Forecast, by Country 2020 & 2033
- Table 15: Germany Events and Exhibition Market Revenue (Million) Forecast, by Application 2020 & 2033
- Table 16: United Kingdom Events and Exhibition Market Revenue (Million) Forecast, by Application 2020 & 2033
- Table 17: France Events and Exhibition Market Revenue (Million) Forecast, by Application 2020 & 2033
- Table 18: Global Events and Exhibition Market Revenue Million Forecast, by Type 2020 & 2033
- Table 19: Global Events and Exhibition Market Revenue Million Forecast, by Revenue Stream 2020 & 2033
- Table 20: Global Events and Exhibition Market Revenue Million Forecast, by End User 2020 & 2033
- Table 21: Global Events and Exhibition Market Revenue Million Forecast, by Country 2020 & 2033
- Table 22: China Events and Exhibition Market Revenue (Million) Forecast, by Application 2020 & 2033
- Table 23: Japan Events and Exhibition Market Revenue (Million) Forecast, by Application 2020 & 2033
- Table 24: India Events and Exhibition Market Revenue (Million) Forecast, by Application 2020 & 2033
- Table 25: South Korea Events and Exhibition Market Revenue (Million) Forecast, by Application 2020 & 2033
- Table 26: Australia and New Zealand Events and Exhibition Market Revenue (Million) Forecast, by Application 2020 & 2033
- Table 27: Global Events and Exhibition Market Revenue Million Forecast, by Type 2020 & 2033
- Table 28: Global Events and Exhibition Market Revenue Million Forecast, by Revenue Stream 2020 & 2033
- Table 29: Global Events and Exhibition Market Revenue Million Forecast, by End User 2020 & 2033
- Table 30: Global Events and Exhibition Market Revenue Million Forecast, by Country 2020 & 2033
- Table 31: Global Events and Exhibition Market Revenue Million Forecast, by Type 2020 & 2033
- Table 32: Global Events and Exhibition Market Revenue Million Forecast, by Revenue Stream 2020 & 2033
- Table 33: Global Events and Exhibition Market Revenue Million Forecast, by End User 2020 & 2033
- Table 34: Global Events and Exhibition Market Revenue Million Forecast, by Country 2020 & 2033
Frequently Asked Questions
1. What is the projected Compound Annual Growth Rate (CAGR) of the Events and Exhibition Market?
The projected CAGR is approximately 5.29%.
2. Which companies are prominent players in the Events and Exhibition Market?
Key companies in the market include Deutsche Messe AG, GL Events, Messe Frankfurt GmbH, Viparis Holding, Comexposium Grou, Koelnmesse GmbH, Messe Dsseldorf GmbH, Percept Limited, Fiera Milano SpA, MCH Group AG.
3. What are the main segments of the Events and Exhibition Market?
The market segments include Type, Revenue Stream, End User.
4. Can you provide details about the market size?
The market size is estimated to be USD 54.30 Million as of 2022.
5. What are some drivers contributing to market growth?
Growing Adoption of Geo-Cloning for Exhibition Organizers; Increasing Growth of Consumer Goods Penetrates the Growth of B2C Exhibition.
6. What are the notable trends driving market growth?
Entertainment Sector to Witness Fastest Growth.
7. Are there any restraints impacting market growth?
Loss Due to Restrictions of Smaller Players to Participate Owing to Potential Low Turnouts.
8. Can you provide examples of recent developments in the market?
November 2023 - Art Design Chicago, an initiative of the Terra Foundation for American Art in partnership with local artists and arts organizations, is a citywide collaboration and series of events and exhibitions that highlight the voices and stories that are part of the city's unique artistic heritage and creative communities. Continuing into 2025, more than 50 Chicago-area arts organizations across 30 Chicago neighborhoods and several suburban communities showcase the work of hundreds of artists.
9. What pricing options are available for accessing the report?
Pricing options include single-user, multi-user, and enterprise licenses priced at USD 4750, USD 5250, and USD 8750 respectively.
10. Is the market size provided in terms of value or volume?
The market size is provided in terms of value, measured in Million.
11. Are there any specific market keywords associated with the report?
Yes, the market keyword associated with the report is "Events and Exhibition Market," which aids in identifying and referencing the specific market segment covered.
12. How do I determine which pricing option suits my needs best?
The pricing options vary based on user requirements and access needs. Individual users may opt for single-user licenses, while businesses requiring broader access may choose multi-user or enterprise licenses for cost-effective access to the report.
13. Are there any additional resources or data provided in the Events and Exhibition Market report?
While the report offers comprehensive insights, it's advisable to review the specific contents or supplementary materials provided to ascertain if additional resources or data are available.
14. How can I stay updated on further developments or reports in the Events and Exhibition Market?
To stay informed about further developments, trends, and reports in the Events and Exhibition Market, consider subscribing to industry newsletters, following relevant companies and organizations, or regularly checking reputable industry news sources and publications.
Methodology
Step 1 - Identification of Relevant Samples Size from Population Database


Step 2 - Approaches for Defining Global Market Size (Value, Volume* & Price*)

Note*: In applicable scenarios
Step 3 - Data Sources
Primary Research
- Web Analytics
- Survey Reports
- Research Institute
- Latest Research Reports
- Opinion Leaders
Secondary Research
- Annual Reports
- White Paper
- Latest Press Release
- Industry Association
- Paid Database
- Investor Presentations

Step 4 - Data Triangulation
Involves using different sources of information in order to increase the validity of a study
These sources are likely to be stakeholders in a program - participants, other researchers, program staff, other community members, and so on.
Then we put all data in single framework & apply various statistical tools to find out the dynamic on the market.
During the analysis stage, feedback from the stakeholder groups would be compared to determine areas of agreement as well as areas of divergence