

Key Insights
The global Fluid Power Equipment Market in Mobile Equipment is experiencing robust growth, projected to reach a substantial size with a Compound Annual Growth Rate (CAGR) of 6.60%. This expansion is fueled by the increasing demand for efficient and powerful hydraulic and pneumatic systems in a wide array of mobile machinery across key sectors. The construction industry, driven by infrastructure development and urbanization, stands as a primary consumer of fluid power solutions. Similarly, the agriculture sector's ongoing mechanization and the need for advanced farming equipment contribute significantly to market dynamics. Furthermore, the material handling and mining industries, with their constant requirement for heavy-duty equipment and sophisticated operational capabilities, represent substantial growth avenues. The market's expansion is further propelled by technological advancements leading to the development of more energy-efficient, precise, and reliable fluid power components. Innovations in smart hydraulics, IoT integration for predictive maintenance, and the development of advanced filter technologies are shaping the competitive landscape and driving adoption rates.
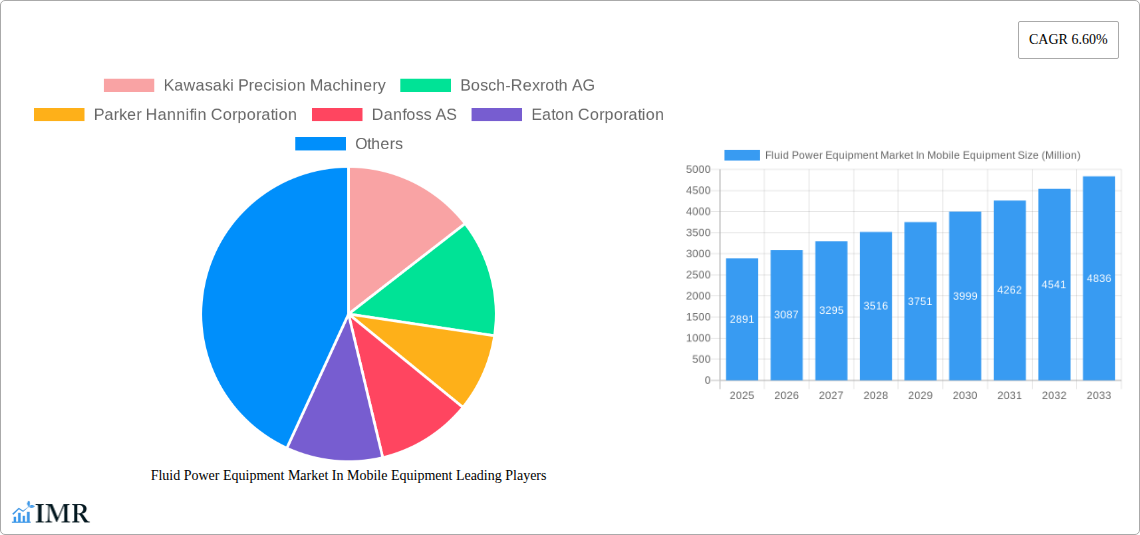
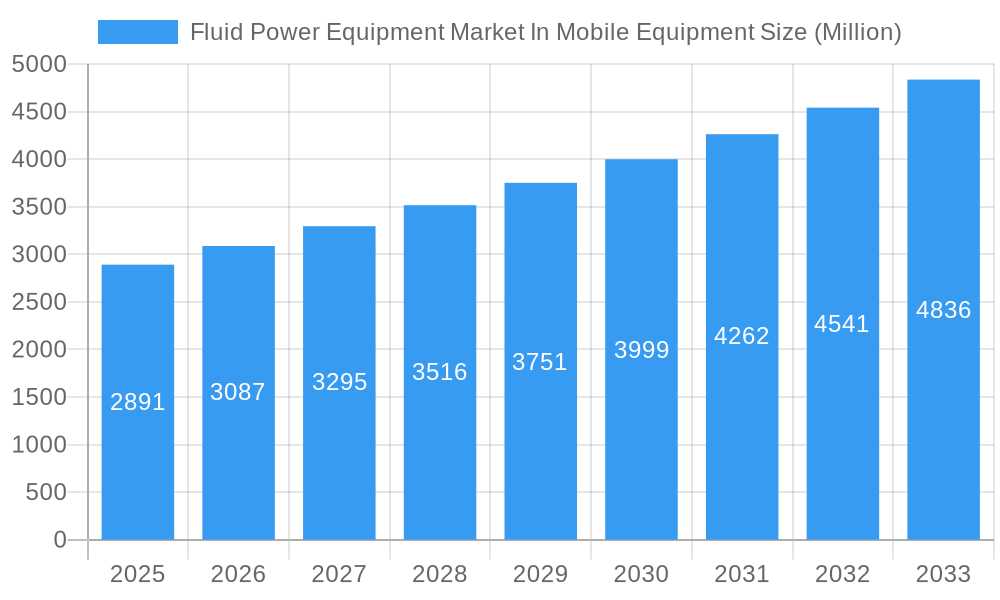
Fluid Power Equipment Market In Mobile Equipment Market Size (In Billion)
The market is segmented into hydraulics and pneumatics, with hydraulics currently dominating due to their higher power density and suitability for heavy-duty mobile applications. Within hydraulics, pumps, motors, and valves are critical components experiencing consistent demand. Pneumatic systems, while having a smaller share in mobile equipment compared to hydraulics, are finding increasing applications in areas requiring precise control and lighter-duty operations, such as actuators and fittings. Geographic regions like North America and Europe, with their established industrial bases and high adoption of advanced machinery, currently hold significant market shares. However, the Asia-Pacific region is anticipated to exhibit the fastest growth due to rapid industrialization, increasing infrastructure projects, and a growing manufacturing sector. Restraints such as the high initial cost of some fluid power systems and the increasing competition from electric and electronic actuation technologies are present, but the inherent advantages of fluid power in terms of power-to-weight ratio and durability continue to ensure its strong market position.
Fluid Power Equipment Market In Mobile Equipment Company Market Share
This in-depth report provides a strategic outlook on the global Fluid Power Equipment Market in Mobile Equipment, crucial for understanding the intricate dynamics of hydraulics and pneumatics in construction, agriculture, material handling, mining, and other key sectors. Spanning from 2019 to 2033, with a detailed focus on the 2025 base and estimated year and the 2025-2033 forecast period, this analysis delves into market size evolution, key growth drivers, emerging opportunities, and competitive landscapes. It offers unparalleled insights into both parent and child markets, delivering actionable intelligence for stakeholders seeking to capitalize on the projected growth of mobile hydraulic and pneumatic systems. Expect quantitative data presented in Million units and qualitative analysis that navigates technological advancements, regulatory shifts, and end-user demands.
Fluid Power Equipment Market In Mobile Equipment Market Dynamics & Structure
The global Fluid Power Equipment Market in Mobile Equipment is characterized by a moderate to high market concentration, with a few key players like Parker Hannifin Corporation, Bosch-Rexroth AG, and Eaton Corporation holding significant shares. Technological innovation remains a primary driver, with continuous advancements in energy efficiency, miniaturization, and smart control systems for hydraulic pumps, motors, valves, and pneumatic actuators. Regulatory frameworks, particularly concerning emissions and safety standards for mobile machinery, are increasingly influencing product development and adoption. Competitive product substitutes, while present in some niche applications, are generally outmatched by the robust performance and power density of fluid power systems. End-user demographics are shifting towards more sophisticated demands for automation, precision, and remote operability in construction, agriculture, and material handling equipment. Mergers and acquisitions (M&A) activity is a recurring trend as companies seek to expand their product portfolios, geographical reach, and technological capabilities. For instance, the last five years have seen an average of 5-8 significant M&A deals annually, indicating consolidation and strategic partnerships aimed at enhancing market position. Innovation barriers include high R&D costs, the need for specialized expertise, and the long product development cycles inherent in heavy-duty mobile equipment.
Fluid Power Equipment Market In Mobile Equipment Growth Trends & Insights
The Fluid Power Equipment Market in Mobile Equipment is projected to experience robust growth, driven by increasing mechanization in developing economies and the ongoing demand for advanced mobile machinery across various industries. The market size is estimated to reach $XX,XXX million units by 2033, exhibiting a Compound Annual Growth Rate (CAGR) of approximately 6.2% during the forecast period (2025-2033). Adoption rates for sophisticated fluid power components, such as variable displacement pumps and proportional valves, are escalating as manufacturers prioritize fuel efficiency and precise operational control. Technological disruptions, including the integration of IoT sensors for predictive maintenance and the development of more energy-efficient hydraulic fluids, are transforming the market. Consumer behavior shifts are evident in the growing preference for autonomous and semi-autonomous mobile equipment, which heavily relies on advanced fluid power systems for actuation and control. Market penetration is deepening in the construction sector, fueled by massive infrastructure development projects globally, and in agriculture, driven by precision farming initiatives. The demand for electric and hybrid mobile equipment is also spurring innovation in electro-hydraulic systems, creating new avenues for growth.
Dominant Regions, Countries, or Segments in Fluid Power Equipment Market In Mobile Equipment
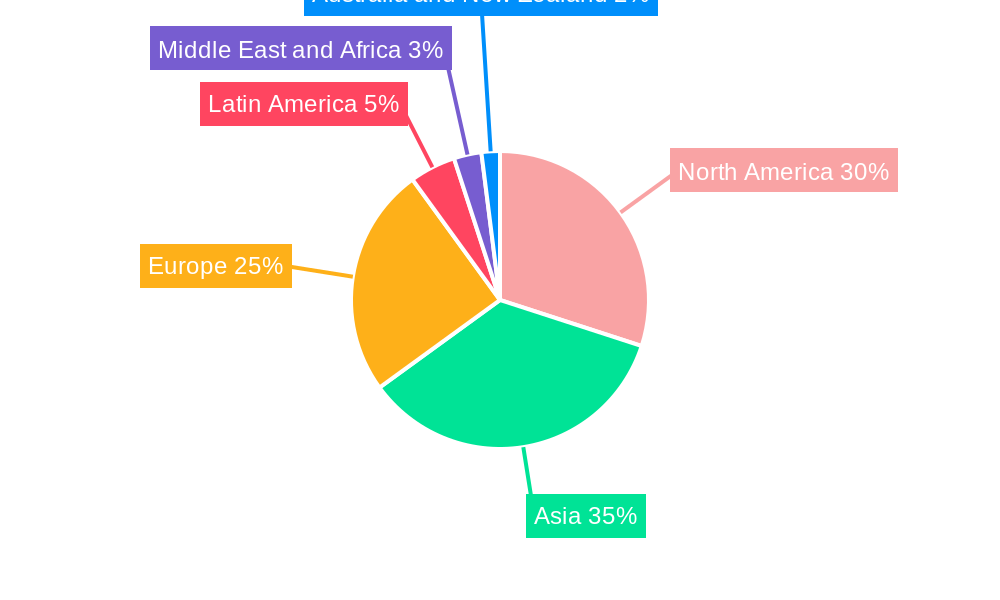
North America and Europe currently represent the dominant regions in the Fluid Power Equipment Market in Mobile Equipment, driven by their established industrial bases, high levels of technological adoption, and significant investments in infrastructure and modern agriculture. The Construction end-user vertical stands out as the primary growth driver, accounting for an estimated 35% of the market share.
- North America: This region benefits from extensive construction projects, advanced agricultural practices, and a strong mining industry. Favorable government policies supporting infrastructure development and technological innovation further bolster market growth. The United States, in particular, leads in the adoption of advanced hydraulic systems for its vast construction and agricultural machinery fleet.
- Europe: A mature market with a strong emphasis on sustainability and energy efficiency. European manufacturers are at the forefront of developing compact and high-performance fluid power solutions for construction, material handling, and agriculture. Stringent environmental regulations in countries like Germany and France are accelerating the adoption of more efficient and cleaner fluid power technologies.
- Asia-Pacific: This region is emerging as a high-growth market, propelled by rapid industrialization, urbanization, and increasing investments in infrastructure and agricultural modernization in countries like China and India. The sheer volume of mobile equipment deployed in these countries presents substantial opportunities for fluid power component manufacturers.
Within product segments, Hydraulics commands a larger market share, estimated at 70%, with Pumps and Valves being the most significant sub-segments.
- Hydraulics:
- Pumps: Essential for generating flow and pressure, pumps are critical across all mobile equipment applications. Demand is high for advanced piston pumps and gear pumps offering high efficiency and durability.
- Valves: Proportional and servo valves are gaining traction for their precision control in complex mobile machinery operations.
- Cylinders: Robust and reliable, hydraulic cylinders are fundamental to actuation in construction and agricultural machinery.
- Pneumatics: While a smaller segment in mobile equipment compared to hydraulics, pneumatic systems are crucial for specific applications like braking systems, suspension, and auxiliary functions in certain heavy-duty vehicles and industrial material handling equipment. Actuators and Fittings are key components within this segment.
Fluid Power Equipment Market In Mobile Equipment Product Landscape
The product landscape of the Fluid Power Equipment Market in Mobile Equipment is characterized by continuous innovation aimed at enhancing performance, efficiency, and reliability. Hydraulic pumps are evolving towards variable displacement designs and integrated electronic controls for optimal power management. Advanced valve technologies, including proportional and servo valves, enable precise and dynamic control of hydraulic actuators, leading to improved machine performance and fuel economy. Pneumatic actuators are increasingly being designed for higher force density and faster response times. Innovations in filtration systems focus on extending component life and reducing maintenance downtime, a critical factor in mobile equipment. The integration of smart sensors and connectivity features is also a growing trend, enabling remote monitoring and diagnostics of fluid power systems.
Key Drivers, Barriers & Challenges in Fluid Power Equipment Market In Mobile Equipment
Key Drivers:
- Infrastructure Development: Global investments in roads, bridges, and urban infrastructure significantly boost demand for construction machinery, a primary consumer of fluid power equipment.
- Agricultural Modernization: The adoption of advanced farming techniques and the need for efficient agricultural machinery are driving demand for hydraulic and pneumatic systems.
- Technological Advancements: Innovations in energy efficiency, smart controls, and IoT integration enhance the performance and appeal of fluid power solutions.
- Industrial Growth in Emerging Economies: Rapid industrialization and manufacturing growth in regions like Asia-Pacific create substantial demand for material handling and manufacturing equipment.
Barriers & Challenges:
- High Initial Cost: The upfront investment for sophisticated fluid power systems can be a barrier for some smaller end-users.
- Maintenance Complexity: While reliability is high, specialized knowledge and tools are often required for effective maintenance and repair of fluid power systems.
- Environmental Regulations: Increasingly stringent emissions standards necessitate the development of more energy-efficient and environmentally friendly fluid power solutions.
- Supply Chain Disruptions: Global supply chain volatility can impact the availability and cost of raw materials and finished components, posing a challenge for manufacturers.
- Competition from Electric Powertrains: While fluid power remains dominant, the growing adoption of electric powertrains in some mobile equipment segments presents a long-term competitive challenge.
Emerging Opportunities in Fluid Power Equipment Market In Mobile Equipment
Emerging opportunities in the Fluid Power Equipment Market in Mobile Equipment lie in the growing demand for hybrid and electric-hydraulic systems, particularly in construction and material handling. The increasing focus on automation and remote operation of mobile machinery presents a significant opportunity for smart fluid power components with integrated sensor technology and connectivity. Furthermore, the expansion of precision agriculture in developing nations will drive the demand for sophisticated hydraulic systems for specialized agricultural equipment. The retrofitting market for upgrading older mobile machinery with more efficient and technologically advanced fluid power components also represents an untapped segment.
Growth Accelerators in the Fluid Power Equipment Market In Mobile Equipment Industry
Growth in the Fluid Power Equipment Market in Mobile Equipment industry is being accelerated by several key factors. The ongoing trend towards electrification in mobile machinery is spurring the development of advanced electro-hydraulic and hybrid systems, blending the power density of hydraulics with the efficiency of electric powertrains. Strategic partnerships between fluid power component manufacturers and original equipment manufacturers (OEMs) are crucial for co-developing integrated solutions tailored to specific mobile equipment applications. Market expansion strategies, particularly focusing on the rapidly growing construction and agriculture sectors in emerging economies like India and Southeast Asia, are providing significant growth impetus. Furthermore, continuous investment in R&D for lighter, more durable, and energy-efficient components is expanding the application scope of fluid power.
Key Players Shaping the Fluid Power Equipment Market In Mobile Equipment Market
- Kawasaki Precision Machinery
- Bosch-Rexroth AG
- Parker Hannifin Corporation
- Danfoss AS
- Eaton Corporation
- Hydac International GmbH
- HydraForce Inc
- Festo Corporation
- SMC Corporation
- List Not Exhaustive
Notable Milestones in Fluid Power Equipment Market In Mobile Equipment Sector
- February 2024: Power management company Eaton announced that its Mobility Group is expanding its mobile power products portfolio with the introduction of the Bezares 3960, 2500, and 500 series power takeoff (PTO) units, as well as APSCO APV and APG series directional hydraulic control valves. The new offerings are expected to be introduced at the Work Truck Show, March 5-8 in Indianapolis, signaling a focus on enhancing PTO and control valve solutions for mobile applications.
- July 2023: Bosch Rexroth opened a new plant in Querétaro, Mexico, with a vision to create more manufacturing capacity for mobile hydraulics and factory automation in North America and shorten delivery routes for customers in the region. The company claimed that it is investing about EUR 160 million in the new location and would create about 900 jobs by 2027. At its 42,000-square-meter, or 452,000-square-foot, plant in Querétaro, the company began manufacturing hydraulic pumps, motors, and valves for mobile machinery, like excavators, forklifts, and tractors, in June 2023, demonstrating a commitment to regional production and meeting growing North American demand.
In-Depth Fluid Power Equipment Market In Mobile Equipment Market Outlook
The future outlook for the Fluid Power Equipment Market in Mobile Equipment is exceptionally promising, driven by ongoing technological innovation and a persistent global demand for efficient and powerful mobile machinery. The integration of digitalization and smart technologies into fluid power systems will be a key differentiator, enabling enhanced predictive maintenance, operational optimization, and remote control capabilities. The increasing adoption of electric and hybrid powertrains in mobile equipment will continue to foster the development of sophisticated electro-hydraulic solutions, creating synergistic growth opportunities. Strategic expansions in emerging markets, coupled with a continued focus on energy efficiency and sustainability, will shape the market's trajectory, solidifying fluid power's indispensable role in the heavy machinery sector.
Fluid Power Equipment Market In Mobile Equipment Segmentation
-
1. Product Type
-
1.1. Hydraulics
- 1.1.1. Pumps
- 1.1.2. Motors
- 1.1.3. Valves
- 1.1.4. Cylinders
- 1.1.5. Accumulators and Filters
- 1.1.6. Other Pr
-
1.2. Pneumatics
- 1.2.1. Actuators
- 1.2.2. FRLs
- 1.2.3. Fittings
- 1.2.4. Other Pr
-
1.1. Hydraulics
-
2. End-user Vertical
- 2.1. Construction
- 2.2. Agriculture
- 2.3. Material Handling
- 2.4. Mining
- 2.5. Other En
Fluid Power Equipment Market In Mobile Equipment Segmentation By Geography
- 1. North America
- 2. Asia
- 3. Europe
- 4. Latin America
- 5. Middle East and Africa
- 6. Australia and New Zealand
Fluid Power Equipment Market In Mobile Equipment Regional Market Share
Geographic Coverage of Fluid Power Equipment Market In Mobile Equipment
Fluid Power Equipment Market In Mobile Equipment REPORT HIGHLIGHTS
| Aspects | Details |
|---|---|
| Study Period | 2020-2034 |
| Base Year | 2025 |
| Estimated Year | 2026 |
| Forecast Period | 2026-2034 |
| Historical Period | 2020-2025 |
| Growth Rate | CAGR of 6.60% from 2020-2034 |
| Segmentation |
|
Table of Contents
- 1. Introduction
- 1.1. Research Scope
- 1.2. Market Segmentation
- 1.3. Research Objective
- 1.4. Definitions and Assumptions
- 2. Executive Summary
- 2.1. Market Snapshot
- 3. Market Dynamics
- 3.1. Market Drivers
- 3.2. Market Restrains
- 3.3. Market Trends
- 3.4. Market Opportunities
- 4. Market Factor Analysis
- 4.1. Porters Five Forces
- 4.1.1. Bargaining Power of Suppliers
- 4.1.2. Bargaining Power of Buyers
- 4.1.3. Threat of New Entrants
- 4.1.4. Threat of Substitutes
- 4.1.5. Competitive Rivalry
- 4.2. PESTEL analysis
- 4.3. BCG Analysis
- 4.3.1. Stars (High Growth, High Market Share)
- 4.3.2. Cash Cows (Low Growth, High Market Share)
- 4.3.3. Question Mark (High Growth, Low Market Share)
- 4.3.4. Dogs (Low Growth, Low Market Share)
- 4.4. Ansoff Matrix Analysis
- 4.5. Supply Chain Analysis
- 4.6. Regulatory Landscape
- 4.7. Current Market Potential and Opportunity Assessment (TAM–SAM–SOM Framework)
- 4.8. IMR Analyst Note
- 4.1. Porters Five Forces
- 5. Market Analysis, Insights and Forecast 2021-2033
- 5.1. Market Analysis, Insights and Forecast - by Product Type
- 5.1.1. Hydraulics
- 5.1.1.1. Pumps
- 5.1.1.2. Motors
- 5.1.1.3. Valves
- 5.1.1.4. Cylinders
- 5.1.1.5. Accumulators and Filters
- 5.1.1.6. Other Pr
- 5.1.2. Pneumatics
- 5.1.2.1. Actuators
- 5.1.2.2. FRLs
- 5.1.2.3. Fittings
- 5.1.2.4. Other Pr
- 5.1.1. Hydraulics
- 5.2. Market Analysis, Insights and Forecast - by End-user Vertical
- 5.2.1. Construction
- 5.2.2. Agriculture
- 5.2.3. Material Handling
- 5.2.4. Mining
- 5.2.5. Other En
- 5.3. Market Analysis, Insights and Forecast - by Region
- 5.3.1. North America
- 5.3.2. Asia
- 5.3.3. Europe
- 5.3.4. Latin America
- 5.3.5. Middle East and Africa
- 5.3.6. Australia and New Zealand
- 5.1. Market Analysis, Insights and Forecast - by Product Type
- 6. Global Fluid Power Equipment Market In Mobile Equipment Analysis, Insights and Forecast, 2021-2033
- 6.1. Market Analysis, Insights and Forecast - by Product Type
- 6.1.1. Hydraulics
- 6.1.1.1. Pumps
- 6.1.1.2. Motors
- 6.1.1.3. Valves
- 6.1.1.4. Cylinders
- 6.1.1.5. Accumulators and Filters
- 6.1.1.6. Other Pr
- 6.1.2. Pneumatics
- 6.1.2.1. Actuators
- 6.1.2.2. FRLs
- 6.1.2.3. Fittings
- 6.1.2.4. Other Pr
- 6.1.1. Hydraulics
- 6.2. Market Analysis, Insights and Forecast - by End-user Vertical
- 6.2.1. Construction
- 6.2.2. Agriculture
- 6.2.3. Material Handling
- 6.2.4. Mining
- 6.2.5. Other En
- 6.1. Market Analysis, Insights and Forecast - by Product Type
- 7. North America Fluid Power Equipment Market In Mobile Equipment Analysis, Insights and Forecast, 2020-2032
- 7.1. Market Analysis, Insights and Forecast - by Product Type
- 7.1.1. Hydraulics
- 7.1.1.1. Pumps
- 7.1.1.2. Motors
- 7.1.1.3. Valves
- 7.1.1.4. Cylinders
- 7.1.1.5. Accumulators and Filters
- 7.1.1.6. Other Pr
- 7.1.2. Pneumatics
- 7.1.2.1. Actuators
- 7.1.2.2. FRLs
- 7.1.2.3. Fittings
- 7.1.2.4. Other Pr
- 7.1.1. Hydraulics
- 7.2. Market Analysis, Insights and Forecast - by End-user Vertical
- 7.2.1. Construction
- 7.2.2. Agriculture
- 7.2.3. Material Handling
- 7.2.4. Mining
- 7.2.5. Other En
- 7.1. Market Analysis, Insights and Forecast - by Product Type
- 8. Asia Fluid Power Equipment Market In Mobile Equipment Analysis, Insights and Forecast, 2020-2032
- 8.1. Market Analysis, Insights and Forecast - by Product Type
- 8.1.1. Hydraulics
- 8.1.1.1. Pumps
- 8.1.1.2. Motors
- 8.1.1.3. Valves
- 8.1.1.4. Cylinders
- 8.1.1.5. Accumulators and Filters
- 8.1.1.6. Other Pr
- 8.1.2. Pneumatics
- 8.1.2.1. Actuators
- 8.1.2.2. FRLs
- 8.1.2.3. Fittings
- 8.1.2.4. Other Pr
- 8.1.1. Hydraulics
- 8.2. Market Analysis, Insights and Forecast - by End-user Vertical
- 8.2.1. Construction
- 8.2.2. Agriculture
- 8.2.3. Material Handling
- 8.2.4. Mining
- 8.2.5. Other En
- 8.1. Market Analysis, Insights and Forecast - by Product Type
- 9. Europe Fluid Power Equipment Market In Mobile Equipment Analysis, Insights and Forecast, 2020-2032
- 9.1. Market Analysis, Insights and Forecast - by Product Type
- 9.1.1. Hydraulics
- 9.1.1.1. Pumps
- 9.1.1.2. Motors
- 9.1.1.3. Valves
- 9.1.1.4. Cylinders
- 9.1.1.5. Accumulators and Filters
- 9.1.1.6. Other Pr
- 9.1.2. Pneumatics
- 9.1.2.1. Actuators
- 9.1.2.2. FRLs
- 9.1.2.3. Fittings
- 9.1.2.4. Other Pr
- 9.1.1. Hydraulics
- 9.2. Market Analysis, Insights and Forecast - by End-user Vertical
- 9.2.1. Construction
- 9.2.2. Agriculture
- 9.2.3. Material Handling
- 9.2.4. Mining
- 9.2.5. Other En
- 9.1. Market Analysis, Insights and Forecast - by Product Type
- 10. Latin America Fluid Power Equipment Market In Mobile Equipment Analysis, Insights and Forecast, 2020-2032
- 10.1. Market Analysis, Insights and Forecast - by Product Type
- 10.1.1. Hydraulics
- 10.1.1.1. Pumps
- 10.1.1.2. Motors
- 10.1.1.3. Valves
- 10.1.1.4. Cylinders
- 10.1.1.5. Accumulators and Filters
- 10.1.1.6. Other Pr
- 10.1.2. Pneumatics
- 10.1.2.1. Actuators
- 10.1.2.2. FRLs
- 10.1.2.3. Fittings
- 10.1.2.4. Other Pr
- 10.1.1. Hydraulics
- 10.2. Market Analysis, Insights and Forecast - by End-user Vertical
- 10.2.1. Construction
- 10.2.2. Agriculture
- 10.2.3. Material Handling
- 10.2.4. Mining
- 10.2.5. Other En
- 10.1. Market Analysis, Insights and Forecast - by Product Type
- 11. Middle East and Africa Fluid Power Equipment Market In Mobile Equipment Analysis, Insights and Forecast, 2020-2032
- 11.1. Market Analysis, Insights and Forecast - by Product Type
- 11.1.1. Hydraulics
- 11.1.1.1. Pumps
- 11.1.1.2. Motors
- 11.1.1.3. Valves
- 11.1.1.4. Cylinders
- 11.1.1.5. Accumulators and Filters
- 11.1.1.6. Other Pr
- 11.1.2. Pneumatics
- 11.1.2.1. Actuators
- 11.1.2.2. FRLs
- 11.1.2.3. Fittings
- 11.1.2.4. Other Pr
- 11.1.1. Hydraulics
- 11.2. Market Analysis, Insights and Forecast - by End-user Vertical
- 11.2.1. Construction
- 11.2.2. Agriculture
- 11.2.3. Material Handling
- 11.2.4. Mining
- 11.2.5. Other En
- 11.1. Market Analysis, Insights and Forecast - by Product Type
- 12. Australia and New Zealand Fluid Power Equipment Market In Mobile Equipment Analysis, Insights and Forecast, 2020-2032
- 12.1. Market Analysis, Insights and Forecast - by Product Type
- 12.1.1. Hydraulics
- 12.1.1.1. Pumps
- 12.1.1.2. Motors
- 12.1.1.3. Valves
- 12.1.1.4. Cylinders
- 12.1.1.5. Accumulators and Filters
- 12.1.1.6. Other Pr
- 12.1.2. Pneumatics
- 12.1.2.1. Actuators
- 12.1.2.2. FRLs
- 12.1.2.3. Fittings
- 12.1.2.4. Other Pr
- 12.1.1. Hydraulics
- 12.2. Market Analysis, Insights and Forecast - by End-user Vertical
- 12.2.1. Construction
- 12.2.2. Agriculture
- 12.2.3. Material Handling
- 12.2.4. Mining
- 12.2.5. Other En
- 12.1. Market Analysis, Insights and Forecast - by Product Type
- 13. Competitive Analysis
- 13.1. Company Profiles
- 13.1.1 Kawasaki Precision Machinery
- 13.1.1.1. Company Overview
- 13.1.1.2. Products
- 13.1.1.3. Company Financials
- 13.1.1.4. SWOT Analysis
- 13.1.2 Bosch-Rexroth AG
- 13.1.2.1. Company Overview
- 13.1.2.2. Products
- 13.1.2.3. Company Financials
- 13.1.2.4. SWOT Analysis
- 13.1.3 Parker Hannifin Corporation
- 13.1.3.1. Company Overview
- 13.1.3.2. Products
- 13.1.3.3. Company Financials
- 13.1.3.4. SWOT Analysis
- 13.1.4 Danfoss AS
- 13.1.4.1. Company Overview
- 13.1.4.2. Products
- 13.1.4.3. Company Financials
- 13.1.4.4. SWOT Analysis
- 13.1.5 Eaton Corporation
- 13.1.5.1. Company Overview
- 13.1.5.2. Products
- 13.1.5.3. Company Financials
- 13.1.5.4. SWOT Analysis
- 13.1.6 Hydac International GmbH
- 13.1.6.1. Company Overview
- 13.1.6.2. Products
- 13.1.6.3. Company Financials
- 13.1.6.4. SWOT Analysis
- 13.1.7 HydraForce Inc
- 13.1.7.1. Company Overview
- 13.1.7.2. Products
- 13.1.7.3. Company Financials
- 13.1.7.4. SWOT Analysis
- 13.1.8 Festo Corporation
- 13.1.8.1. Company Overview
- 13.1.8.2. Products
- 13.1.8.3. Company Financials
- 13.1.8.4. SWOT Analysis
- 13.1.9 SMC Corporation*List Not Exhaustive 7 2 Vendor Ranking Analysi
- 13.1.9.1. Company Overview
- 13.1.9.2. Products
- 13.1.9.3. Company Financials
- 13.1.9.4. SWOT Analysis
- 13.1.1 Kawasaki Precision Machinery
- 13.2. Market Entropy
- 13.2.1 Company's Key Areas Served
- 13.2.2 Recent Developments
- 13.3. Company Market Share Analysis 2025
- 13.3.1 Top 5 Companies Market Share Analysis
- 13.3.2 Top 3 Companies Market Share Analysis
- 13.4. List of Potential Customers
- 14. Research Methodology
List of Figures
- Figure 1: Global Fluid Power Equipment Market In Mobile Equipment Revenue Breakdown (Million, %) by Region 2025 & 2033
- Figure 2: Global Fluid Power Equipment Market In Mobile Equipment Volume Breakdown (Billion, %) by Region 2025 & 2033
- Figure 3: North America Fluid Power Equipment Market In Mobile Equipment Revenue (Million), by Product Type 2025 & 2033
- Figure 4: North America Fluid Power Equipment Market In Mobile Equipment Volume (Billion), by Product Type 2025 & 2033
- Figure 5: North America Fluid Power Equipment Market In Mobile Equipment Revenue Share (%), by Product Type 2025 & 2033
- Figure 6: North America Fluid Power Equipment Market In Mobile Equipment Volume Share (%), by Product Type 2025 & 2033
- Figure 7: North America Fluid Power Equipment Market In Mobile Equipment Revenue (Million), by End-user Vertical 2025 & 2033
- Figure 8: North America Fluid Power Equipment Market In Mobile Equipment Volume (Billion), by End-user Vertical 2025 & 2033
- Figure 9: North America Fluid Power Equipment Market In Mobile Equipment Revenue Share (%), by End-user Vertical 2025 & 2033
- Figure 10: North America Fluid Power Equipment Market In Mobile Equipment Volume Share (%), by End-user Vertical 2025 & 2033
- Figure 11: North America Fluid Power Equipment Market In Mobile Equipment Revenue (Million), by Country 2025 & 2033
- Figure 12: North America Fluid Power Equipment Market In Mobile Equipment Volume (Billion), by Country 2025 & 2033
- Figure 13: North America Fluid Power Equipment Market In Mobile Equipment Revenue Share (%), by Country 2025 & 2033
- Figure 14: North America Fluid Power Equipment Market In Mobile Equipment Volume Share (%), by Country 2025 & 2033
- Figure 15: Asia Fluid Power Equipment Market In Mobile Equipment Revenue (Million), by Product Type 2025 & 2033
- Figure 16: Asia Fluid Power Equipment Market In Mobile Equipment Volume (Billion), by Product Type 2025 & 2033
- Figure 17: Asia Fluid Power Equipment Market In Mobile Equipment Revenue Share (%), by Product Type 2025 & 2033
- Figure 18: Asia Fluid Power Equipment Market In Mobile Equipment Volume Share (%), by Product Type 2025 & 2033
- Figure 19: Asia Fluid Power Equipment Market In Mobile Equipment Revenue (Million), by End-user Vertical 2025 & 2033
- Figure 20: Asia Fluid Power Equipment Market In Mobile Equipment Volume (Billion), by End-user Vertical 2025 & 2033
- Figure 21: Asia Fluid Power Equipment Market In Mobile Equipment Revenue Share (%), by End-user Vertical 2025 & 2033
- Figure 22: Asia Fluid Power Equipment Market In Mobile Equipment Volume Share (%), by End-user Vertical 2025 & 2033
- Figure 23: Asia Fluid Power Equipment Market In Mobile Equipment Revenue (Million), by Country 2025 & 2033
- Figure 24: Asia Fluid Power Equipment Market In Mobile Equipment Volume (Billion), by Country 2025 & 2033
- Figure 25: Asia Fluid Power Equipment Market In Mobile Equipment Revenue Share (%), by Country 2025 & 2033
- Figure 26: Asia Fluid Power Equipment Market In Mobile Equipment Volume Share (%), by Country 2025 & 2033
- Figure 27: Europe Fluid Power Equipment Market In Mobile Equipment Revenue (Million), by Product Type 2025 & 2033
- Figure 28: Europe Fluid Power Equipment Market In Mobile Equipment Volume (Billion), by Product Type 2025 & 2033
- Figure 29: Europe Fluid Power Equipment Market In Mobile Equipment Revenue Share (%), by Product Type 2025 & 2033
- Figure 30: Europe Fluid Power Equipment Market In Mobile Equipment Volume Share (%), by Product Type 2025 & 2033
- Figure 31: Europe Fluid Power Equipment Market In Mobile Equipment Revenue (Million), by End-user Vertical 2025 & 2033
- Figure 32: Europe Fluid Power Equipment Market In Mobile Equipment Volume (Billion), by End-user Vertical 2025 & 2033
- Figure 33: Europe Fluid Power Equipment Market In Mobile Equipment Revenue Share (%), by End-user Vertical 2025 & 2033
- Figure 34: Europe Fluid Power Equipment Market In Mobile Equipment Volume Share (%), by End-user Vertical 2025 & 2033
- Figure 35: Europe Fluid Power Equipment Market In Mobile Equipment Revenue (Million), by Country 2025 & 2033
- Figure 36: Europe Fluid Power Equipment Market In Mobile Equipment Volume (Billion), by Country 2025 & 2033
- Figure 37: Europe Fluid Power Equipment Market In Mobile Equipment Revenue Share (%), by Country 2025 & 2033
- Figure 38: Europe Fluid Power Equipment Market In Mobile Equipment Volume Share (%), by Country 2025 & 2033
- Figure 39: Latin America Fluid Power Equipment Market In Mobile Equipment Revenue (Million), by Product Type 2025 & 2033
- Figure 40: Latin America Fluid Power Equipment Market In Mobile Equipment Volume (Billion), by Product Type 2025 & 2033
- Figure 41: Latin America Fluid Power Equipment Market In Mobile Equipment Revenue Share (%), by Product Type 2025 & 2033
- Figure 42: Latin America Fluid Power Equipment Market In Mobile Equipment Volume Share (%), by Product Type 2025 & 2033
- Figure 43: Latin America Fluid Power Equipment Market In Mobile Equipment Revenue (Million), by End-user Vertical 2025 & 2033
- Figure 44: Latin America Fluid Power Equipment Market In Mobile Equipment Volume (Billion), by End-user Vertical 2025 & 2033
- Figure 45: Latin America Fluid Power Equipment Market In Mobile Equipment Revenue Share (%), by End-user Vertical 2025 & 2033
- Figure 46: Latin America Fluid Power Equipment Market In Mobile Equipment Volume Share (%), by End-user Vertical 2025 & 2033
- Figure 47: Latin America Fluid Power Equipment Market In Mobile Equipment Revenue (Million), by Country 2025 & 2033
- Figure 48: Latin America Fluid Power Equipment Market In Mobile Equipment Volume (Billion), by Country 2025 & 2033
- Figure 49: Latin America Fluid Power Equipment Market In Mobile Equipment Revenue Share (%), by Country 2025 & 2033
- Figure 50: Latin America Fluid Power Equipment Market In Mobile Equipment Volume Share (%), by Country 2025 & 2033
- Figure 51: Middle East and Africa Fluid Power Equipment Market In Mobile Equipment Revenue (Million), by Product Type 2025 & 2033
- Figure 52: Middle East and Africa Fluid Power Equipment Market In Mobile Equipment Volume (Billion), by Product Type 2025 & 2033
- Figure 53: Middle East and Africa Fluid Power Equipment Market In Mobile Equipment Revenue Share (%), by Product Type 2025 & 2033
- Figure 54: Middle East and Africa Fluid Power Equipment Market In Mobile Equipment Volume Share (%), by Product Type 2025 & 2033
- Figure 55: Middle East and Africa Fluid Power Equipment Market In Mobile Equipment Revenue (Million), by End-user Vertical 2025 & 2033
- Figure 56: Middle East and Africa Fluid Power Equipment Market In Mobile Equipment Volume (Billion), by End-user Vertical 2025 & 2033
- Figure 57: Middle East and Africa Fluid Power Equipment Market In Mobile Equipment Revenue Share (%), by End-user Vertical 2025 & 2033
- Figure 58: Middle East and Africa Fluid Power Equipment Market In Mobile Equipment Volume Share (%), by End-user Vertical 2025 & 2033
- Figure 59: Middle East and Africa Fluid Power Equipment Market In Mobile Equipment Revenue (Million), by Country 2025 & 2033
- Figure 60: Middle East and Africa Fluid Power Equipment Market In Mobile Equipment Volume (Billion), by Country 2025 & 2033
- Figure 61: Middle East and Africa Fluid Power Equipment Market In Mobile Equipment Revenue Share (%), by Country 2025 & 2033
- Figure 62: Middle East and Africa Fluid Power Equipment Market In Mobile Equipment Volume Share (%), by Country 2025 & 2033
- Figure 63: Australia and New Zealand Fluid Power Equipment Market In Mobile Equipment Revenue (Million), by Product Type 2025 & 2033
- Figure 64: Australia and New Zealand Fluid Power Equipment Market In Mobile Equipment Volume (Billion), by Product Type 2025 & 2033
- Figure 65: Australia and New Zealand Fluid Power Equipment Market In Mobile Equipment Revenue Share (%), by Product Type 2025 & 2033
- Figure 66: Australia and New Zealand Fluid Power Equipment Market In Mobile Equipment Volume Share (%), by Product Type 2025 & 2033
- Figure 67: Australia and New Zealand Fluid Power Equipment Market In Mobile Equipment Revenue (Million), by End-user Vertical 2025 & 2033
- Figure 68: Australia and New Zealand Fluid Power Equipment Market In Mobile Equipment Volume (Billion), by End-user Vertical 2025 & 2033
- Figure 69: Australia and New Zealand Fluid Power Equipment Market In Mobile Equipment Revenue Share (%), by End-user Vertical 2025 & 2033
- Figure 70: Australia and New Zealand Fluid Power Equipment Market In Mobile Equipment Volume Share (%), by End-user Vertical 2025 & 2033
- Figure 71: Australia and New Zealand Fluid Power Equipment Market In Mobile Equipment Revenue (Million), by Country 2025 & 2033
- Figure 72: Australia and New Zealand Fluid Power Equipment Market In Mobile Equipment Volume (Billion), by Country 2025 & 2033
- Figure 73: Australia and New Zealand Fluid Power Equipment Market In Mobile Equipment Revenue Share (%), by Country 2025 & 2033
- Figure 74: Australia and New Zealand Fluid Power Equipment Market In Mobile Equipment Volume Share (%), by Country 2025 & 2033
List of Tables
- Table 1: Global Fluid Power Equipment Market In Mobile Equipment Revenue Million Forecast, by Product Type 2020 & 2033
- Table 2: Global Fluid Power Equipment Market In Mobile Equipment Volume Billion Forecast, by Product Type 2020 & 2033
- Table 3: Global Fluid Power Equipment Market In Mobile Equipment Revenue Million Forecast, by End-user Vertical 2020 & 2033
- Table 4: Global Fluid Power Equipment Market In Mobile Equipment Volume Billion Forecast, by End-user Vertical 2020 & 2033
- Table 5: Global Fluid Power Equipment Market In Mobile Equipment Revenue Million Forecast, by Region 2020 & 2033
- Table 6: Global Fluid Power Equipment Market In Mobile Equipment Volume Billion Forecast, by Region 2020 & 2033
- Table 7: Global Fluid Power Equipment Market In Mobile Equipment Revenue Million Forecast, by Product Type 2020 & 2033
- Table 8: Global Fluid Power Equipment Market In Mobile Equipment Volume Billion Forecast, by Product Type 2020 & 2033
- Table 9: Global Fluid Power Equipment Market In Mobile Equipment Revenue Million Forecast, by End-user Vertical 2020 & 2033
- Table 10: Global Fluid Power Equipment Market In Mobile Equipment Volume Billion Forecast, by End-user Vertical 2020 & 2033
- Table 11: Global Fluid Power Equipment Market In Mobile Equipment Revenue Million Forecast, by Country 2020 & 2033
- Table 12: Global Fluid Power Equipment Market In Mobile Equipment Volume Billion Forecast, by Country 2020 & 2033
- Table 13: Global Fluid Power Equipment Market In Mobile Equipment Revenue Million Forecast, by Product Type 2020 & 2033
- Table 14: Global Fluid Power Equipment Market In Mobile Equipment Volume Billion Forecast, by Product Type 2020 & 2033
- Table 15: Global Fluid Power Equipment Market In Mobile Equipment Revenue Million Forecast, by End-user Vertical 2020 & 2033
- Table 16: Global Fluid Power Equipment Market In Mobile Equipment Volume Billion Forecast, by End-user Vertical 2020 & 2033
- Table 17: Global Fluid Power Equipment Market In Mobile Equipment Revenue Million Forecast, by Country 2020 & 2033
- Table 18: Global Fluid Power Equipment Market In Mobile Equipment Volume Billion Forecast, by Country 2020 & 2033
- Table 19: Global Fluid Power Equipment Market In Mobile Equipment Revenue Million Forecast, by Product Type 2020 & 2033
- Table 20: Global Fluid Power Equipment Market In Mobile Equipment Volume Billion Forecast, by Product Type 2020 & 2033
- Table 21: Global Fluid Power Equipment Market In Mobile Equipment Revenue Million Forecast, by End-user Vertical 2020 & 2033
- Table 22: Global Fluid Power Equipment Market In Mobile Equipment Volume Billion Forecast, by End-user Vertical 2020 & 2033
- Table 23: Global Fluid Power Equipment Market In Mobile Equipment Revenue Million Forecast, by Country 2020 & 2033
- Table 24: Global Fluid Power Equipment Market In Mobile Equipment Volume Billion Forecast, by Country 2020 & 2033
- Table 25: Global Fluid Power Equipment Market In Mobile Equipment Revenue Million Forecast, by Product Type 2020 & 2033
- Table 26: Global Fluid Power Equipment Market In Mobile Equipment Volume Billion Forecast, by Product Type 2020 & 2033
- Table 27: Global Fluid Power Equipment Market In Mobile Equipment Revenue Million Forecast, by End-user Vertical 2020 & 2033
- Table 28: Global Fluid Power Equipment Market In Mobile Equipment Volume Billion Forecast, by End-user Vertical 2020 & 2033
- Table 29: Global Fluid Power Equipment Market In Mobile Equipment Revenue Million Forecast, by Country 2020 & 2033
- Table 30: Global Fluid Power Equipment Market In Mobile Equipment Volume Billion Forecast, by Country 2020 & 2033
- Table 31: Global Fluid Power Equipment Market In Mobile Equipment Revenue Million Forecast, by Product Type 2020 & 2033
- Table 32: Global Fluid Power Equipment Market In Mobile Equipment Volume Billion Forecast, by Product Type 2020 & 2033
- Table 33: Global Fluid Power Equipment Market In Mobile Equipment Revenue Million Forecast, by End-user Vertical 2020 & 2033
- Table 34: Global Fluid Power Equipment Market In Mobile Equipment Volume Billion Forecast, by End-user Vertical 2020 & 2033
- Table 35: Global Fluid Power Equipment Market In Mobile Equipment Revenue Million Forecast, by Country 2020 & 2033
- Table 36: Global Fluid Power Equipment Market In Mobile Equipment Volume Billion Forecast, by Country 2020 & 2033
- Table 37: Global Fluid Power Equipment Market In Mobile Equipment Revenue Million Forecast, by Product Type 2020 & 2033
- Table 38: Global Fluid Power Equipment Market In Mobile Equipment Volume Billion Forecast, by Product Type 2020 & 2033
- Table 39: Global Fluid Power Equipment Market In Mobile Equipment Revenue Million Forecast, by End-user Vertical 2020 & 2033
- Table 40: Global Fluid Power Equipment Market In Mobile Equipment Volume Billion Forecast, by End-user Vertical 2020 & 2033
- Table 41: Global Fluid Power Equipment Market In Mobile Equipment Revenue Million Forecast, by Country 2020 & 2033
- Table 42: Global Fluid Power Equipment Market In Mobile Equipment Volume Billion Forecast, by Country 2020 & 2033
Frequently Asked Questions
1. What is the projected Compound Annual Growth Rate (CAGR) of the Fluid Power Equipment Market In Mobile Equipment?
The projected CAGR is approximately 6.60%.
2. Which companies are prominent players in the Fluid Power Equipment Market In Mobile Equipment?
Key companies in the market include Kawasaki Precision Machinery, Bosch-Rexroth AG, Parker Hannifin Corporation, Danfoss AS, Eaton Corporation, Hydac International GmbH, HydraForce Inc, Festo Corporation, SMC Corporation*List Not Exhaustive 7 2 Vendor Ranking Analysi.
3. What are the main segments of the Fluid Power Equipment Market In Mobile Equipment?
The market segments include Product Type, End-user Vertical.
4. Can you provide details about the market size?
The market size is estimated to be USD 28.91 Million as of 2022.
5. What are some drivers contributing to market growth?
Growing Construction and Infrastructure Development; Growing Need for Increased Efficiency and Productivity; Increasing Advancements in Technology.
6. What are the notable trends driving market growth?
The Construction Segment is Expected to Drive the Market's Growth.
7. Are there any restraints impacting market growth?
Growing Construction and Infrastructure Development; Growing Need for Increased Efficiency and Productivity; Increasing Advancements in Technology.
8. Can you provide examples of recent developments in the market?
February 2024: Power management company Eaton announced that its Mobility Group is expanding its mobile power products portfolio with the introduction of the Bezares 3960, 2500, and 500 series power takeoff (PTO) units, as well as APSCO APV and APG series directional hydraulic control valves. The new offerings are expected to be introduced at the Work Truck Show, March 5-8 in Indianapolis.July 2023: Bosch Rexroth opened a new plant in Querétaro, Mexico, with a vision to create more manufacturing capacity for mobile hydraulics and factory automation in North America and shorten delivery routes for customers in the region. The company claimed that it is investing about EUR 160 million in the new location and would create about 900 jobs by 2027. At its 42,000-square-meter, or 452,000-square-foot, plant in Querétaro, the company began manufacturing hydraulic pumps, motors, and valves for mobile machinery, like excavators, forklifts, and tractors, in June 2023.
9. What pricing options are available for accessing the report?
Pricing options include single-user, multi-user, and enterprise licenses priced at USD 4750, USD 5250, and USD 8750 respectively.
10. Is the market size provided in terms of value or volume?
The market size is provided in terms of value, measured in Million and volume, measured in Billion.
11. Are there any specific market keywords associated with the report?
Yes, the market keyword associated with the report is "Fluid Power Equipment Market In Mobile Equipment," which aids in identifying and referencing the specific market segment covered.
12. How do I determine which pricing option suits my needs best?
The pricing options vary based on user requirements and access needs. Individual users may opt for single-user licenses, while businesses requiring broader access may choose multi-user or enterprise licenses for cost-effective access to the report.
13. Are there any additional resources or data provided in the Fluid Power Equipment Market In Mobile Equipment report?
While the report offers comprehensive insights, it's advisable to review the specific contents or supplementary materials provided to ascertain if additional resources or data are available.
14. How can I stay updated on further developments or reports in the Fluid Power Equipment Market In Mobile Equipment?
To stay informed about further developments, trends, and reports in the Fluid Power Equipment Market In Mobile Equipment, consider subscribing to industry newsletters, following relevant companies and organizations, or regularly checking reputable industry news sources and publications.
Methodology
Step 1 - Identification of Relevant Samples Size from Population Database


Step 2 - Approaches for Defining Global Market Size (Value, Volume* & Price*)

Note*: In applicable scenarios
Step 3 - Data Sources
Primary Research
- Web Analytics
- Survey Reports
- Research Institute
- Latest Research Reports
- Opinion Leaders
Secondary Research
- Annual Reports
- White Paper
- Latest Press Release
- Industry Association
- Paid Database
- Investor Presentations

Step 4 - Data Triangulation
Involves using different sources of information in order to increase the validity of a study
These sources are likely to be stakeholders in a program - participants, other researchers, program staff, other community members, and so on.
Then we put all data in single framework & apply various statistical tools to find out the dynamic on the market.
During the analysis stage, feedback from the stakeholder groups would be compared to determine areas of agreement as well as areas of divergence