

Key Insights
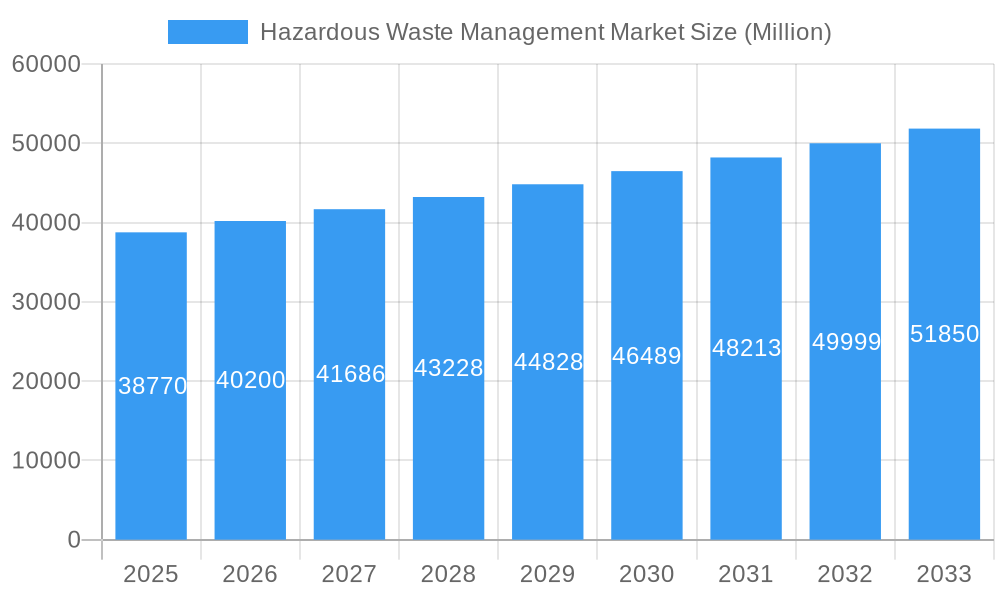
The Hazardous Waste Management market, valued at $38.77 billion in 2025, is projected to experience steady growth, driven by stringent environmental regulations globally and the increasing generation of hazardous waste from industrial activities. A compound annual growth rate (CAGR) of 3.74% from 2025 to 2033 indicates a significant expansion of this market over the forecast period. Key drivers include the growing awareness of environmental protection, rising industrialization and urbanization leading to increased waste generation, and the need for responsible waste disposal to mitigate environmental risks. Technological advancements in waste treatment and recycling technologies are also contributing factors, enabling more efficient and sustainable waste management practices. Market restraints could include the high capital investment required for waste management infrastructure and the potential for regulatory changes impacting operational costs. The market is segmented by waste type (e.g., chemical, biological, radioactive), treatment method (e.g., incineration, landfilling, recycling), and geographic region. Major players like Suez, Veolia, Waste Management, and Republic Services dominate the market, leveraging their established infrastructure and expertise. Competition is expected to intensify as smaller players and new technologies enter the market, fostering innovation and driving efficiency improvements.
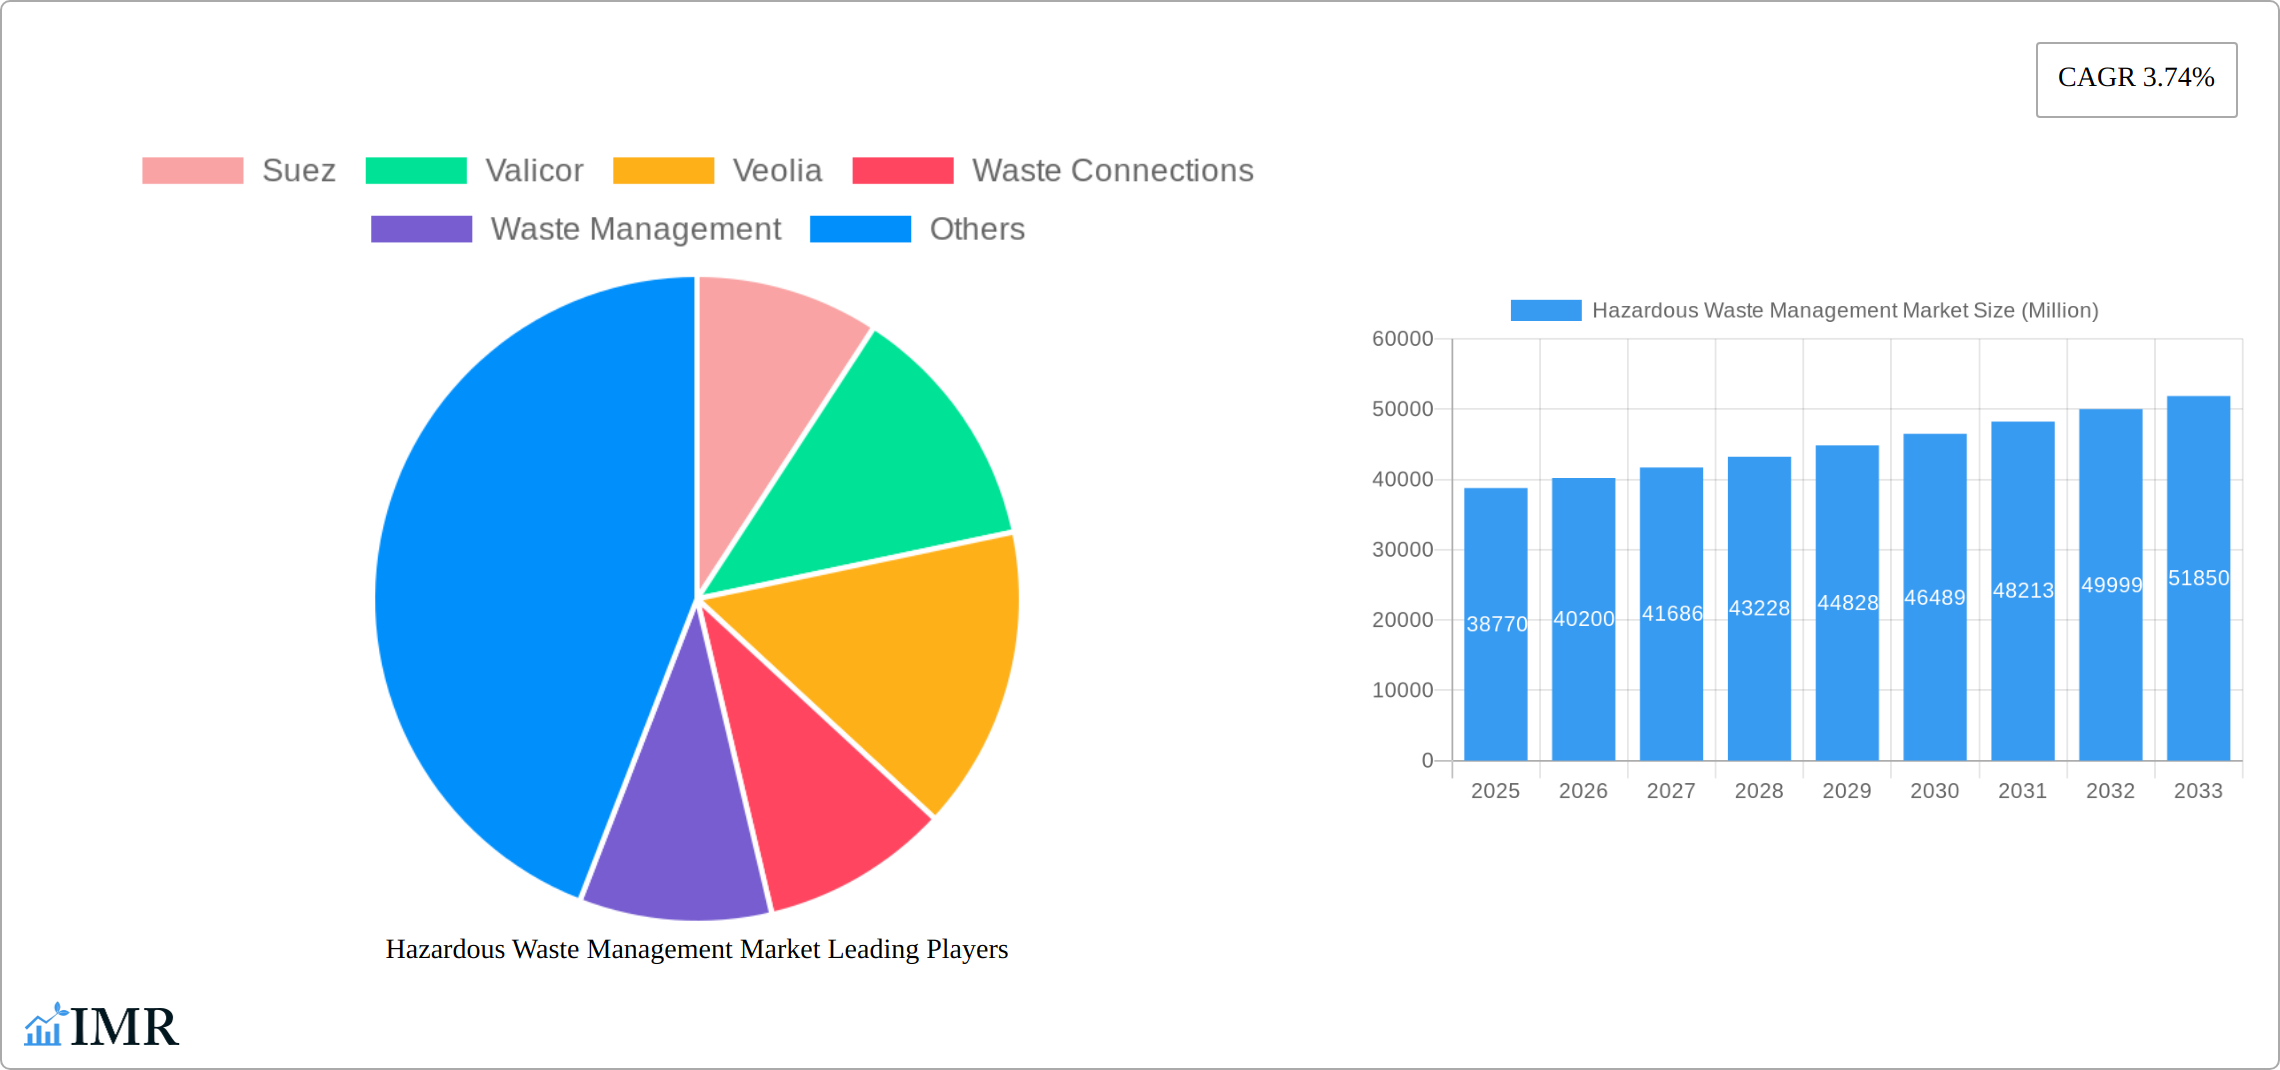
Hazardous Waste Management Market Market Size (In Billion)
The projected growth in the Hazardous Waste Management market is further fueled by the increasing adoption of sustainable practices across industries. Companies are facing greater pressure to minimize their environmental footprint, leading to a heightened demand for efficient and eco-friendly hazardous waste management solutions. Furthermore, government initiatives promoting circular economy principles and stricter enforcement of environmental compliance regulations are boosting the market's expansion. While regional variations exist, North America and Europe are likely to hold significant market shares due to their advanced waste management infrastructure and stringent environmental regulations. However, emerging economies in Asia-Pacific and Latin America also present substantial growth opportunities due to increasing industrialization and rising environmental awareness. The market's future trajectory will depend on the effectiveness of government policies, technological innovation, and the adoption of sustainable practices by businesses across various sectors.
Hazardous Waste Management Market Company Market Share
Hazardous Waste Management Market: A Comprehensive Market Report (2019-2033)
This comprehensive report provides a detailed analysis of the Hazardous Waste Management Market, encompassing market dynamics, growth trends, regional insights, and key player strategies. The study period covers 2019-2033, with a focus on the base year 2025 and a forecast period of 2025-2033. This report is essential for industry professionals, investors, and stakeholders seeking a deep understanding of this crucial sector. The total market size is estimated at xx Million in 2025, expected to reach xx Million by 2033.
Hazardous Waste Management Market Market Dynamics & Structure
The Hazardous Waste Management Market exhibits a moderately concentrated structure, with established industry leaders such as Suez, Veolia, Waste Management, and Republic Services commanding a significant share. The market's trajectory is fundamentally shaped by a confluence of factors: increasingly stringent environmental regulations worldwide, continuous technological advancements in waste treatment and disposal methodologies, escalating industrial activities that inherently generate hazardous waste, and a burgeoning global consciousness towards environmental sustainability. Mergers and acquisitions (M&A) continue to be a prominent feature, with [Insert Number] significant deals observed over the past five years, further consolidating the competitive landscape.
- Market Concentration: The leading five entities are estimated to hold approximately [Insert Percentage] of the global market share in 2025, underscoring a degree of market concentration.
- Technological Innovation: Pioneering advancements in waste-to-energy technologies, sophisticated bioremediation techniques, and cutting-edge recycling processes are acting as potent catalysts for market expansion. However, substantial initial investment requirements and the need for highly specialized technical expertise represent notable barriers to entry and wider adoption.
- Regulatory Framework: The complexity and stringency of environmental regulations, alongside compliance costs, exhibit considerable regional variations, significantly influencing market dynamics and strategic investment decisions. The progressive implementation of Extended Producer Responsibility (EPR) schemes across various jurisdictions stands out as a particularly impactful market driver.
- Competitive Product Substitutes: The availability of truly viable substitutes for comprehensive hazardous waste management services is inherently limited, contributing to a relatively stable and well-defined market structure.
- End-User Demographics: Key sectors such as manufacturing, healthcare, and the chemical industry are the primary generators of hazardous waste, positioning them as critical end-users. The sustained growth and expansion of these industries are directly correlated with and influence overall market demand.
- M&A Trends: Strategic consolidation through mergers and acquisitions remains a dominant trend, enabling companies to broaden their service portfolios, enhance their operational capabilities, and expand their geographical footprint.
Hazardous Waste Management Market Growth Trends & Insights
The Hazardous Waste Management Market is currently experiencing a period of robust and sustained growth, propelled by a multifaceted array of driving forces. Stringent global environmental regulations are increasingly mandating the adoption of more efficient, sustainable, and responsible waste management practices. Concurrently, the escalating volume of hazardous waste generated by expanding industrial activities across diverse sectors significantly fuels market expansion. Technological breakthroughs in waste treatment, recycling, and resource recovery are not only enhancing operational efficiencies but also demonstrably reducing the environmental footprint of these operations. Furthermore, heightened consumer awareness and an amplified demand for environmentally sound waste disposal solutions are playing an increasingly pivotal role in shaping market demand.
The market is projected to witness a Compound Annual Growth Rate (CAGR) of approximately [Insert Percentage] during the forecast period spanning 2025-2033. Current market penetration is estimated at [Insert Percentage], with an anticipated increase to [Insert Percentage] by the year 2033. Technological disruptions, including the integration of AI-powered waste sorting systems and fully automated treatment infrastructure, are accelerating adoption rates and optimizing operational efficiencies. Evolving consumer behavior, characterized by a pronounced preference for eco-friendly waste disposal methods and a growing emphasis on corporate social responsibility, further bolsters market growth prospects.
Dominant Regions, Countries, or Segments in Hazardous Waste Management Market
North America and Europe currently dominate the Hazardous Waste Management Market due to stringent environmental regulations, robust infrastructure, and high industrial activity. However, Asia-Pacific is projected to experience significant growth in the coming years, driven by rapid industrialization and increasing government initiatives to improve waste management practices.
- North America: Stringent regulatory frameworks and high industrial output contribute to high market demand.
- Europe: Mature market with established infrastructure and advanced waste management technologies.
- Asia-Pacific: Rapid industrialization and increasing government investments drive significant growth potential.
- Key Drivers: Strong government regulations, increasing industrial output, and rising environmental awareness.
Hazardous Waste Management Market Product Landscape
The Hazardous Waste Management Market is characterized by a comprehensive and diverse array of services, encompassing critical aspects such as waste collection, secure transportation, advanced treatment, responsible disposal, and innovative recycling solutions. Significant product innovations are emerging, including the development of state-of-the-art waste-to-energy technologies, advanced bioremediation solutions that leverage natural processes, and sophisticated automated waste sorting systems designed for enhanced precision and efficiency. These innovations collectively contribute to improved operational effectiveness, a minimized environmental impact, and elevated safety standards throughout the waste management lifecycle. Key performance indicators for success in this market revolve around achieving high waste reduction rates, maximizing energy recovery efficiency from waste streams, and ensuring unwavering compliance with all applicable environmental regulations. Differentiating factors and unique selling propositions for market players often center on the adoption of advanced technology, demonstrable operational efficiency, and a strong commitment to sustainability.
Key Drivers, Barriers & Challenges in Hazardous Waste Management Market
Key Drivers:
- Stringent environmental regulations and compliance mandates.
- Increasing generation of hazardous waste from industrial activities.
- Technological advancements enhancing efficiency and safety.
- Growing awareness of environmental sustainability among consumers and businesses.
Key Challenges and Restraints:
- High capital investment costs for advanced treatment technologies.
- Complex regulatory landscapes and compliance challenges.
- Supply chain disruptions impacting waste collection and transportation.
- Competition from smaller, localized waste management companies. This competition reduces profitability, particularly for larger companies working across wider geographical locations. For example, the market share of smaller companies might currently be 15% but expected to increase to 20% by 2033.
Emerging Opportunities in Hazardous Waste Management Market
- Untapped markets in developing economies with growing industrial sectors.
- Innovative applications of waste-to-energy and recycling technologies.
- Increased demand for sustainable and environmentally friendly waste management solutions.
- Growth in the circular economy and increased focus on resource recovery.
Growth Accelerators in the Hazardous Waste Management Market Industry
Technological advancements, particularly in waste-to-energy and advanced recycling, are significant growth catalysts. Strategic partnerships and collaborations between waste management companies and technology providers are accelerating innovation. Expansion into emerging markets with high growth potential is another key strategy. Government support through financial incentives and regulatory frameworks further supports market growth.
Key Players Shaping the Hazardous Waste Management Market Market
- Suez
- Valicor
- Veolia
- Waste Connections
- Waste Management
- Republic Services
- Biffa
- Clean Harbors
- Covanta Holding
- Daiseki
- Hitachi Zosen
- Remondis SE & Co Kg
- Urbaser
- Biomedical Solutions
- 63 Other Companies
Notable Milestones in Hazardous Waste Management Market Sector
- February 2024: Waste Management (WM) unveiled strategic plans to significantly expand its operational footprint by establishing three new advanced recycling facilities across North America. This initiative is slated to enhance the company's recycling capacity by an impressive 1 million metric tons annually by 2026, underscoring a commitment to circular economy principles.
- April 2024: China Everbright Environment Group Limited successfully commissioned its Hue Waste-to-Energy Project in Vietnam. The project's inauguration was graced by the presence of the Vietnamese Prime Minister, highlighting the strategic importance and governmental support for such sustainable energy and waste management initiatives in the region.
In-Depth Hazardous Waste Management Market Market Outlook
The Hazardous Waste Management Market is strategically positioned for sustained and significant growth in the foreseeable future. This positive trajectory is underpinned by continuous technological advancements, a deepening global environmental consciousness, and the ever-present influence of stringent regulatory frameworks. Success within this dynamic market will hinge on the ability of companies to forge strategic partnerships, channel investments into pioneering innovations, and effectively expand their presence into burgeoning emerging markets. The market presents substantial opportunities for organizations that can consistently deliver efficient, sustainable, and economically viable waste management solutions. The long-term outlook for the Hazardous Waste Management Market remains exceptionally positive, with considerable potential for extensive market expansion and significant value creation for stakeholders.
Hazardous Waste Management Market Segmentation
-
1. Type
- 1.1. Solid
- 1.2. Liquid
- 1.3. Sludge
-
2. Waste
- 2.1. Chemicals
- 2.2. Biomedical
- 2.3. Radioactive
- 2.4. Other Waste (Corrosive, Flammable, etc.)
Hazardous Waste Management Market Segmentation By Geography
-
1. North America
- 1.1. United States
- 1.2. Canada
-
2. Europe
- 2.1. Germany
- 2.2. United Kingdom
- 2.3. France
- 2.4. Russia
- 2.5. Spain
- 2.6. Rest of Europe
-
3. Asia Pacific
- 3.1. India
- 3.2. China
- 3.3. Japan
- 3.4. Rest of Asia Pacific
-
4. Middle East and Africa
- 4.1. United Arab Emirates
- 4.2. Saudi Arabia
- 4.3. Rest of Middle East
-
5. South America
- 5.1. Brazil
- 5.2. Argentina
- 5.3. Rest of South America

Hazardous Waste Management Market Regional Market Share
Geographic Coverage of Hazardous Waste Management Market
Hazardous Waste Management Market REPORT HIGHLIGHTS
| Aspects | Details |
|---|---|
| Study Period | 2020-2034 |
| Base Year | 2025 |
| Estimated Year | 2026 |
| Forecast Period | 2026-2034 |
| Historical Period | 2020-2025 |
| Growth Rate | CAGR of 3.74% from 2020-2034 |
| Segmentation |
|
Table of Contents
- 1. Introduction
- 1.1. Research Scope
- 1.2. Market Segmentation
- 1.3. Research Objective
- 1.4. Definitions and Assumptions
- 2. Executive Summary
- 2.1. Market Snapshot
- 3. Market Dynamics
- 3.1. Market Drivers
- 3.2. Market Restrains
- 3.3. Market Trends
- 3.4. Market Opportunities
- 4. Market Factor Analysis
- 4.1. Porters Five Forces
- 4.1.1. Bargaining Power of Suppliers
- 4.1.2. Bargaining Power of Buyers
- 4.1.3. Threat of New Entrants
- 4.1.4. Threat of Substitutes
- 4.1.5. Competitive Rivalry
- 4.2. PESTEL analysis
- 4.3. BCG Analysis
- 4.3.1. Stars (High Growth, High Market Share)
- 4.3.2. Cash Cows (Low Growth, High Market Share)
- 4.3.3. Question Mark (High Growth, Low Market Share)
- 4.3.4. Dogs (Low Growth, Low Market Share)
- 4.4. Ansoff Matrix Analysis
- 4.5. Supply Chain Analysis
- 4.6. Regulatory Landscape
- 4.7. Current Market Potential and Opportunity Assessment (TAM–SAM–SOM Framework)
- 4.8. IMR Analyst Note
- 4.1. Porters Five Forces
- 5. Market Analysis, Insights and Forecast 2021-2033
- 5.1. Market Analysis, Insights and Forecast - by Type
- 5.1.1. Solid
- 5.1.2. Liquid
- 5.1.3. Sludge
- 5.2. Market Analysis, Insights and Forecast - by Waste
- 5.2.1. Chemicals
- 5.2.2. Biomedical
- 5.2.3. Radioactive
- 5.2.4. Other Waste (Corrosive, Flammable, etc.)
- 5.3. Market Analysis, Insights and Forecast - by Region
- 5.3.1. North America
- 5.3.2. Europe
- 5.3.3. Asia Pacific
- 5.3.4. Middle East and Africa
- 5.3.5. South America
- 5.1. Market Analysis, Insights and Forecast - by Type
- 6. Global Hazardous Waste Management Market Analysis, Insights and Forecast, 2021-2033
- 6.1. Market Analysis, Insights and Forecast - by Type
- 6.1.1. Solid
- 6.1.2. Liquid
- 6.1.3. Sludge
- 6.2. Market Analysis, Insights and Forecast - by Waste
- 6.2.1. Chemicals
- 6.2.2. Biomedical
- 6.2.3. Radioactive
- 6.2.4. Other Waste (Corrosive, Flammable, etc.)
- 6.1. Market Analysis, Insights and Forecast - by Type
- 7. North America Hazardous Waste Management Market Analysis, Insights and Forecast, 2020-2032
- 7.1. Market Analysis, Insights and Forecast - by Type
- 7.1.1. Solid
- 7.1.2. Liquid
- 7.1.3. Sludge
- 7.2. Market Analysis, Insights and Forecast - by Waste
- 7.2.1. Chemicals
- 7.2.2. Biomedical
- 7.2.3. Radioactive
- 7.2.4. Other Waste (Corrosive, Flammable, etc.)
- 7.1. Market Analysis, Insights and Forecast - by Type
- 8. Europe Hazardous Waste Management Market Analysis, Insights and Forecast, 2020-2032
- 8.1. Market Analysis, Insights and Forecast - by Type
- 8.1.1. Solid
- 8.1.2. Liquid
- 8.1.3. Sludge
- 8.2. Market Analysis, Insights and Forecast - by Waste
- 8.2.1. Chemicals
- 8.2.2. Biomedical
- 8.2.3. Radioactive
- 8.2.4. Other Waste (Corrosive, Flammable, etc.)
- 8.1. Market Analysis, Insights and Forecast - by Type
- 9. Asia Pacific Hazardous Waste Management Market Analysis, Insights and Forecast, 2020-2032
- 9.1. Market Analysis, Insights and Forecast - by Type
- 9.1.1. Solid
- 9.1.2. Liquid
- 9.1.3. Sludge
- 9.2. Market Analysis, Insights and Forecast - by Waste
- 9.2.1. Chemicals
- 9.2.2. Biomedical
- 9.2.3. Radioactive
- 9.2.4. Other Waste (Corrosive, Flammable, etc.)
- 9.1. Market Analysis, Insights and Forecast - by Type
- 10. Middle East and Africa Hazardous Waste Management Market Analysis, Insights and Forecast, 2020-2032
- 10.1. Market Analysis, Insights and Forecast - by Type
- 10.1.1. Solid
- 10.1.2. Liquid
- 10.1.3. Sludge
- 10.2. Market Analysis, Insights and Forecast - by Waste
- 10.2.1. Chemicals
- 10.2.2. Biomedical
- 10.2.3. Radioactive
- 10.2.4. Other Waste (Corrosive, Flammable, etc.)
- 10.1. Market Analysis, Insights and Forecast - by Type
- 11. South America Hazardous Waste Management Market Analysis, Insights and Forecast, 2020-2032
- 11.1. Market Analysis, Insights and Forecast - by Type
- 11.1.1. Solid
- 11.1.2. Liquid
- 11.1.3. Sludge
- 11.2. Market Analysis, Insights and Forecast - by Waste
- 11.2.1. Chemicals
- 11.2.2. Biomedical
- 11.2.3. Radioactive
- 11.2.4. Other Waste (Corrosive, Flammable, etc.)
- 11.1. Market Analysis, Insights and Forecast - by Type
- 12. Competitive Analysis
- 12.1. Company Profiles
- 12.1.1 Suez
- 12.1.1.1. Company Overview
- 12.1.1.2. Products
- 12.1.1.3. Company Financials
- 12.1.1.4. SWOT Analysis
- 12.1.2 Valicor
- 12.1.2.1. Company Overview
- 12.1.2.2. Products
- 12.1.2.3. Company Financials
- 12.1.2.4. SWOT Analysis
- 12.1.3 Veolia
- 12.1.3.1. Company Overview
- 12.1.3.2. Products
- 12.1.3.3. Company Financials
- 12.1.3.4. SWOT Analysis
- 12.1.4 Waste Connections
- 12.1.4.1. Company Overview
- 12.1.4.2. Products
- 12.1.4.3. Company Financials
- 12.1.4.4. SWOT Analysis
- 12.1.5 Waste Management
- 12.1.5.1. Company Overview
- 12.1.5.2. Products
- 12.1.5.3. Company Financials
- 12.1.5.4. SWOT Analysis
- 12.1.6 Republic Services
- 12.1.6.1. Company Overview
- 12.1.6.2. Products
- 12.1.6.3. Company Financials
- 12.1.6.4. SWOT Analysis
- 12.1.7 Biffa
- 12.1.7.1. Company Overview
- 12.1.7.2. Products
- 12.1.7.3. Company Financials
- 12.1.7.4. SWOT Analysis
- 12.1.8 Clean Harbors
- 12.1.8.1. Company Overview
- 12.1.8.2. Products
- 12.1.8.3. Company Financials
- 12.1.8.4. SWOT Analysis
- 12.1.9 Covanta Holding
- 12.1.9.1. Company Overview
- 12.1.9.2. Products
- 12.1.9.3. Company Financials
- 12.1.9.4. SWOT Analysis
- 12.1.10 Daiseki
- 12.1.10.1. Company Overview
- 12.1.10.2. Products
- 12.1.10.3. Company Financials
- 12.1.10.4. SWOT Analysis
- 12.1.11 Hitachi Zosen
- 12.1.11.1. Company Overview
- 12.1.11.2. Products
- 12.1.11.3. Company Financials
- 12.1.11.4. SWOT Analysis
- 12.1.12 Remondis SE & Co Kg
- 12.1.12.1. Company Overview
- 12.1.12.2. Products
- 12.1.12.3. Company Financials
- 12.1.12.4. SWOT Analysis
- 12.1.13 Urbaser
- 12.1.13.1. Company Overview
- 12.1.13.2. Products
- 12.1.13.3. Company Financials
- 12.1.13.4. SWOT Analysis
- 12.1.14 Biomedical Solutions*List Not Exhaustive 6 3 Other Companie
- 12.1.14.1. Company Overview
- 12.1.14.2. Products
- 12.1.14.3. Company Financials
- 12.1.14.4. SWOT Analysis
- 12.1.1 Suez
- 12.2. Market Entropy
- 12.2.1 Company's Key Areas Served
- 12.2.2 Recent Developments
- 12.3. Company Market Share Analysis 2025
- 12.3.1 Top 5 Companies Market Share Analysis
- 12.3.2 Top 3 Companies Market Share Analysis
- 12.4. List of Potential Customers
- 13. Research Methodology
List of Figures
- Figure 1: Global Hazardous Waste Management Market Revenue Breakdown (Million, %) by Region 2025 & 2033
- Figure 2: Global Hazardous Waste Management Market Volume Breakdown (Billion, %) by Region 2025 & 2033
- Figure 3: North America Hazardous Waste Management Market Revenue (Million), by Type 2025 & 2033
- Figure 4: North America Hazardous Waste Management Market Volume (Billion), by Type 2025 & 2033
- Figure 5: North America Hazardous Waste Management Market Revenue Share (%), by Type 2025 & 2033
- Figure 6: North America Hazardous Waste Management Market Volume Share (%), by Type 2025 & 2033
- Figure 7: North America Hazardous Waste Management Market Revenue (Million), by Waste 2025 & 2033
- Figure 8: North America Hazardous Waste Management Market Volume (Billion), by Waste 2025 & 2033
- Figure 9: North America Hazardous Waste Management Market Revenue Share (%), by Waste 2025 & 2033
- Figure 10: North America Hazardous Waste Management Market Volume Share (%), by Waste 2025 & 2033
- Figure 11: North America Hazardous Waste Management Market Revenue (Million), by Country 2025 & 2033
- Figure 12: North America Hazardous Waste Management Market Volume (Billion), by Country 2025 & 2033
- Figure 13: North America Hazardous Waste Management Market Revenue Share (%), by Country 2025 & 2033
- Figure 14: North America Hazardous Waste Management Market Volume Share (%), by Country 2025 & 2033
- Figure 15: Europe Hazardous Waste Management Market Revenue (Million), by Type 2025 & 2033
- Figure 16: Europe Hazardous Waste Management Market Volume (Billion), by Type 2025 & 2033
- Figure 17: Europe Hazardous Waste Management Market Revenue Share (%), by Type 2025 & 2033
- Figure 18: Europe Hazardous Waste Management Market Volume Share (%), by Type 2025 & 2033
- Figure 19: Europe Hazardous Waste Management Market Revenue (Million), by Waste 2025 & 2033
- Figure 20: Europe Hazardous Waste Management Market Volume (Billion), by Waste 2025 & 2033
- Figure 21: Europe Hazardous Waste Management Market Revenue Share (%), by Waste 2025 & 2033
- Figure 22: Europe Hazardous Waste Management Market Volume Share (%), by Waste 2025 & 2033
- Figure 23: Europe Hazardous Waste Management Market Revenue (Million), by Country 2025 & 2033
- Figure 24: Europe Hazardous Waste Management Market Volume (Billion), by Country 2025 & 2033
- Figure 25: Europe Hazardous Waste Management Market Revenue Share (%), by Country 2025 & 2033
- Figure 26: Europe Hazardous Waste Management Market Volume Share (%), by Country 2025 & 2033
- Figure 27: Asia Pacific Hazardous Waste Management Market Revenue (Million), by Type 2025 & 2033
- Figure 28: Asia Pacific Hazardous Waste Management Market Volume (Billion), by Type 2025 & 2033
- Figure 29: Asia Pacific Hazardous Waste Management Market Revenue Share (%), by Type 2025 & 2033
- Figure 30: Asia Pacific Hazardous Waste Management Market Volume Share (%), by Type 2025 & 2033
- Figure 31: Asia Pacific Hazardous Waste Management Market Revenue (Million), by Waste 2025 & 2033
- Figure 32: Asia Pacific Hazardous Waste Management Market Volume (Billion), by Waste 2025 & 2033
- Figure 33: Asia Pacific Hazardous Waste Management Market Revenue Share (%), by Waste 2025 & 2033
- Figure 34: Asia Pacific Hazardous Waste Management Market Volume Share (%), by Waste 2025 & 2033
- Figure 35: Asia Pacific Hazardous Waste Management Market Revenue (Million), by Country 2025 & 2033
- Figure 36: Asia Pacific Hazardous Waste Management Market Volume (Billion), by Country 2025 & 2033
- Figure 37: Asia Pacific Hazardous Waste Management Market Revenue Share (%), by Country 2025 & 2033
- Figure 38: Asia Pacific Hazardous Waste Management Market Volume Share (%), by Country 2025 & 2033
- Figure 39: Middle East and Africa Hazardous Waste Management Market Revenue (Million), by Type 2025 & 2033
- Figure 40: Middle East and Africa Hazardous Waste Management Market Volume (Billion), by Type 2025 & 2033
- Figure 41: Middle East and Africa Hazardous Waste Management Market Revenue Share (%), by Type 2025 & 2033
- Figure 42: Middle East and Africa Hazardous Waste Management Market Volume Share (%), by Type 2025 & 2033
- Figure 43: Middle East and Africa Hazardous Waste Management Market Revenue (Million), by Waste 2025 & 2033
- Figure 44: Middle East and Africa Hazardous Waste Management Market Volume (Billion), by Waste 2025 & 2033
- Figure 45: Middle East and Africa Hazardous Waste Management Market Revenue Share (%), by Waste 2025 & 2033
- Figure 46: Middle East and Africa Hazardous Waste Management Market Volume Share (%), by Waste 2025 & 2033
- Figure 47: Middle East and Africa Hazardous Waste Management Market Revenue (Million), by Country 2025 & 2033
- Figure 48: Middle East and Africa Hazardous Waste Management Market Volume (Billion), by Country 2025 & 2033
- Figure 49: Middle East and Africa Hazardous Waste Management Market Revenue Share (%), by Country 2025 & 2033
- Figure 50: Middle East and Africa Hazardous Waste Management Market Volume Share (%), by Country 2025 & 2033
- Figure 51: South America Hazardous Waste Management Market Revenue (Million), by Type 2025 & 2033
- Figure 52: South America Hazardous Waste Management Market Volume (Billion), by Type 2025 & 2033
- Figure 53: South America Hazardous Waste Management Market Revenue Share (%), by Type 2025 & 2033
- Figure 54: South America Hazardous Waste Management Market Volume Share (%), by Type 2025 & 2033
- Figure 55: South America Hazardous Waste Management Market Revenue (Million), by Waste 2025 & 2033
- Figure 56: South America Hazardous Waste Management Market Volume (Billion), by Waste 2025 & 2033
- Figure 57: South America Hazardous Waste Management Market Revenue Share (%), by Waste 2025 & 2033
- Figure 58: South America Hazardous Waste Management Market Volume Share (%), by Waste 2025 & 2033
- Figure 59: South America Hazardous Waste Management Market Revenue (Million), by Country 2025 & 2033
- Figure 60: South America Hazardous Waste Management Market Volume (Billion), by Country 2025 & 2033
- Figure 61: South America Hazardous Waste Management Market Revenue Share (%), by Country 2025 & 2033
- Figure 62: South America Hazardous Waste Management Market Volume Share (%), by Country 2025 & 2033
List of Tables
- Table 1: Global Hazardous Waste Management Market Revenue Million Forecast, by Type 2020 & 2033
- Table 2: Global Hazardous Waste Management Market Volume Billion Forecast, by Type 2020 & 2033
- Table 3: Global Hazardous Waste Management Market Revenue Million Forecast, by Waste 2020 & 2033
- Table 4: Global Hazardous Waste Management Market Volume Billion Forecast, by Waste 2020 & 2033
- Table 5: Global Hazardous Waste Management Market Revenue Million Forecast, by Region 2020 & 2033
- Table 6: Global Hazardous Waste Management Market Volume Billion Forecast, by Region 2020 & 2033
- Table 7: Global Hazardous Waste Management Market Revenue Million Forecast, by Type 2020 & 2033
- Table 8: Global Hazardous Waste Management Market Volume Billion Forecast, by Type 2020 & 2033
- Table 9: Global Hazardous Waste Management Market Revenue Million Forecast, by Waste 2020 & 2033
- Table 10: Global Hazardous Waste Management Market Volume Billion Forecast, by Waste 2020 & 2033
- Table 11: Global Hazardous Waste Management Market Revenue Million Forecast, by Country 2020 & 2033
- Table 12: Global Hazardous Waste Management Market Volume Billion Forecast, by Country 2020 & 2033
- Table 13: United States Hazardous Waste Management Market Revenue (Million) Forecast, by Application 2020 & 2033
- Table 14: United States Hazardous Waste Management Market Volume (Billion) Forecast, by Application 2020 & 2033
- Table 15: Canada Hazardous Waste Management Market Revenue (Million) Forecast, by Application 2020 & 2033
- Table 16: Canada Hazardous Waste Management Market Volume (Billion) Forecast, by Application 2020 & 2033
- Table 17: Global Hazardous Waste Management Market Revenue Million Forecast, by Type 2020 & 2033
- Table 18: Global Hazardous Waste Management Market Volume Billion Forecast, by Type 2020 & 2033
- Table 19: Global Hazardous Waste Management Market Revenue Million Forecast, by Waste 2020 & 2033
- Table 20: Global Hazardous Waste Management Market Volume Billion Forecast, by Waste 2020 & 2033
- Table 21: Global Hazardous Waste Management Market Revenue Million Forecast, by Country 2020 & 2033
- Table 22: Global Hazardous Waste Management Market Volume Billion Forecast, by Country 2020 & 2033
- Table 23: Germany Hazardous Waste Management Market Revenue (Million) Forecast, by Application 2020 & 2033
- Table 24: Germany Hazardous Waste Management Market Volume (Billion) Forecast, by Application 2020 & 2033
- Table 25: United Kingdom Hazardous Waste Management Market Revenue (Million) Forecast, by Application 2020 & 2033
- Table 26: United Kingdom Hazardous Waste Management Market Volume (Billion) Forecast, by Application 2020 & 2033
- Table 27: France Hazardous Waste Management Market Revenue (Million) Forecast, by Application 2020 & 2033
- Table 28: France Hazardous Waste Management Market Volume (Billion) Forecast, by Application 2020 & 2033
- Table 29: Russia Hazardous Waste Management Market Revenue (Million) Forecast, by Application 2020 & 2033
- Table 30: Russia Hazardous Waste Management Market Volume (Billion) Forecast, by Application 2020 & 2033
- Table 31: Spain Hazardous Waste Management Market Revenue (Million) Forecast, by Application 2020 & 2033
- Table 32: Spain Hazardous Waste Management Market Volume (Billion) Forecast, by Application 2020 & 2033
- Table 33: Rest of Europe Hazardous Waste Management Market Revenue (Million) Forecast, by Application 2020 & 2033
- Table 34: Rest of Europe Hazardous Waste Management Market Volume (Billion) Forecast, by Application 2020 & 2033
- Table 35: Global Hazardous Waste Management Market Revenue Million Forecast, by Type 2020 & 2033
- Table 36: Global Hazardous Waste Management Market Volume Billion Forecast, by Type 2020 & 2033
- Table 37: Global Hazardous Waste Management Market Revenue Million Forecast, by Waste 2020 & 2033
- Table 38: Global Hazardous Waste Management Market Volume Billion Forecast, by Waste 2020 & 2033
- Table 39: Global Hazardous Waste Management Market Revenue Million Forecast, by Country 2020 & 2033
- Table 40: Global Hazardous Waste Management Market Volume Billion Forecast, by Country 2020 & 2033
- Table 41: India Hazardous Waste Management Market Revenue (Million) Forecast, by Application 2020 & 2033
- Table 42: India Hazardous Waste Management Market Volume (Billion) Forecast, by Application 2020 & 2033
- Table 43: China Hazardous Waste Management Market Revenue (Million) Forecast, by Application 2020 & 2033
- Table 44: China Hazardous Waste Management Market Volume (Billion) Forecast, by Application 2020 & 2033
- Table 45: Japan Hazardous Waste Management Market Revenue (Million) Forecast, by Application 2020 & 2033
- Table 46: Japan Hazardous Waste Management Market Volume (Billion) Forecast, by Application 2020 & 2033
- Table 47: Rest of Asia Pacific Hazardous Waste Management Market Revenue (Million) Forecast, by Application 2020 & 2033
- Table 48: Rest of Asia Pacific Hazardous Waste Management Market Volume (Billion) Forecast, by Application 2020 & 2033
- Table 49: Global Hazardous Waste Management Market Revenue Million Forecast, by Type 2020 & 2033
- Table 50: Global Hazardous Waste Management Market Volume Billion Forecast, by Type 2020 & 2033
- Table 51: Global Hazardous Waste Management Market Revenue Million Forecast, by Waste 2020 & 2033
- Table 52: Global Hazardous Waste Management Market Volume Billion Forecast, by Waste 2020 & 2033
- Table 53: Global Hazardous Waste Management Market Revenue Million Forecast, by Country 2020 & 2033
- Table 54: Global Hazardous Waste Management Market Volume Billion Forecast, by Country 2020 & 2033
- Table 55: United Arab Emirates Hazardous Waste Management Market Revenue (Million) Forecast, by Application 2020 & 2033
- Table 56: United Arab Emirates Hazardous Waste Management Market Volume (Billion) Forecast, by Application 2020 & 2033
- Table 57: Saudi Arabia Hazardous Waste Management Market Revenue (Million) Forecast, by Application 2020 & 2033
- Table 58: Saudi Arabia Hazardous Waste Management Market Volume (Billion) Forecast, by Application 2020 & 2033
- Table 59: Rest of Middle East Hazardous Waste Management Market Revenue (Million) Forecast, by Application 2020 & 2033
- Table 60: Rest of Middle East Hazardous Waste Management Market Volume (Billion) Forecast, by Application 2020 & 2033
- Table 61: Global Hazardous Waste Management Market Revenue Million Forecast, by Type 2020 & 2033
- Table 62: Global Hazardous Waste Management Market Volume Billion Forecast, by Type 2020 & 2033
- Table 63: Global Hazardous Waste Management Market Revenue Million Forecast, by Waste 2020 & 2033
- Table 64: Global Hazardous Waste Management Market Volume Billion Forecast, by Waste 2020 & 2033
- Table 65: Global Hazardous Waste Management Market Revenue Million Forecast, by Country 2020 & 2033
- Table 66: Global Hazardous Waste Management Market Volume Billion Forecast, by Country 2020 & 2033
- Table 67: Brazil Hazardous Waste Management Market Revenue (Million) Forecast, by Application 2020 & 2033
- Table 68: Brazil Hazardous Waste Management Market Volume (Billion) Forecast, by Application 2020 & 2033
- Table 69: Argentina Hazardous Waste Management Market Revenue (Million) Forecast, by Application 2020 & 2033
- Table 70: Argentina Hazardous Waste Management Market Volume (Billion) Forecast, by Application 2020 & 2033
- Table 71: Rest of South America Hazardous Waste Management Market Revenue (Million) Forecast, by Application 2020 & 2033
- Table 72: Rest of South America Hazardous Waste Management Market Volume (Billion) Forecast, by Application 2020 & 2033
Frequently Asked Questions
1. What is the projected Compound Annual Growth Rate (CAGR) of the Hazardous Waste Management Market?
The projected CAGR is approximately 3.74%.
2. Which companies are prominent players in the Hazardous Waste Management Market?
Key companies in the market include Suez, Valicor, Veolia, Waste Connections, Waste Management, Republic Services, Biffa, Clean Harbors, Covanta Holding, Daiseki, Hitachi Zosen, Remondis SE & Co Kg, Urbaser, Biomedical Solutions*List Not Exhaustive 6 3 Other Companie.
3. What are the main segments of the Hazardous Waste Management Market?
The market segments include Type, Waste.
4. Can you provide details about the market size?
The market size is estimated to be USD 38.77 Million as of 2022.
5. What are some drivers contributing to market growth?
Stringent Global Environmental Regulations Drive Demand for Compliant Hazardous Waste Management and Disposal Solutions; Increased Industrial Activities and Urbanization Driving up Hazardous Waste Production. Fueling Demand for Waste Management Services; Innovations in Waste Treatment Technologies. such as Advanced Recycling and Waste-to-Energy Processes. Enhance Efficiency and Reduce Environmental Impact.
6. What are the notable trends driving market growth?
Asia-Pacific Expected to Dominate the Market Over the Coming Years.
7. Are there any restraints impacting market growth?
Stringent Global Environmental Regulations Drive Demand for Compliant Hazardous Waste Management and Disposal Solutions; Increased Industrial Activities and Urbanization Driving up Hazardous Waste Production. Fueling Demand for Waste Management Services; Innovations in Waste Treatment Technologies. such as Advanced Recycling and Waste-to-Energy Processes. Enhance Efficiency and Reduce Environmental Impact.
8. Can you provide examples of recent developments in the market?
April 2024: China Everbright Environment Group Limited, known as Everbright Environment, celebrated the successful construction of its Hue Waste-to-Energy Project in Thua Thien Hue Province, Vietnam. The event was graced by the presence of Vietnamese Prime Minister Pham Minh Chinh.
9. What pricing options are available for accessing the report?
Pricing options include single-user, multi-user, and enterprise licenses priced at USD 4750, USD 5250, and USD 8750 respectively.
10. Is the market size provided in terms of value or volume?
The market size is provided in terms of value, measured in Million and volume, measured in Billion.
11. Are there any specific market keywords associated with the report?
Yes, the market keyword associated with the report is "Hazardous Waste Management Market," which aids in identifying and referencing the specific market segment covered.
12. How do I determine which pricing option suits my needs best?
The pricing options vary based on user requirements and access needs. Individual users may opt for single-user licenses, while businesses requiring broader access may choose multi-user or enterprise licenses for cost-effective access to the report.
13. Are there any additional resources or data provided in the Hazardous Waste Management Market report?
While the report offers comprehensive insights, it's advisable to review the specific contents or supplementary materials provided to ascertain if additional resources or data are available.
14. How can I stay updated on further developments or reports in the Hazardous Waste Management Market?
To stay informed about further developments, trends, and reports in the Hazardous Waste Management Market, consider subscribing to industry newsletters, following relevant companies and organizations, or regularly checking reputable industry news sources and publications.
Methodology
Step 1 - Identification of Relevant Samples Size from Population Database


Step 2 - Approaches for Defining Global Market Size (Value, Volume* & Price*)

Note*: In applicable scenarios
Step 3 - Data Sources
Primary Research
- Web Analytics
- Survey Reports
- Research Institute
- Latest Research Reports
- Opinion Leaders
Secondary Research
- Annual Reports
- White Paper
- Latest Press Release
- Industry Association
- Paid Database
- Investor Presentations

Step 4 - Data Triangulation
Involves using different sources of information in order to increase the validity of a study
These sources are likely to be stakeholders in a program - participants, other researchers, program staff, other community members, and so on.
Then we put all data in single framework & apply various statistical tools to find out the dynamic on the market.
During the analysis stage, feedback from the stakeholder groups would be compared to determine areas of agreement as well as areas of divergence