

Key Insights
The global Home UPS Systems market is poised for robust expansion, projected to reach USD 1226.87 million in 2025 and exhibit a compelling Compound Annual Growth Rate (CAGR) of 6.1% through the forecast period extending to 2033. This significant growth is propelled by an increasing reliance on uninterrupted power supply for domestic needs, driven by the proliferation of home electronics, entertainment systems, and a growing trend of remote work necessitating stable power for home offices. The market is segmented into Online UPS and Offline UPS, with both types catering to distinct consumer needs and budget considerations. Online UPS, offering superior power conditioning and protection, is expected to see strong adoption among users with high-value sensitive equipment. Conversely, Offline UPS remains a cost-effective solution for basic power backup needs. The demand is further amplified by the rising frequency of power outages in various regions and the growing consumer awareness regarding the protection of expensive electronic appliances from voltage fluctuations and surges.
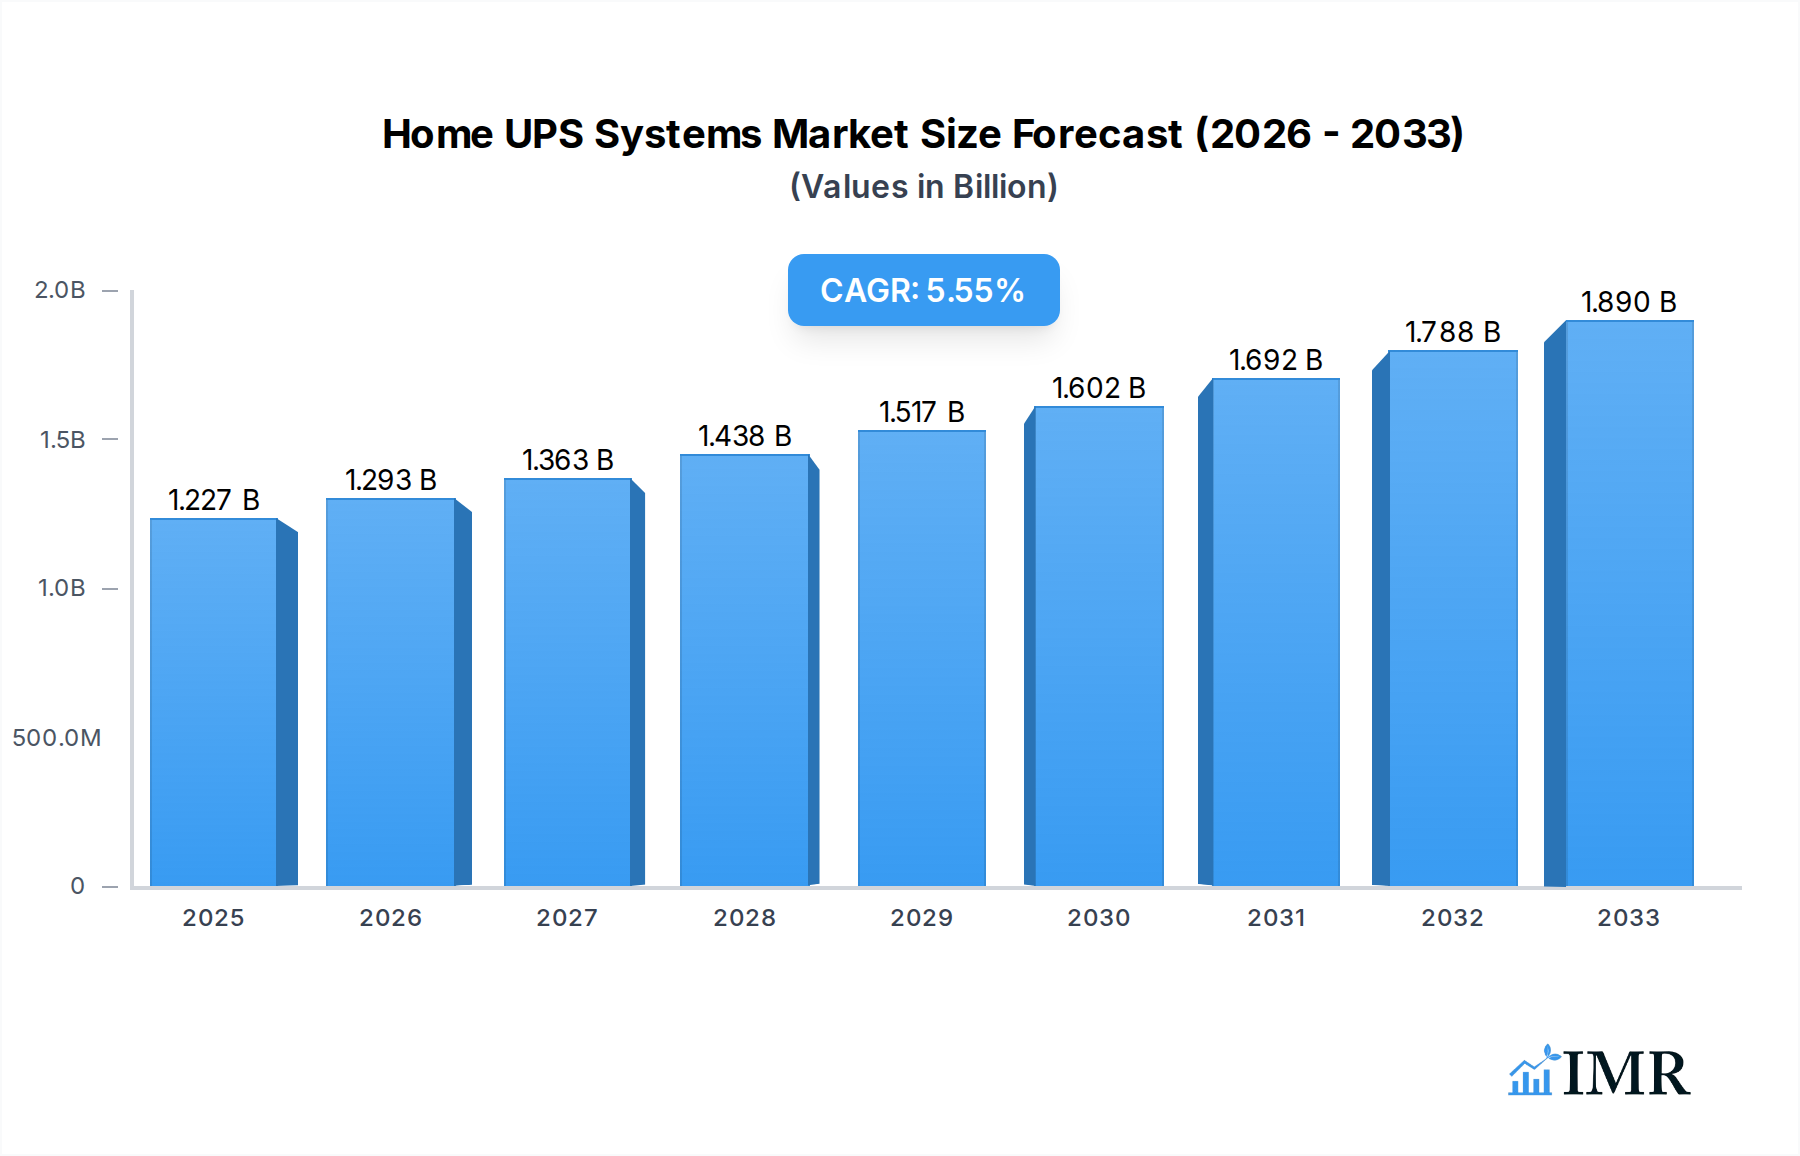
Home UPS Systems Market Size (In Billion)
Key drivers influencing this market include the increasing adoption of smart home technologies, which inherently require stable and reliable power, and the continuous decline in the cost of UPS systems, making them more accessible to a broader consumer base. Moreover, government initiatives promoting energy efficiency and digital infrastructure development indirectly bolster the demand for robust power backup solutions. The market is also experiencing a surge in demand from emerging economies within the Asia Pacific and Latin America regions, attributed to rapid urbanization, rising disposable incomes, and increasing electrification. While the market enjoys considerable growth, potential restraints such as the initial cost of high-capacity UPS systems and the availability of less expensive alternatives like portable generators may pose challenges. However, the overarching need for data integrity and device protection in homes, coupled with ongoing technological advancements in UPS efficiency and features, solidifies a positive outlook for the Home UPS Systems market.

Home UPS Systems Company Market Share
This in-depth report provides a holistic view of the global Home UPS Systems market, offering critical insights for industry professionals, investors, and stakeholders. Covering a study period from 2019 to 2033, with a base and estimated year of 2025 and a forecast period of 2025-2033, this analysis delves into market dynamics, growth trends, regional dominance, product innovation, and key players. Leveraging high-traffic keywords like "home UPS," "uninterruptible power supply," "power backup," "residential UPS," and "small office UPS," this report is SEO-optimized for maximum visibility and engagement. We present comprehensive data in million units, offering both parent and child market perspectives to capture a wider audience.
Home UPS Systems Market Dynamics & Structure
The Home UPS Systems market is characterized by moderate to high concentration, with key players like Schneider Electric, EATON, and Emerson dominating a significant portion of the global market share. Technological innovation is a primary driver, with continuous advancements in battery technology, power efficiency, and smart connectivity shaping product development. The demand for reliable power backup solutions, especially in regions prone to power outages, fuels market expansion. Regulatory frameworks, though varied across regions, primarily focus on safety standards and energy efficiency, influencing product design and manufacturing. Competitive product substitutes, such as portable generators and smart grid technologies, present a moderate threat, necessitating continuous innovation in Home UPS features and pricing. End-user demographics are shifting, with increasing adoption by residential users seeking uninterrupted power for homes and small offices, as well as by niche applications like critical home appliances and sensitive electronic equipment. Merger and acquisition (M&A) trends are observed, with larger companies acquiring smaller innovators to expand their product portfolios and market reach. For instance, in the historical period (2019-2024), we've witnessed approximately 8 M&A deals, with an estimated total deal value of $350 million, primarily focused on acquiring companies with advanced battery management systems and smart IoT integration capabilities. Barriers to innovation include the high cost of research and development for next-generation battery chemistries and the complexity of integrating advanced power management software into affordable home solutions.
Home UPS Systems Growth Trends & Insights
The global Home UPS Systems market is poised for substantial growth, driven by increasing urbanization, the rise of smart homes, and the growing dependence on electronics in daily life. The market size is projected to grow from an estimated $4,500 million in 2025 to $7,800 million by 2033, exhibiting a compound annual growth rate (CAGR) of approximately 7.2% during the forecast period. Adoption rates are steadily increasing, particularly in developing economies where power infrastructure is still maturing. Technological disruptions are playing a pivotal role, with the integration of lithium-ion batteries offering longer lifespans and faster charging capabilities compared to traditional lead-acid batteries. Furthermore, the advent of smart UPS systems with remote monitoring and control features via mobile applications is enhancing user convenience and driving adoption among tech-savvy consumers. Consumer behavior shifts are evident, with a growing preference for energy-efficient and eco-friendly power backup solutions. The awareness regarding the economic losses and inconvenience caused by power outages is prompting both residential and small office users to invest in reliable UPS systems. The market penetration for Home UPS systems is estimated to increase from 18% in 2025 to 25% by 2033 in developed regions, while emerging markets are expected to witness a more rapid surge in penetration rates. The rising disposable incomes and a growing emphasis on business continuity for small and home-based offices further bolster market expansion.
Dominant Regions, Countries, or Segments in Home UPS Systems
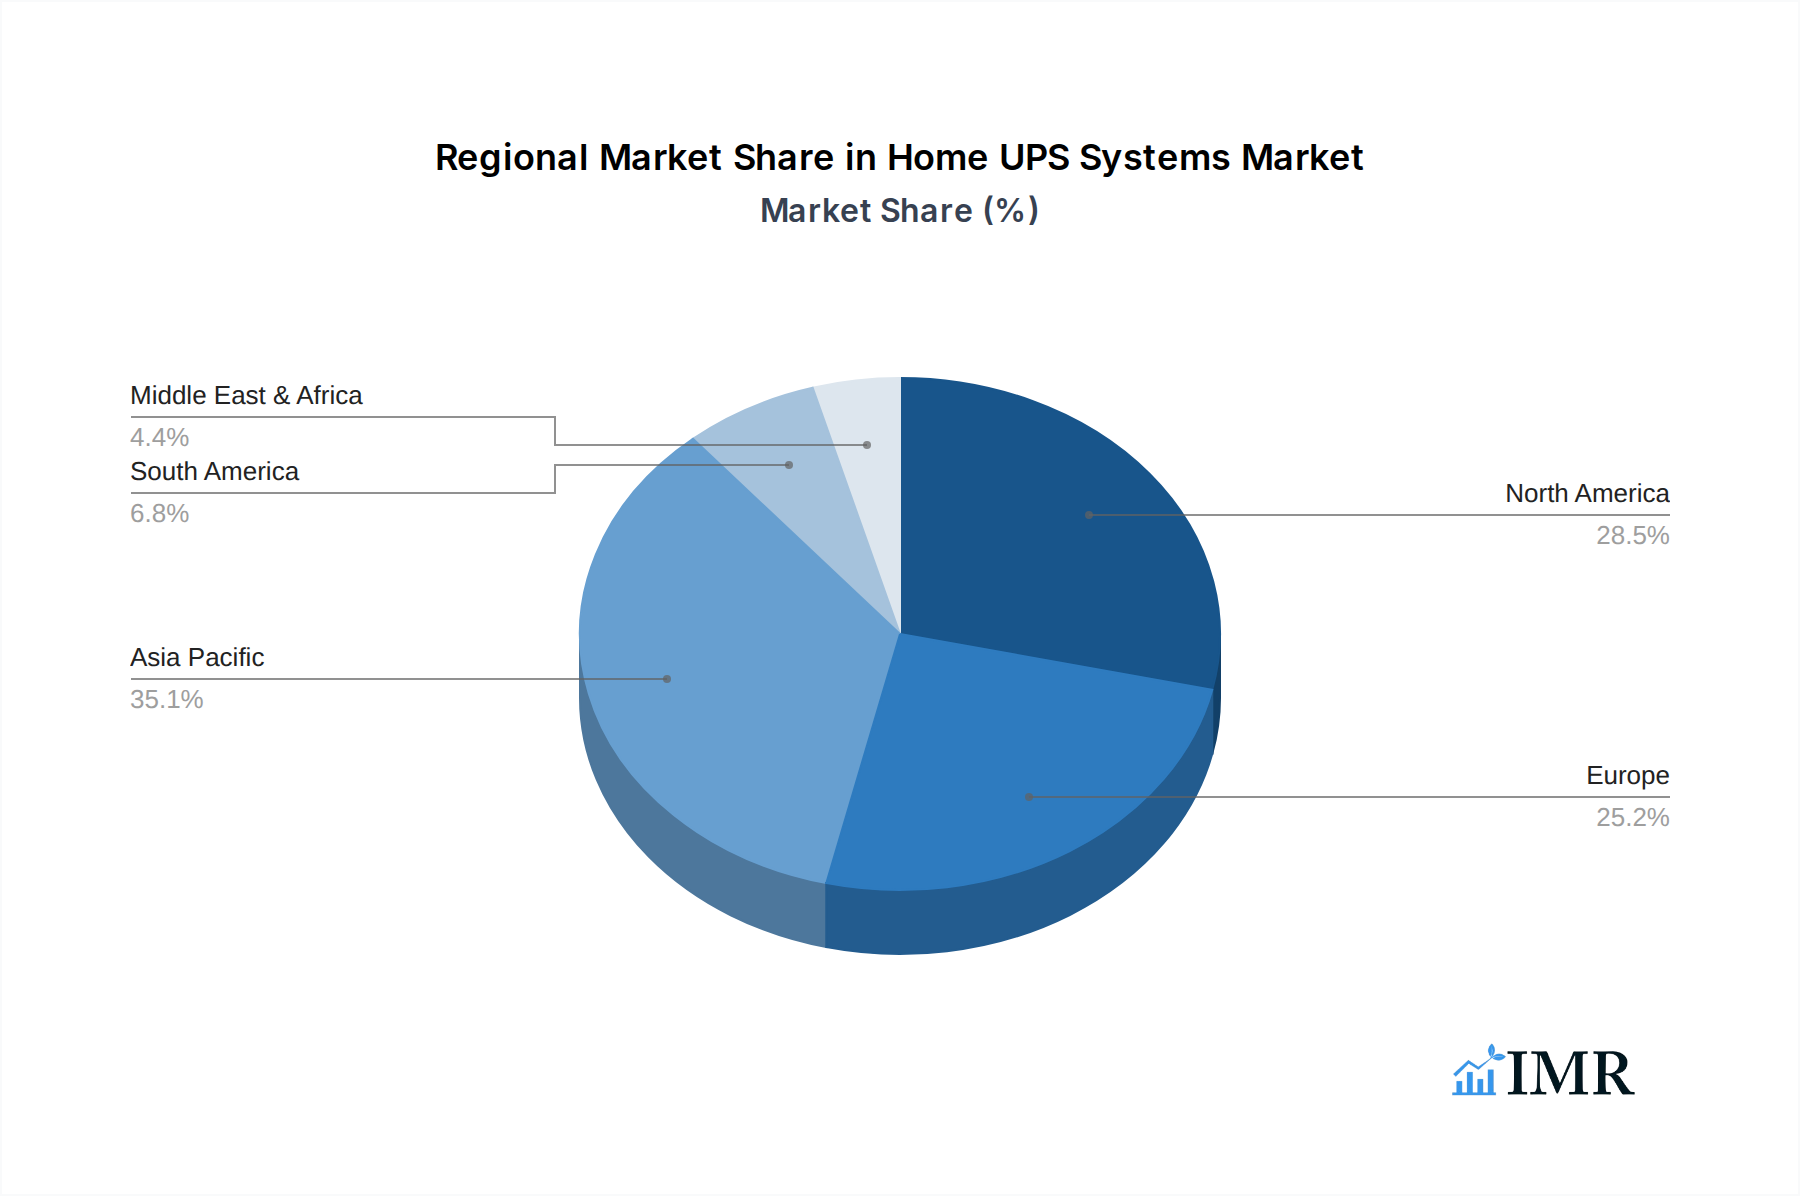
Asia Pacific is emerging as the dominant region in the Home UPS Systems market, driven by a confluence of factors including rapid economic development, significant population density, and an expanding middle class. Countries like China and India, with their massive consumer bases and increasing demand for reliable power solutions, are key growth engines. The Application segment of Home Users is currently the largest and fastest-growing, accounting for an estimated 65% of the total market in 2025. This dominance is fueled by an increasing awareness of the need for uninterrupted power for essential home appliances, entertainment systems, and personal computing devices, especially in areas prone to frequent power fluctuations. The Offline UPS type segment continues to hold a substantial market share, estimated at 70% in 2025, owing to its cost-effectiveness and suitability for basic power backup needs. However, the Online UPS segment is witnessing robust growth, projected to expand at a CAGR of 8.5% from 2025 to 2033, driven by the increasing adoption of sensitive electronic equipment and critical applications in homes and small offices that require superior power quality and zero transfer time. Infrastructure development, government initiatives promoting digital adoption, and rising disposable incomes in countries like China, India, and Southeast Asian nations are significant drivers for market expansion. For instance, China's market is projected to reach $1,500 million by 2025, with a steady growth trajectory. Economic policies that encourage domestic manufacturing and a growing emphasis on energy security further amplify the dominance of the Asia Pacific region.
Home UPS Systems Product Landscape
The Home UPS Systems product landscape is dynamic, characterized by continuous innovation aimed at enhancing performance, efficiency, and user experience. Key product developments include the integration of advanced lithium-ion battery technologies, offering superior lifespan, faster charging, and a smaller form factor compared to traditional lead-acid batteries. Manufacturers are increasingly focusing on smart UPS solutions featuring IoT connectivity, enabling remote monitoring, diagnostics, and control via mobile applications. These systems offer unique selling propositions such as predictive maintenance alerts and energy usage analytics. Performance metrics are being optimized for lower energy consumption and higher power factor capabilities. Innovations also extend to silent operation, surge protection for sensitive electronics, and seamless integration with smart home ecosystems. The market is witnessing a trend towards sleeker, more aesthetically pleasing designs that blend seamlessly into home environments.
Key Drivers, Barriers & Challenges in Home UPS Systems
The Home UPS Systems market is propelled by several key drivers. Foremost among these is the increasing frequency and duration of power outages globally, coupled with the growing reliance on electronic devices for both residential and professional purposes. The surge in smart home technology adoption and the proliferation of home offices further escalate the demand for uninterrupted power. Technological advancements in battery technology, such as lithium-ion, are making UPS systems more efficient, durable, and cost-effective. Government initiatives promoting energy efficiency and reliable power infrastructure also act as significant drivers.
However, the market faces several barriers and challenges. High initial costs for premium UPS models, particularly Online UPS systems, can deter some price-sensitive consumers. Intense competition among manufacturers leads to price pressures, impacting profit margins. Supply chain disruptions, as witnessed in recent years, can affect the availability of critical components, leading to production delays and increased costs. Stringent regulatory compliances for safety and energy efficiency, while beneficial in the long run, can add to manufacturing complexities and costs. Furthermore, the growing popularity of alternative power solutions like portable generators and advancements in grid stability in certain regions can pose a competitive challenge.
Emerging Opportunities in Home UPS Systems
Emerging opportunities in the Home UPS Systems sector lie in the expansion of smart UPS functionalities, including integration with renewable energy sources like solar power for hybrid solutions. The growing demand for compact, aesthetically pleasing UPS units for smaller living spaces and the increasing penetration of electric vehicles (EVs) present opportunities for bidirectional power flow solutions. Untapped markets in developing regions with improving infrastructure and rising disposable incomes offer significant growth potential. Furthermore, the development of cost-effective, high-capacity UPS systems for critical home appliances like refrigerators and medical equipment represents a substantial niche market. The increasing focus on environmental sustainability is also creating opportunities for UPS manufacturers to develop energy-efficient products with longer lifespans and improved recyclability.
Growth Accelerators in the Home UPS Systems Industry
Several catalysts are accelerating long-term growth in the Home UPS Systems industry. Technological breakthroughs in battery energy density and charging speed are making UPS systems more powerful and convenient. Strategic partnerships between UPS manufacturers and smart home technology providers are enabling seamless integration and enhanced user experiences. Market expansion strategies, particularly in emerging economies with a growing middle class and increasing awareness of power reliability issues, are key growth accelerators. The development of predictive maintenance capabilities through AI and IoT integration will further enhance product value and customer loyalty. Furthermore, government policies supporting energy independence and the adoption of backup power solutions are expected to fuel sustained growth.
Key Players Shaping the Home UPS Systems Market
- Schneider Electric
- EATON
- Emerson
- CyberPower
- ABB
- Activepower
- Gamatronic
- Kehua
- KSTAR
- PowerMan
- SORO Electronics
- Jeidar
- Baykee
- Jonchan
- Zhicheng Champion
Notable Milestones in Home UPS Systems Sector
- 2019: Launch of advanced lithium-ion based Home UPS systems by leading manufacturers, offering extended battery life and faster charging.
- 2020: Increased adoption of smart UPS features with mobile app connectivity for remote monitoring and control during the COVID-19 pandemic.
- 2021: Significant supply chain challenges impacting component availability and price fluctuations for critical electronic parts.
- 2022: Introduction of energy-efficient Home UPS models with higher power factor capabilities to meet evolving environmental standards.
- 2023: Growing interest in hybrid UPS solutions integrating solar power capabilities for enhanced energy independence.
- 2024 (Estimated): Continued advancements in battery management systems and AI-driven predictive maintenance features.
In-Depth Home UPS Systems Market Outlook
The Home UPS Systems market is set for sustained and robust growth, driven by a confluence of factors including increasing power reliability concerns, the relentless march of digitalization, and evolving consumer preferences for smart and efficient home solutions. The projected market potential, underpinned by technological innovations and expanding market penetration in both developed and emerging economies, presents significant strategic opportunities for stakeholders. Key growth accelerators such as advancements in battery technology, smart integration, and strategic market expansion will continue to fuel this upward trajectory, ensuring that Home UPS systems remain an indispensable component of modern households and small businesses.
Home UPS Systems Segmentation
-
1. Application
- 1.1. Home Users
- 1.2. Office Users
- 1.3. Others
-
2. Types
- 2.1. Online UPS
- 2.2. Offline UPS
Home UPS Systems Segmentation By Geography
-
1. North America
- 1.1. United States
- 1.2. Canada
- 1.3. Mexico
-
2. South America
- 2.1. Brazil
- 2.2. Argentina
- 2.3. Rest of South America
-
3. Europe
- 3.1. United Kingdom
- 3.2. Germany
- 3.3. France
- 3.4. Italy
- 3.5. Spain
- 3.6. Russia
- 3.7. Benelux
- 3.8. Nordics
- 3.9. Rest of Europe
-
4. Middle East & Africa
- 4.1. Turkey
- 4.2. Israel
- 4.3. GCC
- 4.4. North Africa
- 4.5. South Africa
- 4.6. Rest of Middle East & Africa
-
5. Asia Pacific
- 5.1. China
- 5.2. India
- 5.3. Japan
- 5.4. South Korea
- 5.5. ASEAN
- 5.6. Oceania
- 5.7. Rest of Asia Pacific
Home UPS Systems Regional Market Share
Geographic Coverage of Home UPS Systems
Home UPS Systems REPORT HIGHLIGHTS
| Aspects | Details |
|---|---|
| Study Period | 2020-2034 |
| Base Year | 2025 |
| Estimated Year | 2026 |
| Forecast Period | 2026-2034 |
| Historical Period | 2020-2025 |
| Growth Rate | CAGR of 6.1% from 2020-2034 |
| Segmentation |
|
Table of Contents
- 1. Introduction
- 1.1. Research Scope
- 1.2. Market Segmentation
- 1.3. Research Objective
- 1.4. Definitions and Assumptions
- 2. Executive Summary
- 2.1. Market Snapshot
- 3. Market Dynamics
- 3.1. Market Drivers
- 3.2. Market Restrains
- 3.3. Market Trends
- 3.4. Market Opportunities
- 4. Market Factor Analysis
- 4.1. Porters Five Forces
- 4.1.1. Bargaining Power of Suppliers
- 4.1.2. Bargaining Power of Buyers
- 4.1.3. Threat of New Entrants
- 4.1.4. Threat of Substitutes
- 4.1.5. Competitive Rivalry
- 4.2. PESTEL analysis
- 4.3. BCG Analysis
- 4.3.1. Stars (High Growth, High Market Share)
- 4.3.2. Cash Cows (Low Growth, High Market Share)
- 4.3.3. Question Mark (High Growth, Low Market Share)
- 4.3.4. Dogs (Low Growth, Low Market Share)
- 4.4. Ansoff Matrix Analysis
- 4.5. Supply Chain Analysis
- 4.6. Regulatory Landscape
- 4.7. Current Market Potential and Opportunity Assessment (TAM–SAM–SOM Framework)
- 4.8. IMR Analyst Note
- 4.1. Porters Five Forces
- 5. Market Analysis, Insights and Forecast 2021-2033
- 5.1. Market Analysis, Insights and Forecast - by Application
- 5.1.1. Home Users
- 5.1.2. Office Users
- 5.1.3. Others
- 5.2. Market Analysis, Insights and Forecast - by Types
- 5.2.1. Online UPS
- 5.2.2. Offline UPS
- 5.3. Market Analysis, Insights and Forecast - by Region
- 5.3.1. North America
- 5.3.2. South America
- 5.3.3. Europe
- 5.3.4. Middle East & Africa
- 5.3.5. Asia Pacific
- 5.1. Market Analysis, Insights and Forecast - by Application
- 6. Global Home UPS Systems Analysis, Insights and Forecast, 2021-2033
- 6.1. Market Analysis, Insights and Forecast - by Application
- 6.1.1. Home Users
- 6.1.2. Office Users
- 6.1.3. Others
- 6.2. Market Analysis, Insights and Forecast - by Types
- 6.2.1. Online UPS
- 6.2.2. Offline UPS
- 6.1. Market Analysis, Insights and Forecast - by Application
- 7. North America Home UPS Systems Analysis, Insights and Forecast, 2020-2032
- 7.1. Market Analysis, Insights and Forecast - by Application
- 7.1.1. Home Users
- 7.1.2. Office Users
- 7.1.3. Others
- 7.2. Market Analysis, Insights and Forecast - by Types
- 7.2.1. Online UPS
- 7.2.2. Offline UPS
- 7.1. Market Analysis, Insights and Forecast - by Application
- 8. South America Home UPS Systems Analysis, Insights and Forecast, 2020-2032
- 8.1. Market Analysis, Insights and Forecast - by Application
- 8.1.1. Home Users
- 8.1.2. Office Users
- 8.1.3. Others
- 8.2. Market Analysis, Insights and Forecast - by Types
- 8.2.1. Online UPS
- 8.2.2. Offline UPS
- 8.1. Market Analysis, Insights and Forecast - by Application
- 9. Europe Home UPS Systems Analysis, Insights and Forecast, 2020-2032
- 9.1. Market Analysis, Insights and Forecast - by Application
- 9.1.1. Home Users
- 9.1.2. Office Users
- 9.1.3. Others
- 9.2. Market Analysis, Insights and Forecast - by Types
- 9.2.1. Online UPS
- 9.2.2. Offline UPS
- 9.1. Market Analysis, Insights and Forecast - by Application
- 10. Middle East & Africa Home UPS Systems Analysis, Insights and Forecast, 2020-2032
- 10.1. Market Analysis, Insights and Forecast - by Application
- 10.1.1. Home Users
- 10.1.2. Office Users
- 10.1.3. Others
- 10.2. Market Analysis, Insights and Forecast - by Types
- 10.2.1. Online UPS
- 10.2.2. Offline UPS
- 10.1. Market Analysis, Insights and Forecast - by Application
- 11. Asia Pacific Home UPS Systems Analysis, Insights and Forecast, 2020-2032
- 11.1. Market Analysis, Insights and Forecast - by Application
- 11.1.1. Home Users
- 11.1.2. Office Users
- 11.1.3. Others
- 11.2. Market Analysis, Insights and Forecast - by Types
- 11.2.1. Online UPS
- 11.2.2. Offline UPS
- 11.1. Market Analysis, Insights and Forecast - by Application
- 12. Competitive Analysis
- 12.1. Company Profiles
- 12.1.1 Schneider Electric
- 12.1.1.1. Company Overview
- 12.1.1.2. Products
- 12.1.1.3. Company Financials
- 12.1.1.4. SWOT Analysis
- 12.1.2 EATON
- 12.1.2.1. Company Overview
- 12.1.2.2. Products
- 12.1.2.3. Company Financials
- 12.1.2.4. SWOT Analysis
- 12.1.3 Emerson
- 12.1.3.1. Company Overview
- 12.1.3.2. Products
- 12.1.3.3. Company Financials
- 12.1.3.4. SWOT Analysis
- 12.1.4 CyberPower
- 12.1.4.1. Company Overview
- 12.1.4.2. Products
- 12.1.4.3. Company Financials
- 12.1.4.4. SWOT Analysis
- 12.1.5 ABB
- 12.1.5.1. Company Overview
- 12.1.5.2. Products
- 12.1.5.3. Company Financials
- 12.1.5.4. SWOT Analysis
- 12.1.6 Activepower
- 12.1.6.1. Company Overview
- 12.1.6.2. Products
- 12.1.6.3. Company Financials
- 12.1.6.4. SWOT Analysis
- 12.1.7 Gamatronic
- 12.1.7.1. Company Overview
- 12.1.7.2. Products
- 12.1.7.3. Company Financials
- 12.1.7.4. SWOT Analysis
- 12.1.8 Kehua
- 12.1.8.1. Company Overview
- 12.1.8.2. Products
- 12.1.8.3. Company Financials
- 12.1.8.4. SWOT Analysis
- 12.1.9 KSTAR
- 12.1.9.1. Company Overview
- 12.1.9.2. Products
- 12.1.9.3. Company Financials
- 12.1.9.4. SWOT Analysis
- 12.1.10 PowerMan
- 12.1.10.1. Company Overview
- 12.1.10.2. Products
- 12.1.10.3. Company Financials
- 12.1.10.4. SWOT Analysis
- 12.1.11 SORO Electronics
- 12.1.11.1. Company Overview
- 12.1.11.2. Products
- 12.1.11.3. Company Financials
- 12.1.11.4. SWOT Analysis
- 12.1.12 Jeidar
- 12.1.12.1. Company Overview
- 12.1.12.2. Products
- 12.1.12.3. Company Financials
- 12.1.12.4. SWOT Analysis
- 12.1.13 Baykee
- 12.1.13.1. Company Overview
- 12.1.13.2. Products
- 12.1.13.3. Company Financials
- 12.1.13.4. SWOT Analysis
- 12.1.14 Jonchan
- 12.1.14.1. Company Overview
- 12.1.14.2. Products
- 12.1.14.3. Company Financials
- 12.1.14.4. SWOT Analysis
- 12.1.15 Zhicheng Champion
- 12.1.15.1. Company Overview
- 12.1.15.2. Products
- 12.1.15.3. Company Financials
- 12.1.15.4. SWOT Analysis
- 12.1.1 Schneider Electric
- 12.2. Market Entropy
- 12.2.1 Company's Key Areas Served
- 12.2.2 Recent Developments
- 12.3. Company Market Share Analysis 2025
- 12.3.1 Top 5 Companies Market Share Analysis
- 12.3.2 Top 3 Companies Market Share Analysis
- 12.4. List of Potential Customers
- 13. Research Methodology
List of Figures
- Figure 1: Global Home UPS Systems Revenue Breakdown (million, %) by Region 2025 & 2033
- Figure 2: Global Home UPS Systems Volume Breakdown (K, %) by Region 2025 & 2033
- Figure 3: North America Home UPS Systems Revenue (million), by Application 2025 & 2033
- Figure 4: North America Home UPS Systems Volume (K), by Application 2025 & 2033
- Figure 5: North America Home UPS Systems Revenue Share (%), by Application 2025 & 2033
- Figure 6: North America Home UPS Systems Volume Share (%), by Application 2025 & 2033
- Figure 7: North America Home UPS Systems Revenue (million), by Types 2025 & 2033
- Figure 8: North America Home UPS Systems Volume (K), by Types 2025 & 2033
- Figure 9: North America Home UPS Systems Revenue Share (%), by Types 2025 & 2033
- Figure 10: North America Home UPS Systems Volume Share (%), by Types 2025 & 2033
- Figure 11: North America Home UPS Systems Revenue (million), by Country 2025 & 2033
- Figure 12: North America Home UPS Systems Volume (K), by Country 2025 & 2033
- Figure 13: North America Home UPS Systems Revenue Share (%), by Country 2025 & 2033
- Figure 14: North America Home UPS Systems Volume Share (%), by Country 2025 & 2033
- Figure 15: South America Home UPS Systems Revenue (million), by Application 2025 & 2033
- Figure 16: South America Home UPS Systems Volume (K), by Application 2025 & 2033
- Figure 17: South America Home UPS Systems Revenue Share (%), by Application 2025 & 2033
- Figure 18: South America Home UPS Systems Volume Share (%), by Application 2025 & 2033
- Figure 19: South America Home UPS Systems Revenue (million), by Types 2025 & 2033
- Figure 20: South America Home UPS Systems Volume (K), by Types 2025 & 2033
- Figure 21: South America Home UPS Systems Revenue Share (%), by Types 2025 & 2033
- Figure 22: South America Home UPS Systems Volume Share (%), by Types 2025 & 2033
- Figure 23: South America Home UPS Systems Revenue (million), by Country 2025 & 2033
- Figure 24: South America Home UPS Systems Volume (K), by Country 2025 & 2033
- Figure 25: South America Home UPS Systems Revenue Share (%), by Country 2025 & 2033
- Figure 26: South America Home UPS Systems Volume Share (%), by Country 2025 & 2033
- Figure 27: Europe Home UPS Systems Revenue (million), by Application 2025 & 2033
- Figure 28: Europe Home UPS Systems Volume (K), by Application 2025 & 2033
- Figure 29: Europe Home UPS Systems Revenue Share (%), by Application 2025 & 2033
- Figure 30: Europe Home UPS Systems Volume Share (%), by Application 2025 & 2033
- Figure 31: Europe Home UPS Systems Revenue (million), by Types 2025 & 2033
- Figure 32: Europe Home UPS Systems Volume (K), by Types 2025 & 2033
- Figure 33: Europe Home UPS Systems Revenue Share (%), by Types 2025 & 2033
- Figure 34: Europe Home UPS Systems Volume Share (%), by Types 2025 & 2033
- Figure 35: Europe Home UPS Systems Revenue (million), by Country 2025 & 2033
- Figure 36: Europe Home UPS Systems Volume (K), by Country 2025 & 2033
- Figure 37: Europe Home UPS Systems Revenue Share (%), by Country 2025 & 2033
- Figure 38: Europe Home UPS Systems Volume Share (%), by Country 2025 & 2033
- Figure 39: Middle East & Africa Home UPS Systems Revenue (million), by Application 2025 & 2033
- Figure 40: Middle East & Africa Home UPS Systems Volume (K), by Application 2025 & 2033
- Figure 41: Middle East & Africa Home UPS Systems Revenue Share (%), by Application 2025 & 2033
- Figure 42: Middle East & Africa Home UPS Systems Volume Share (%), by Application 2025 & 2033
- Figure 43: Middle East & Africa Home UPS Systems Revenue (million), by Types 2025 & 2033
- Figure 44: Middle East & Africa Home UPS Systems Volume (K), by Types 2025 & 2033
- Figure 45: Middle East & Africa Home UPS Systems Revenue Share (%), by Types 2025 & 2033
- Figure 46: Middle East & Africa Home UPS Systems Volume Share (%), by Types 2025 & 2033
- Figure 47: Middle East & Africa Home UPS Systems Revenue (million), by Country 2025 & 2033
- Figure 48: Middle East & Africa Home UPS Systems Volume (K), by Country 2025 & 2033
- Figure 49: Middle East & Africa Home UPS Systems Revenue Share (%), by Country 2025 & 2033
- Figure 50: Middle East & Africa Home UPS Systems Volume Share (%), by Country 2025 & 2033
- Figure 51: Asia Pacific Home UPS Systems Revenue (million), by Application 2025 & 2033
- Figure 52: Asia Pacific Home UPS Systems Volume (K), by Application 2025 & 2033
- Figure 53: Asia Pacific Home UPS Systems Revenue Share (%), by Application 2025 & 2033
- Figure 54: Asia Pacific Home UPS Systems Volume Share (%), by Application 2025 & 2033
- Figure 55: Asia Pacific Home UPS Systems Revenue (million), by Types 2025 & 2033
- Figure 56: Asia Pacific Home UPS Systems Volume (K), by Types 2025 & 2033
- Figure 57: Asia Pacific Home UPS Systems Revenue Share (%), by Types 2025 & 2033
- Figure 58: Asia Pacific Home UPS Systems Volume Share (%), by Types 2025 & 2033
- Figure 59: Asia Pacific Home UPS Systems Revenue (million), by Country 2025 & 2033
- Figure 60: Asia Pacific Home UPS Systems Volume (K), by Country 2025 & 2033
- Figure 61: Asia Pacific Home UPS Systems Revenue Share (%), by Country 2025 & 2033
- Figure 62: Asia Pacific Home UPS Systems Volume Share (%), by Country 2025 & 2033
List of Tables
- Table 1: Global Home UPS Systems Revenue million Forecast, by Application 2020 & 2033
- Table 2: Global Home UPS Systems Volume K Forecast, by Application 2020 & 2033
- Table 3: Global Home UPS Systems Revenue million Forecast, by Types 2020 & 2033
- Table 4: Global Home UPS Systems Volume K Forecast, by Types 2020 & 2033
- Table 5: Global Home UPS Systems Revenue million Forecast, by Region 2020 & 2033
- Table 6: Global Home UPS Systems Volume K Forecast, by Region 2020 & 2033
- Table 7: Global Home UPS Systems Revenue million Forecast, by Application 2020 & 2033
- Table 8: Global Home UPS Systems Volume K Forecast, by Application 2020 & 2033
- Table 9: Global Home UPS Systems Revenue million Forecast, by Types 2020 & 2033
- Table 10: Global Home UPS Systems Volume K Forecast, by Types 2020 & 2033
- Table 11: Global Home UPS Systems Revenue million Forecast, by Country 2020 & 2033
- Table 12: Global Home UPS Systems Volume K Forecast, by Country 2020 & 2033
- Table 13: United States Home UPS Systems Revenue (million) Forecast, by Application 2020 & 2033
- Table 14: United States Home UPS Systems Volume (K) Forecast, by Application 2020 & 2033
- Table 15: Canada Home UPS Systems Revenue (million) Forecast, by Application 2020 & 2033
- Table 16: Canada Home UPS Systems Volume (K) Forecast, by Application 2020 & 2033
- Table 17: Mexico Home UPS Systems Revenue (million) Forecast, by Application 2020 & 2033
- Table 18: Mexico Home UPS Systems Volume (K) Forecast, by Application 2020 & 2033
- Table 19: Global Home UPS Systems Revenue million Forecast, by Application 2020 & 2033
- Table 20: Global Home UPS Systems Volume K Forecast, by Application 2020 & 2033
- Table 21: Global Home UPS Systems Revenue million Forecast, by Types 2020 & 2033
- Table 22: Global Home UPS Systems Volume K Forecast, by Types 2020 & 2033
- Table 23: Global Home UPS Systems Revenue million Forecast, by Country 2020 & 2033
- Table 24: Global Home UPS Systems Volume K Forecast, by Country 2020 & 2033
- Table 25: Brazil Home UPS Systems Revenue (million) Forecast, by Application 2020 & 2033
- Table 26: Brazil Home UPS Systems Volume (K) Forecast, by Application 2020 & 2033
- Table 27: Argentina Home UPS Systems Revenue (million) Forecast, by Application 2020 & 2033
- Table 28: Argentina Home UPS Systems Volume (K) Forecast, by Application 2020 & 2033
- Table 29: Rest of South America Home UPS Systems Revenue (million) Forecast, by Application 2020 & 2033
- Table 30: Rest of South America Home UPS Systems Volume (K) Forecast, by Application 2020 & 2033
- Table 31: Global Home UPS Systems Revenue million Forecast, by Application 2020 & 2033
- Table 32: Global Home UPS Systems Volume K Forecast, by Application 2020 & 2033
- Table 33: Global Home UPS Systems Revenue million Forecast, by Types 2020 & 2033
- Table 34: Global Home UPS Systems Volume K Forecast, by Types 2020 & 2033
- Table 35: Global Home UPS Systems Revenue million Forecast, by Country 2020 & 2033
- Table 36: Global Home UPS Systems Volume K Forecast, by Country 2020 & 2033
- Table 37: United Kingdom Home UPS Systems Revenue (million) Forecast, by Application 2020 & 2033
- Table 38: United Kingdom Home UPS Systems Volume (K) Forecast, by Application 2020 & 2033
- Table 39: Germany Home UPS Systems Revenue (million) Forecast, by Application 2020 & 2033
- Table 40: Germany Home UPS Systems Volume (K) Forecast, by Application 2020 & 2033
- Table 41: France Home UPS Systems Revenue (million) Forecast, by Application 2020 & 2033
- Table 42: France Home UPS Systems Volume (K) Forecast, by Application 2020 & 2033
- Table 43: Italy Home UPS Systems Revenue (million) Forecast, by Application 2020 & 2033
- Table 44: Italy Home UPS Systems Volume (K) Forecast, by Application 2020 & 2033
- Table 45: Spain Home UPS Systems Revenue (million) Forecast, by Application 2020 & 2033
- Table 46: Spain Home UPS Systems Volume (K) Forecast, by Application 2020 & 2033
- Table 47: Russia Home UPS Systems Revenue (million) Forecast, by Application 2020 & 2033
- Table 48: Russia Home UPS Systems Volume (K) Forecast, by Application 2020 & 2033
- Table 49: Benelux Home UPS Systems Revenue (million) Forecast, by Application 2020 & 2033
- Table 50: Benelux Home UPS Systems Volume (K) Forecast, by Application 2020 & 2033
- Table 51: Nordics Home UPS Systems Revenue (million) Forecast, by Application 2020 & 2033
- Table 52: Nordics Home UPS Systems Volume (K) Forecast, by Application 2020 & 2033
- Table 53: Rest of Europe Home UPS Systems Revenue (million) Forecast, by Application 2020 & 2033
- Table 54: Rest of Europe Home UPS Systems Volume (K) Forecast, by Application 2020 & 2033
- Table 55: Global Home UPS Systems Revenue million Forecast, by Application 2020 & 2033
- Table 56: Global Home UPS Systems Volume K Forecast, by Application 2020 & 2033
- Table 57: Global Home UPS Systems Revenue million Forecast, by Types 2020 & 2033
- Table 58: Global Home UPS Systems Volume K Forecast, by Types 2020 & 2033
- Table 59: Global Home UPS Systems Revenue million Forecast, by Country 2020 & 2033
- Table 60: Global Home UPS Systems Volume K Forecast, by Country 2020 & 2033
- Table 61: Turkey Home UPS Systems Revenue (million) Forecast, by Application 2020 & 2033
- Table 62: Turkey Home UPS Systems Volume (K) Forecast, by Application 2020 & 2033
- Table 63: Israel Home UPS Systems Revenue (million) Forecast, by Application 2020 & 2033
- Table 64: Israel Home UPS Systems Volume (K) Forecast, by Application 2020 & 2033
- Table 65: GCC Home UPS Systems Revenue (million) Forecast, by Application 2020 & 2033
- Table 66: GCC Home UPS Systems Volume (K) Forecast, by Application 2020 & 2033
- Table 67: North Africa Home UPS Systems Revenue (million) Forecast, by Application 2020 & 2033
- Table 68: North Africa Home UPS Systems Volume (K) Forecast, by Application 2020 & 2033
- Table 69: South Africa Home UPS Systems Revenue (million) Forecast, by Application 2020 & 2033
- Table 70: South Africa Home UPS Systems Volume (K) Forecast, by Application 2020 & 2033
- Table 71: Rest of Middle East & Africa Home UPS Systems Revenue (million) Forecast, by Application 2020 & 2033
- Table 72: Rest of Middle East & Africa Home UPS Systems Volume (K) Forecast, by Application 2020 & 2033
- Table 73: Global Home UPS Systems Revenue million Forecast, by Application 2020 & 2033
- Table 74: Global Home UPS Systems Volume K Forecast, by Application 2020 & 2033
- Table 75: Global Home UPS Systems Revenue million Forecast, by Types 2020 & 2033
- Table 76: Global Home UPS Systems Volume K Forecast, by Types 2020 & 2033
- Table 77: Global Home UPS Systems Revenue million Forecast, by Country 2020 & 2033
- Table 78: Global Home UPS Systems Volume K Forecast, by Country 2020 & 2033
- Table 79: China Home UPS Systems Revenue (million) Forecast, by Application 2020 & 2033
- Table 80: China Home UPS Systems Volume (K) Forecast, by Application 2020 & 2033
- Table 81: India Home UPS Systems Revenue (million) Forecast, by Application 2020 & 2033
- Table 82: India Home UPS Systems Volume (K) Forecast, by Application 2020 & 2033
- Table 83: Japan Home UPS Systems Revenue (million) Forecast, by Application 2020 & 2033
- Table 84: Japan Home UPS Systems Volume (K) Forecast, by Application 2020 & 2033
- Table 85: South Korea Home UPS Systems Revenue (million) Forecast, by Application 2020 & 2033
- Table 86: South Korea Home UPS Systems Volume (K) Forecast, by Application 2020 & 2033
- Table 87: ASEAN Home UPS Systems Revenue (million) Forecast, by Application 2020 & 2033
- Table 88: ASEAN Home UPS Systems Volume (K) Forecast, by Application 2020 & 2033
- Table 89: Oceania Home UPS Systems Revenue (million) Forecast, by Application 2020 & 2033
- Table 90: Oceania Home UPS Systems Volume (K) Forecast, by Application 2020 & 2033
- Table 91: Rest of Asia Pacific Home UPS Systems Revenue (million) Forecast, by Application 2020 & 2033
- Table 92: Rest of Asia Pacific Home UPS Systems Volume (K) Forecast, by Application 2020 & 2033
Frequently Asked Questions
1. What is the projected Compound Annual Growth Rate (CAGR) of the Home UPS Systems?
The projected CAGR is approximately 6.1%.
2. Which companies are prominent players in the Home UPS Systems?
Key companies in the market include Schneider Electric, EATON, Emerson, CyberPower, ABB, Activepower, Gamatronic, Kehua, KSTAR, PowerMan, SORO Electronics, Jeidar, Baykee, Jonchan, Zhicheng Champion.
3. What are the main segments of the Home UPS Systems?
The market segments include Application, Types.
4. Can you provide details about the market size?
The market size is estimated to be USD 1226.87 million as of 2022.
5. What are some drivers contributing to market growth?
N/A
6. What are the notable trends driving market growth?
N/A
7. Are there any restraints impacting market growth?
N/A
8. Can you provide examples of recent developments in the market?
N/A
9. What pricing options are available for accessing the report?
Pricing options include single-user, multi-user, and enterprise licenses priced at USD 3950.00, USD 5925.00, and USD 7900.00 respectively.
10. Is the market size provided in terms of value or volume?
The market size is provided in terms of value, measured in million and volume, measured in K.
11. Are there any specific market keywords associated with the report?
Yes, the market keyword associated with the report is "Home UPS Systems," which aids in identifying and referencing the specific market segment covered.
12. How do I determine which pricing option suits my needs best?
The pricing options vary based on user requirements and access needs. Individual users may opt for single-user licenses, while businesses requiring broader access may choose multi-user or enterprise licenses for cost-effective access to the report.
13. Are there any additional resources or data provided in the Home UPS Systems report?
While the report offers comprehensive insights, it's advisable to review the specific contents or supplementary materials provided to ascertain if additional resources or data are available.
14. How can I stay updated on further developments or reports in the Home UPS Systems?
To stay informed about further developments, trends, and reports in the Home UPS Systems, consider subscribing to industry newsletters, following relevant companies and organizations, or regularly checking reputable industry news sources and publications.
Methodology
Step 1 - Identification of Relevant Samples Size from Population Database


Step 2 - Approaches for Defining Global Market Size (Value, Volume* & Price*)

Note*: In applicable scenarios
Step 3 - Data Sources
Primary Research
- Web Analytics
- Survey Reports
- Research Institute
- Latest Research Reports
- Opinion Leaders
Secondary Research
- Annual Reports
- White Paper
- Latest Press Release
- Industry Association
- Paid Database
- Investor Presentations

Step 4 - Data Triangulation
Involves using different sources of information in order to increase the validity of a study
These sources are likely to be stakeholders in a program - participants, other researchers, program staff, other community members, and so on.
Then we put all data in single framework & apply various statistical tools to find out the dynamic on the market.
During the analysis stage, feedback from the stakeholder groups would be compared to determine areas of agreement as well as areas of divergence