

Key Insights
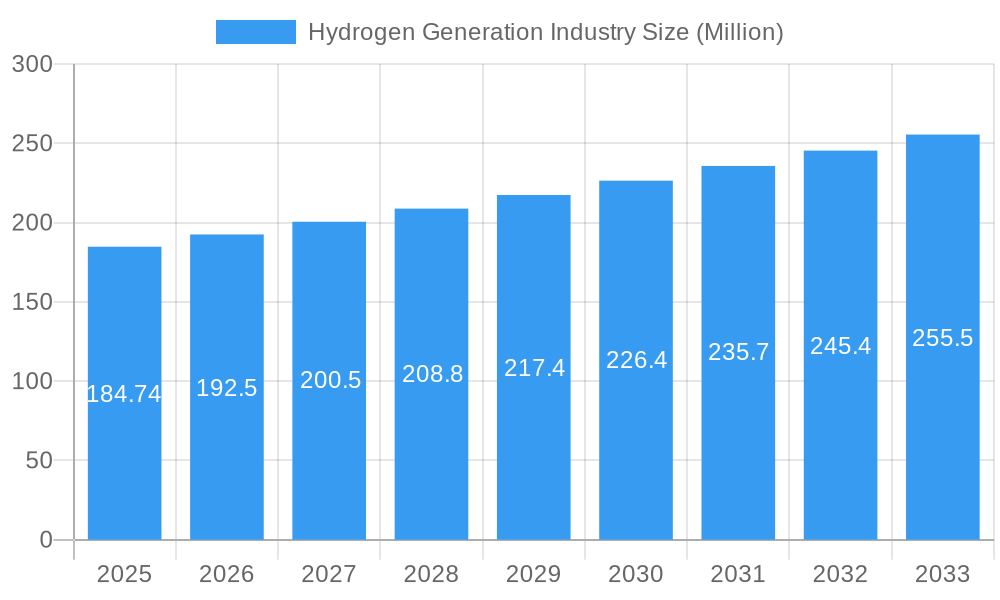
The global hydrogen generation market, valued at $184.74 million in 2025, is projected to experience robust growth, driven by the increasing demand for clean energy and its pivotal role in decarbonizing various sectors. A compound annual growth rate (CAGR) of 4.23% from 2025 to 2033 signifies a substantial market expansion, primarily fueled by the burgeoning green hydrogen segment. This segment's growth is propelled by stringent environmental regulations, government incentives promoting renewable energy adoption, and advancements in electrolysis technologies that are making green hydrogen production increasingly cost-competitive. Key applications like oil refining, chemical processing, and iron & steel production are significant drivers, as these industries seek to reduce their carbon footprints. While steam methane reforming (SMR) currently dominates the technology landscape, the market is witnessing a shift towards greener alternatives like electrolysis due to growing environmental concerns. Geographical expansion is also anticipated, with North America and Europe leading the charge initially, followed by a surge in demand from Asia Pacific driven by industrialization and government policies. However, the market faces challenges including the high initial investment costs associated with green hydrogen production and the need for robust infrastructure development to support widespread adoption.
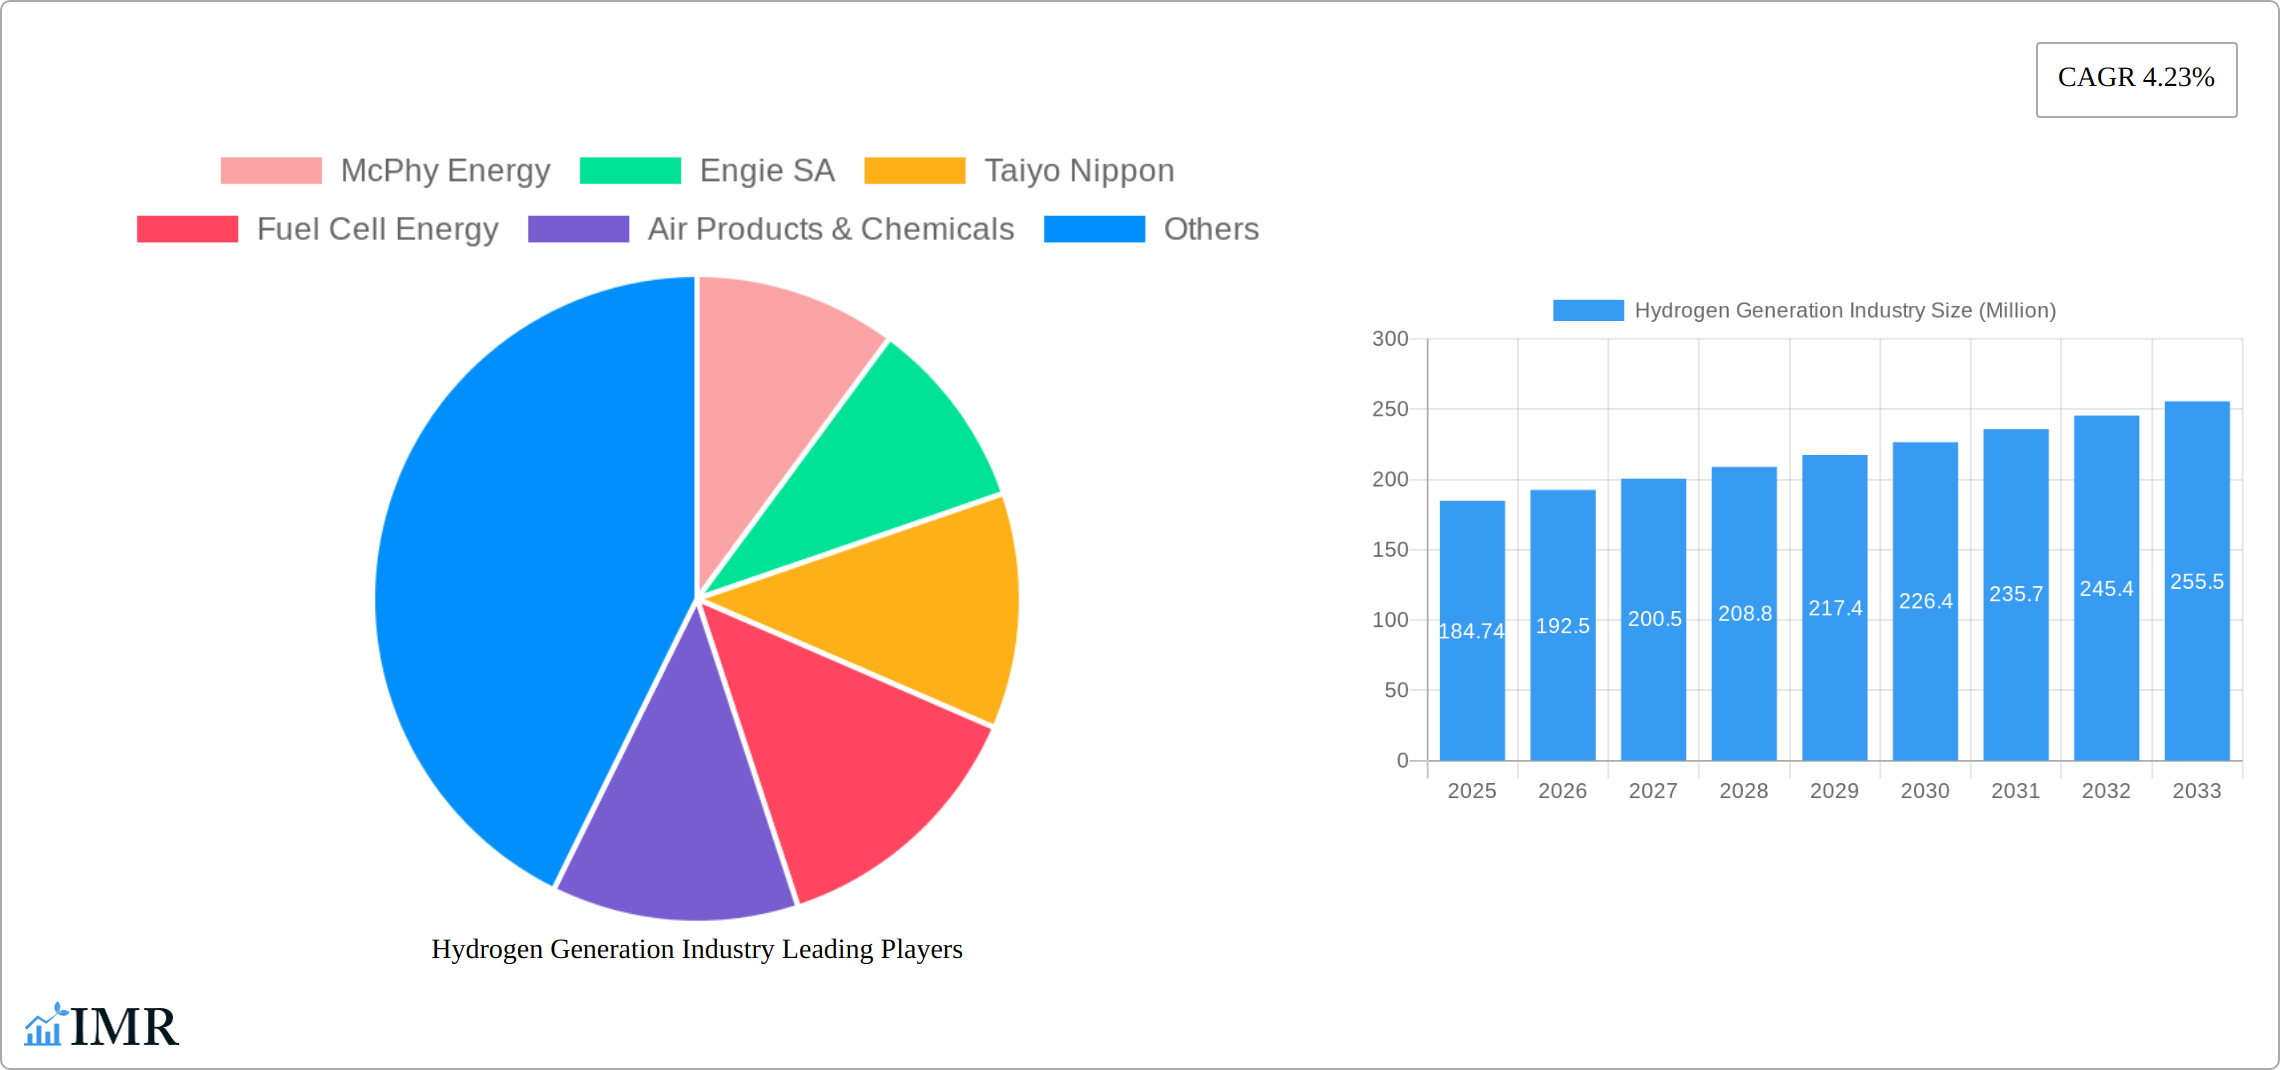
Hydrogen Generation Industry Market Size (In Million)
The competitive landscape is dynamic, featuring established players like Air Liquide, Linde plc, and Air Products & Chemicals alongside emerging companies like ITM Power and Enapter specializing in advanced electrolysis technologies. These companies are actively investing in research and development to improve efficiency, reduce costs, and expand their product offerings. The ongoing evolution of hydrogen generation technologies and the increasing focus on achieving carbon neutrality will shape the market's future trajectory. The strategic partnerships, mergers, and acquisitions within the sector are likely to increase as companies aim to gain a competitive edge and expedite the transition to a low-carbon economy. The forecast period of 2025-2033 suggests a period of considerable growth, marked by technological advancements, policy support, and growing demand from various industrial sectors.
Hydrogen Generation Industry Company Market Share
Hydrogen Generation Industry Market Report: 2019-2033
This comprehensive report provides a detailed analysis of the Hydrogen Generation Industry, encompassing market dynamics, growth trends, regional dominance, product landscape, key players, and future outlook. The study period covers 2019-2033, with 2025 as the base and estimated year. The report offers invaluable insights for industry professionals, investors, and stakeholders seeking to understand and capitalize on the burgeoning hydrogen economy. The market is segmented by source (Blue, Green, Grey hydrogen), technology (Steam Methane Reforming (SMR), Coal Gasification, Other Technologies), and application (Oil Refining, Chemical Processing, Iron & Steel Production, Other Applications). The total market size in 2025 is estimated at xx Million and is projected to reach xx Million by 2033.
Hydrogen Generation Industry Market Dynamics & Structure
The hydrogen generation market is undergoing a period of rapid transformation, fueled by technological breakthroughs, stricter environmental regulations, and the escalating demand for clean energy solutions. While market concentration remains moderate, with a few key players holding significant shares (e.g., the top 10 holding approximately [Insert Updated Percentage]% in 2025), the competitive landscape is rapidly evolving due to intensified competition and strategic collaborations. Technological innovation, especially in green hydrogen production via electrolysis, is a primary driver, complemented by the influence of regulatory frameworks, including carbon pricing mechanisms and subsidies for renewable energy projects. Traditional competitive substitutes, such as fossil fuels, face mounting pressure due to environmental concerns and increasing cost competitiveness of hydrogen. The end-user base is expanding beyond traditional energy-intensive industries to encompass transportation, building heating, and various other sectors. Mergers and acquisitions (M&A) are accelerating, with larger corporations acquiring smaller, innovative companies to bolster their technological capabilities and market penetration. This activity is projected at [Insert Updated Number] deals in 2024.
- Market Concentration: Moderate, with top 10 players holding approximately [Insert Updated Percentage]% market share in 2025. This is [Insert Analysis of Change, e.g., slightly increased/decreased from previous year].
- Technological Innovation: Rapid advancements in electrolysis and other green hydrogen technologies are significantly reducing production costs and improving efficiency, with particular advancements in [Mention Specific Advancements, e.g., alkaline, PEM, SOEC electrolyzers].
- Regulatory Frameworks: Government policies, including carbon taxes and renewable energy incentives (such as [Mention Specific Policies or Incentives]), are key market drivers, influencing investment decisions and technology adoption.
- Competitive Substitutes: Fossil fuels face increasing competition from hydrogen due to stricter environmental regulations and growing public awareness of climate change, evidenced by [Mention Specific Examples, e.g., policy changes, carbon pricing].
- End-User Demographics: Expanding rapidly beyond traditional industries to include transportation (fuel cell vehicles, maritime), building heating (residential and commercial), and industrial applications (refining, ammonia production), driving diversification in demand.
- M&A Trends: A rising number of mergers and acquisitions are consolidating market share and accelerating technological advancements, estimated at [Insert Updated Number] deals in 2024, indicating a trend towards [Describe the Trend, e.g., vertical integration, geographical expansion].
Hydrogen Generation Industry Growth Trends & Insights
The hydrogen generation market is witnessing robust growth, driven by several factors. The increasing demand for clean energy solutions due to growing environmental concerns and stringent government regulations is fueling the adoption of hydrogen as a clean energy carrier. The market is further propelled by technological advancements that are leading to decreased production costs and increased efficiency in hydrogen generation. The global shift towards decarbonization is also significantly impacting consumer behavior, leading to a rising demand for cleaner energy sources. Furthermore, substantial investments in research and development are fostering innovation and driving down costs. The market experienced a CAGR of xx% during 2019-2024 and is projected to grow at a CAGR of xx% during 2025-2033. Market penetration is expected to increase from xx% in 2025 to xx% by 2033.
Dominant Regions, Countries, or Segments in Hydrogen Generation Industry
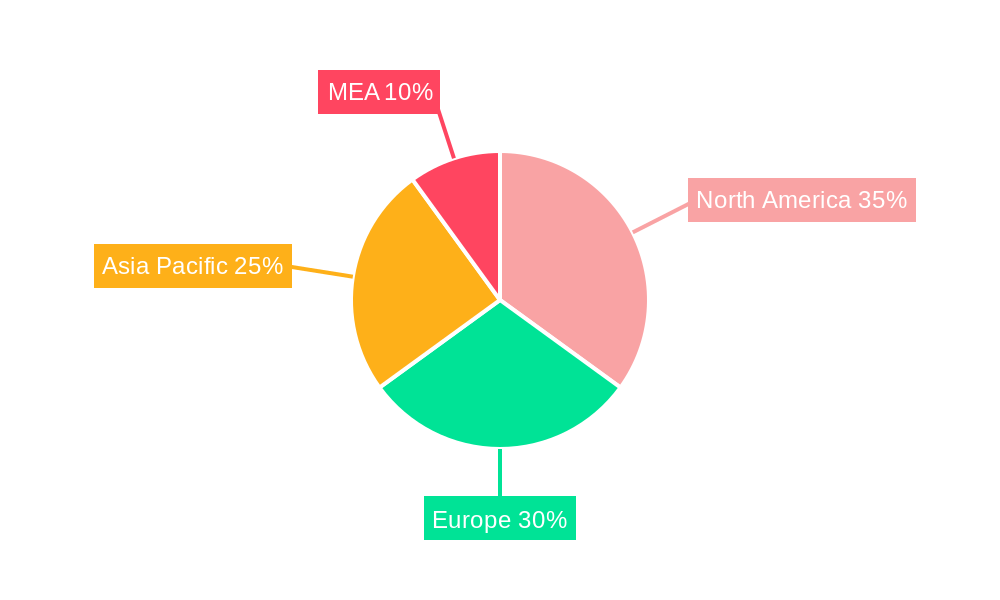
The hydrogen generation market exhibits diverse regional growth patterns. Europe and North America are currently leading the market due to robust policy support, early adoption of green hydrogen technologies, and significant investments in renewable energy infrastructure. However, Asia-Pacific is projected to witness significant growth in the coming years, driven by rapidly growing economies and large-scale industrial applications. The Green hydrogen segment is the fastest-growing segment, driven by increased environmental awareness and government incentives. Within technologies, Electrolysis is witnessing the highest growth, and within applications, the industrial segment (Oil Refining, Chemical Processing, Iron & Steel) is the major driver.
- Key Drivers:
- Europe: Strong policy support, significant investments in renewable energy infrastructure.
- North America: Growing demand for clean energy, technological advancements in green hydrogen production.
- Asia-Pacific: Rapid economic growth, large-scale industrial applications.
- Green Hydrogen Segment: Increased environmental awareness, government incentives, and decreasing production costs.
- Electrolysis Technology: High efficiency, scalability, and potential for integration with renewable energy sources.
- Industrial Applications: High energy demand from sectors like Oil Refining, Chemical Processing, Iron & Steel.
Hydrogen Generation Industry Product Landscape
The hydrogen generation industry boasts a diverse product portfolio encompassing various production technologies, from established steam methane reforming to cutting-edge electrolysis systems (including alkaline, PEM, and SOEC). Key innovations involve enhanced electrolyzer efficiency, the development of cost-effective catalysts, and the seamless integration of hydrogen production with renewable energy sources. Products are tailored to meet specific application demands, prioritizing energy efficiency, environmental sustainability, and safety. Competitive advantages often include high-purity hydrogen output, compact system designs, and effortless integration with existing infrastructure. Ongoing technological progress consistently improves the energy efficiency, durability, and scalability of hydrogen generation systems. This is leading to [Mention Specific Impact, e.g., reduced capital expenditure, higher output].
Key Drivers, Barriers & Challenges in Hydrogen Generation Industry
Key Drivers:
- Growing concerns about climate change and the need for decarbonization.
- Increasing government regulations and incentives for renewable energy adoption.
- Technological advancements leading to cost reduction and increased efficiency in hydrogen production.
- Rising demand for hydrogen in various sectors, including transportation, industrial processes, and energy storage.
Challenges & Restraints:
- High capital costs associated with hydrogen production infrastructure.
- Intermittency and variability of renewable energy sources used for green hydrogen production.
- Lack of widespread hydrogen storage and distribution infrastructure.
- Competition from traditional fossil fuels and other alternative energy sources. The competitive pressure is estimated to reduce market growth by xx% by 2030.
Emerging Opportunities in Hydrogen Generation Industry
- Market Expansion: Significant opportunities exist in developing economies with substantial industrial energy demands, particularly in [Mention Specific Regions or Countries].
- Innovative Applications: Developing and commercializing hydrogen applications in sectors such as heavy-duty transportation (trucks, trains), long-haul shipping, and large-scale building heating presents substantial growth potential.
- Technological Advancements: Leveraging advancements in materials science (e.g., improved membranes, catalysts) and artificial intelligence (AI) for process optimization and predictive maintenance will further enhance efficiency and reduce costs.
- Hydrogen Storage and Transportation: Exploring and implementing innovative hydrogen storage solutions (e.g., liquid hydrogen, metal hydrides) and transportation methods (e.g., pipelines, specialized tankers) is crucial for widespread adoption.
- Power-to-X: Integrating hydrogen production with other energy vectors such as ammonia and methanol production offers diversified revenue streams and enhanced market resilience.
Growth Accelerators in the Hydrogen Generation Industry
Technological breakthroughs are accelerating market growth, particularly advancements in electrolysis which reduce production costs and improve efficiency. Strategic partnerships between energy companies, technology providers, and industrial users are streamlining the value chain and enhancing market penetration. Government policies supporting green hydrogen production and infrastructure development are playing a crucial role. Market expansion strategies focusing on emerging economies and new applications are further fueling growth.
Key Players Shaping the Hydrogen Generation Industry Market
Notable Milestones in Hydrogen Generation Industry Sector
- October 2023: H2B2 unveils the SoHyCal green hydrogen plant in Fresno, California, utilizing PEM technology, marking a significant step towards [Mention Significance, e.g., large-scale green hydrogen production in the US].
- October 2023: Hygenco Green Energies announces plans for a green H2 plant in Maharashtra, India, supplying green hydrogen and oxygen to Sterlite Technologies Ltd., highlighting the growing adoption of green hydrogen in [Mention Sector, e.g., industrial processes].
- May 2023: RWE and Westfalen Group announce plans to develop up to 70 hydrogen fueling stations in Germany by 2030, demonstrating a commitment to [Mention Significance, e.g., hydrogen mobility infrastructure development].
- [Add more recent milestones]
In-Depth Hydrogen Generation Industry Market Outlook
The future of the hydrogen generation industry appears exceptionally promising. Continuous technological advancements, supportive government policies (including [Mention Specific Policies]), and rising environmental awareness are collectively driving substantial market expansion. Strategic partnerships and investments in crucial infrastructure development (such as [Mention Specific Infrastructure, e.g., pipelines, electrolyzer manufacturing]) will further accelerate growth. The market is expected to witness increasing diversification across applications and regions, creating significant opportunities for innovation and investment. The long-term outlook projects a considerable increase in market size and widespread adoption of hydrogen as a clean, sustainable energy solution, with significant potential for [Mention specific future applications or market segments].
Hydrogen Generation Industry Segmentation
-
1. Source
- 1.1. Blue hydrogen
- 1.2. Green hydrogen
- 1.3. Grey Hydrogen
-
2. Technology
- 2.1. Steam Methane Reforming (SMR)
- 2.2. Coal Gasification
- 2.3. Other Technologies
-
3. Application
- 3.1. Oil Refining
- 3.2. Chemical Processing
- 3.3. Iron & Steel Production
- 3.4. Other Applications
Hydrogen Generation Industry Segmentation By Geography
-
1. North America
- 1.1. United States
- 1.2. Canada
- 1.3. Rest of North America
-
2. Europe
- 2.1. Germany
- 2.2. France
- 2.3. Italy
- 2.4. United Kingdom
- 2.5. Russian Federation
- 2.6. Rest of Europe
- 3. Middle East
-
4. Saudi Arabia
- 4.1. United Arab Emirates
- 4.2. South Africa
- 4.3. Rest of Middle East and Africa
-
5. Asia Pacific
- 5.1. China
- 5.2. India
- 5.3. Japan
- 5.4. South Korea
- 5.5. Rest of Asia Pacific
-
6. South America
- 6.1. Brazil
- 6.2. Argentina
- 6.3. Rest of South America
Hydrogen Generation Industry Regional Market Share
Geographic Coverage of Hydrogen Generation Industry
Hydrogen Generation Industry REPORT HIGHLIGHTS
| Aspects | Details |
|---|---|
| Study Period | 2020-2034 |
| Base Year | 2025 |
| Estimated Year | 2026 |
| Forecast Period | 2026-2034 |
| Historical Period | 2020-2025 |
| Growth Rate | CAGR of 4.23% from 2020-2034 |
| Segmentation |
|
Table of Contents
- 1. Introduction
- 1.1. Research Scope
- 1.2. Market Segmentation
- 1.3. Research Objective
- 1.4. Definitions and Assumptions
- 2. Executive Summary
- 2.1. Market Snapshot
- 3. Market Dynamics
- 3.1. Market Drivers
- 3.2. Market Restrains
- 3.3. Market Trends
- 3.4. Market Opportunities
- 4. Market Factor Analysis
- 4.1. Porters Five Forces
- 4.1.1. Bargaining Power of Suppliers
- 4.1.2. Bargaining Power of Buyers
- 4.1.3. Threat of New Entrants
- 4.1.4. Threat of Substitutes
- 4.1.5. Competitive Rivalry
- 4.2. PESTEL analysis
- 4.3. BCG Analysis
- 4.3.1. Stars (High Growth, High Market Share)
- 4.3.2. Cash Cows (Low Growth, High Market Share)
- 4.3.3. Question Mark (High Growth, Low Market Share)
- 4.3.4. Dogs (Low Growth, Low Market Share)
- 4.4. Ansoff Matrix Analysis
- 4.5. Supply Chain Analysis
- 4.6. Regulatory Landscape
- 4.7. Current Market Potential and Opportunity Assessment (TAM–SAM–SOM Framework)
- 4.8. IMR Analyst Note
- 4.1. Porters Five Forces
- 5. Market Analysis, Insights and Forecast 2021-2033
- 5.1. Market Analysis, Insights and Forecast - by Source
- 5.1.1. Blue hydrogen
- 5.1.2. Green hydrogen
- 5.1.3. Grey Hydrogen
- 5.2. Market Analysis, Insights and Forecast - by Technology
- 5.2.1. Steam Methane Reforming (SMR)
- 5.2.2. Coal Gasification
- 5.2.3. Other Technologies
- 5.3. Market Analysis, Insights and Forecast - by Application
- 5.3.1. Oil Refining
- 5.3.2. Chemical Processing
- 5.3.3. Iron & Steel Production
- 5.3.4. Other Applications
- 5.4. Market Analysis, Insights and Forecast - by Region
- 5.4.1. North America
- 5.4.2. Europe
- 5.4.3. Middle East
- 5.4.4. Saudi Arabia
- 5.4.5. Asia Pacific
- 5.4.6. South America
- 5.1. Market Analysis, Insights and Forecast - by Source
- 6. Global Hydrogen Generation Industry Analysis, Insights and Forecast, 2021-2033
- 6.1. Market Analysis, Insights and Forecast - by Source
- 6.1.1. Blue hydrogen
- 6.1.2. Green hydrogen
- 6.1.3. Grey Hydrogen
- 6.2. Market Analysis, Insights and Forecast - by Technology
- 6.2.1. Steam Methane Reforming (SMR)
- 6.2.2. Coal Gasification
- 6.2.3. Other Technologies
- 6.3. Market Analysis, Insights and Forecast - by Application
- 6.3.1. Oil Refining
- 6.3.2. Chemical Processing
- 6.3.3. Iron & Steel Production
- 6.3.4. Other Applications
- 6.1. Market Analysis, Insights and Forecast - by Source
- 7. North America Hydrogen Generation Industry Analysis, Insights and Forecast, 2020-2032
- 7.1. Market Analysis, Insights and Forecast - by Source
- 7.1.1. Blue hydrogen
- 7.1.2. Green hydrogen
- 7.1.3. Grey Hydrogen
- 7.2. Market Analysis, Insights and Forecast - by Technology
- 7.2.1. Steam Methane Reforming (SMR)
- 7.2.2. Coal Gasification
- 7.2.3. Other Technologies
- 7.3. Market Analysis, Insights and Forecast - by Application
- 7.3.1. Oil Refining
- 7.3.2. Chemical Processing
- 7.3.3. Iron & Steel Production
- 7.3.4. Other Applications
- 7.1. Market Analysis, Insights and Forecast - by Source
- 8. Europe Hydrogen Generation Industry Analysis, Insights and Forecast, 2020-2032
- 8.1. Market Analysis, Insights and Forecast - by Source
- 8.1.1. Blue hydrogen
- 8.1.2. Green hydrogen
- 8.1.3. Grey Hydrogen
- 8.2. Market Analysis, Insights and Forecast - by Technology
- 8.2.1. Steam Methane Reforming (SMR)
- 8.2.2. Coal Gasification
- 8.2.3. Other Technologies
- 8.3. Market Analysis, Insights and Forecast - by Application
- 8.3.1. Oil Refining
- 8.3.2. Chemical Processing
- 8.3.3. Iron & Steel Production
- 8.3.4. Other Applications
- 8.1. Market Analysis, Insights and Forecast - by Source
- 9. Middle East Hydrogen Generation Industry Analysis, Insights and Forecast, 2020-2032
- 9.1. Market Analysis, Insights and Forecast - by Source
- 9.1.1. Blue hydrogen
- 9.1.2. Green hydrogen
- 9.1.3. Grey Hydrogen
- 9.2. Market Analysis, Insights and Forecast - by Technology
- 9.2.1. Steam Methane Reforming (SMR)
- 9.2.2. Coal Gasification
- 9.2.3. Other Technologies
- 9.3. Market Analysis, Insights and Forecast - by Application
- 9.3.1. Oil Refining
- 9.3.2. Chemical Processing
- 9.3.3. Iron & Steel Production
- 9.3.4. Other Applications
- 9.1. Market Analysis, Insights and Forecast - by Source
- 10. Saudi Arabia Hydrogen Generation Industry Analysis, Insights and Forecast, 2020-2032
- 10.1. Market Analysis, Insights and Forecast - by Source
- 10.1.1. Blue hydrogen
- 10.1.2. Green hydrogen
- 10.1.3. Grey Hydrogen
- 10.2. Market Analysis, Insights and Forecast - by Technology
- 10.2.1. Steam Methane Reforming (SMR)
- 10.2.2. Coal Gasification
- 10.2.3. Other Technologies
- 10.3. Market Analysis, Insights and Forecast - by Application
- 10.3.1. Oil Refining
- 10.3.2. Chemical Processing
- 10.3.3. Iron & Steel Production
- 10.3.4. Other Applications
- 10.1. Market Analysis, Insights and Forecast - by Source
- 11. Asia Pacific Hydrogen Generation Industry Analysis, Insights and Forecast, 2020-2032
- 11.1. Market Analysis, Insights and Forecast - by Source
- 11.1.1. Blue hydrogen
- 11.1.2. Green hydrogen
- 11.1.3. Grey Hydrogen
- 11.2. Market Analysis, Insights and Forecast - by Technology
- 11.2.1. Steam Methane Reforming (SMR)
- 11.2.2. Coal Gasification
- 11.2.3. Other Technologies
- 11.3. Market Analysis, Insights and Forecast - by Application
- 11.3.1. Oil Refining
- 11.3.2. Chemical Processing
- 11.3.3. Iron & Steel Production
- 11.3.4. Other Applications
- 11.1. Market Analysis, Insights and Forecast - by Source
- 12. South America Hydrogen Generation Industry Analysis, Insights and Forecast, 2020-2032
- 12.1. Market Analysis, Insights and Forecast - by Source
- 12.1.1. Blue hydrogen
- 12.1.2. Green hydrogen
- 12.1.3. Grey Hydrogen
- 12.2. Market Analysis, Insights and Forecast - by Technology
- 12.2.1. Steam Methane Reforming (SMR)
- 12.2.2. Coal Gasification
- 12.2.3. Other Technologies
- 12.3. Market Analysis, Insights and Forecast - by Application
- 12.3.1. Oil Refining
- 12.3.2. Chemical Processing
- 12.3.3. Iron & Steel Production
- 12.3.4. Other Applications
- 12.1. Market Analysis, Insights and Forecast - by Source
- 13. Competitive Analysis
- 13.1. Company Profiles
- 13.1.1 McPhy Energy
- 13.1.1.1. Company Overview
- 13.1.1.2. Products
- 13.1.1.3. Company Financials
- 13.1.1.4. SWOT Analysis
- 13.1.2 Engie SA
- 13.1.2.1. Company Overview
- 13.1.2.2. Products
- 13.1.2.3. Company Financials
- 13.1.2.4. SWOT Analysis
- 13.1.3 Taiyo Nippon
- 13.1.3.1. Company Overview
- 13.1.3.2. Products
- 13.1.3.3. Company Financials
- 13.1.3.4. SWOT Analysis
- 13.1.4 Fuel Cell Energy
- 13.1.4.1. Company Overview
- 13.1.4.2. Products
- 13.1.4.3. Company Financials
- 13.1.4.4. SWOT Analysis
- 13.1.5 Air Products & Chemicals
- 13.1.5.1. Company Overview
- 13.1.5.2. Products
- 13.1.5.3. Company Financials
- 13.1.5.4. SWOT Analysis
- 13.1.6 Linde plc
- 13.1.6.1. Company Overview
- 13.1.6.2. Products
- 13.1.6.3. Company Financials
- 13.1.6.4. SWOT Analysis
- 13.1.7 Cummins
- 13.1.7.1. Company Overview
- 13.1.7.2. Products
- 13.1.7.3. Company Financials
- 13.1.7.4. SWOT Analysis
- 13.1.8 Messer Group GmbH
- 13.1.8.1. Company Overview
- 13.1.8.2. Products
- 13.1.8.3. Company Financials
- 13.1.8.4. SWOT Analysis
- 13.1.9 Air Liquide
- 13.1.9.1. Company Overview
- 13.1.9.2. Products
- 13.1.9.3. Company Financials
- 13.1.9.4. SWOT Analysis
- 13.1.10 ITM Power plc
- 13.1.10.1. Company Overview
- 13.1.10.2. Products
- 13.1.10.3. Company Financials
- 13.1.10.4. SWOT Analysis
- 13.1.11 Enapter
- 13.1.11.1. Company Overview
- 13.1.11.2. Products
- 13.1.11.3. Company Financials
- 13.1.11.4. SWOT Analysis
- 13.1.1 McPhy Energy
- 13.2. Market Entropy
- 13.2.1 Company's Key Areas Served
- 13.2.2 Recent Developments
- 13.3. Company Market Share Analysis 2025
- 13.3.1 Top 5 Companies Market Share Analysis
- 13.3.2 Top 3 Companies Market Share Analysis
- 13.4. List of Potential Customers
- 14. Research Methodology
List of Figures
- Figure 1: Global Hydrogen Generation Industry Revenue Breakdown (Million, %) by Region 2025 & 2033
- Figure 2: North America Hydrogen Generation Industry Revenue (Million), by Source 2025 & 2033
- Figure 3: North America Hydrogen Generation Industry Revenue Share (%), by Source 2025 & 2033
- Figure 4: North America Hydrogen Generation Industry Revenue (Million), by Technology 2025 & 2033
- Figure 5: North America Hydrogen Generation Industry Revenue Share (%), by Technology 2025 & 2033
- Figure 6: North America Hydrogen Generation Industry Revenue (Million), by Application 2025 & 2033
- Figure 7: North America Hydrogen Generation Industry Revenue Share (%), by Application 2025 & 2033
- Figure 8: North America Hydrogen Generation Industry Revenue (Million), by Country 2025 & 2033
- Figure 9: North America Hydrogen Generation Industry Revenue Share (%), by Country 2025 & 2033
- Figure 10: Europe Hydrogen Generation Industry Revenue (Million), by Source 2025 & 2033
- Figure 11: Europe Hydrogen Generation Industry Revenue Share (%), by Source 2025 & 2033
- Figure 12: Europe Hydrogen Generation Industry Revenue (Million), by Technology 2025 & 2033
- Figure 13: Europe Hydrogen Generation Industry Revenue Share (%), by Technology 2025 & 2033
- Figure 14: Europe Hydrogen Generation Industry Revenue (Million), by Application 2025 & 2033
- Figure 15: Europe Hydrogen Generation Industry Revenue Share (%), by Application 2025 & 2033
- Figure 16: Europe Hydrogen Generation Industry Revenue (Million), by Country 2025 & 2033
- Figure 17: Europe Hydrogen Generation Industry Revenue Share (%), by Country 2025 & 2033
- Figure 18: Middle East Hydrogen Generation Industry Revenue (Million), by Source 2025 & 2033
- Figure 19: Middle East Hydrogen Generation Industry Revenue Share (%), by Source 2025 & 2033
- Figure 20: Middle East Hydrogen Generation Industry Revenue (Million), by Technology 2025 & 2033
- Figure 21: Middle East Hydrogen Generation Industry Revenue Share (%), by Technology 2025 & 2033
- Figure 22: Middle East Hydrogen Generation Industry Revenue (Million), by Application 2025 & 2033
- Figure 23: Middle East Hydrogen Generation Industry Revenue Share (%), by Application 2025 & 2033
- Figure 24: Middle East Hydrogen Generation Industry Revenue (Million), by Country 2025 & 2033
- Figure 25: Middle East Hydrogen Generation Industry Revenue Share (%), by Country 2025 & 2033
- Figure 26: Saudi Arabia Hydrogen Generation Industry Revenue (Million), by Source 2025 & 2033
- Figure 27: Saudi Arabia Hydrogen Generation Industry Revenue Share (%), by Source 2025 & 2033
- Figure 28: Saudi Arabia Hydrogen Generation Industry Revenue (Million), by Technology 2025 & 2033
- Figure 29: Saudi Arabia Hydrogen Generation Industry Revenue Share (%), by Technology 2025 & 2033
- Figure 30: Saudi Arabia Hydrogen Generation Industry Revenue (Million), by Application 2025 & 2033
- Figure 31: Saudi Arabia Hydrogen Generation Industry Revenue Share (%), by Application 2025 & 2033
- Figure 32: Saudi Arabia Hydrogen Generation Industry Revenue (Million), by Country 2025 & 2033
- Figure 33: Saudi Arabia Hydrogen Generation Industry Revenue Share (%), by Country 2025 & 2033
- Figure 34: Asia Pacific Hydrogen Generation Industry Revenue (Million), by Source 2025 & 2033
- Figure 35: Asia Pacific Hydrogen Generation Industry Revenue Share (%), by Source 2025 & 2033
- Figure 36: Asia Pacific Hydrogen Generation Industry Revenue (Million), by Technology 2025 & 2033
- Figure 37: Asia Pacific Hydrogen Generation Industry Revenue Share (%), by Technology 2025 & 2033
- Figure 38: Asia Pacific Hydrogen Generation Industry Revenue (Million), by Application 2025 & 2033
- Figure 39: Asia Pacific Hydrogen Generation Industry Revenue Share (%), by Application 2025 & 2033
- Figure 40: Asia Pacific Hydrogen Generation Industry Revenue (Million), by Country 2025 & 2033
- Figure 41: Asia Pacific Hydrogen Generation Industry Revenue Share (%), by Country 2025 & 2033
- Figure 42: South America Hydrogen Generation Industry Revenue (Million), by Source 2025 & 2033
- Figure 43: South America Hydrogen Generation Industry Revenue Share (%), by Source 2025 & 2033
- Figure 44: South America Hydrogen Generation Industry Revenue (Million), by Technology 2025 & 2033
- Figure 45: South America Hydrogen Generation Industry Revenue Share (%), by Technology 2025 & 2033
- Figure 46: South America Hydrogen Generation Industry Revenue (Million), by Application 2025 & 2033
- Figure 47: South America Hydrogen Generation Industry Revenue Share (%), by Application 2025 & 2033
- Figure 48: South America Hydrogen Generation Industry Revenue (Million), by Country 2025 & 2033
- Figure 49: South America Hydrogen Generation Industry Revenue Share (%), by Country 2025 & 2033
List of Tables
- Table 1: Global Hydrogen Generation Industry Revenue Million Forecast, by Source 2020 & 2033
- Table 2: Global Hydrogen Generation Industry Revenue Million Forecast, by Technology 2020 & 2033
- Table 3: Global Hydrogen Generation Industry Revenue Million Forecast, by Application 2020 & 2033
- Table 4: Global Hydrogen Generation Industry Revenue Million Forecast, by Region 2020 & 2033
- Table 5: Global Hydrogen Generation Industry Revenue Million Forecast, by Source 2020 & 2033
- Table 6: Global Hydrogen Generation Industry Revenue Million Forecast, by Technology 2020 & 2033
- Table 7: Global Hydrogen Generation Industry Revenue Million Forecast, by Application 2020 & 2033
- Table 8: Global Hydrogen Generation Industry Revenue Million Forecast, by Country 2020 & 2033
- Table 9: United States Hydrogen Generation Industry Revenue (Million) Forecast, by Application 2020 & 2033
- Table 10: Canada Hydrogen Generation Industry Revenue (Million) Forecast, by Application 2020 & 2033
- Table 11: Rest of North America Hydrogen Generation Industry Revenue (Million) Forecast, by Application 2020 & 2033
- Table 12: Global Hydrogen Generation Industry Revenue Million Forecast, by Source 2020 & 2033
- Table 13: Global Hydrogen Generation Industry Revenue Million Forecast, by Technology 2020 & 2033
- Table 14: Global Hydrogen Generation Industry Revenue Million Forecast, by Application 2020 & 2033
- Table 15: Global Hydrogen Generation Industry Revenue Million Forecast, by Country 2020 & 2033
- Table 16: Germany Hydrogen Generation Industry Revenue (Million) Forecast, by Application 2020 & 2033
- Table 17: France Hydrogen Generation Industry Revenue (Million) Forecast, by Application 2020 & 2033
- Table 18: Italy Hydrogen Generation Industry Revenue (Million) Forecast, by Application 2020 & 2033
- Table 19: United Kingdom Hydrogen Generation Industry Revenue (Million) Forecast, by Application 2020 & 2033
- Table 20: Russian Federation Hydrogen Generation Industry Revenue (Million) Forecast, by Application 2020 & 2033
- Table 21: Rest of Europe Hydrogen Generation Industry Revenue (Million) Forecast, by Application 2020 & 2033
- Table 22: Global Hydrogen Generation Industry Revenue Million Forecast, by Source 2020 & 2033
- Table 23: Global Hydrogen Generation Industry Revenue Million Forecast, by Technology 2020 & 2033
- Table 24: Global Hydrogen Generation Industry Revenue Million Forecast, by Application 2020 & 2033
- Table 25: Global Hydrogen Generation Industry Revenue Million Forecast, by Country 2020 & 2033
- Table 26: Global Hydrogen Generation Industry Revenue Million Forecast, by Source 2020 & 2033
- Table 27: Global Hydrogen Generation Industry Revenue Million Forecast, by Technology 2020 & 2033
- Table 28: Global Hydrogen Generation Industry Revenue Million Forecast, by Application 2020 & 2033
- Table 29: Global Hydrogen Generation Industry Revenue Million Forecast, by Country 2020 & 2033
- Table 30: United Arab Emirates Hydrogen Generation Industry Revenue (Million) Forecast, by Application 2020 & 2033
- Table 31: South Africa Hydrogen Generation Industry Revenue (Million) Forecast, by Application 2020 & 2033
- Table 32: Rest of Middle East and Africa Hydrogen Generation Industry Revenue (Million) Forecast, by Application 2020 & 2033
- Table 33: Global Hydrogen Generation Industry Revenue Million Forecast, by Source 2020 & 2033
- Table 34: Global Hydrogen Generation Industry Revenue Million Forecast, by Technology 2020 & 2033
- Table 35: Global Hydrogen Generation Industry Revenue Million Forecast, by Application 2020 & 2033
- Table 36: Global Hydrogen Generation Industry Revenue Million Forecast, by Country 2020 & 2033
- Table 37: China Hydrogen Generation Industry Revenue (Million) Forecast, by Application 2020 & 2033
- Table 38: India Hydrogen Generation Industry Revenue (Million) Forecast, by Application 2020 & 2033
- Table 39: Japan Hydrogen Generation Industry Revenue (Million) Forecast, by Application 2020 & 2033
- Table 40: South Korea Hydrogen Generation Industry Revenue (Million) Forecast, by Application 2020 & 2033
- Table 41: Rest of Asia Pacific Hydrogen Generation Industry Revenue (Million) Forecast, by Application 2020 & 2033
- Table 42: Global Hydrogen Generation Industry Revenue Million Forecast, by Source 2020 & 2033
- Table 43: Global Hydrogen Generation Industry Revenue Million Forecast, by Technology 2020 & 2033
- Table 44: Global Hydrogen Generation Industry Revenue Million Forecast, by Application 2020 & 2033
- Table 45: Global Hydrogen Generation Industry Revenue Million Forecast, by Country 2020 & 2033
- Table 46: Brazil Hydrogen Generation Industry Revenue (Million) Forecast, by Application 2020 & 2033
- Table 47: Argentina Hydrogen Generation Industry Revenue (Million) Forecast, by Application 2020 & 2033
- Table 48: Rest of South America Hydrogen Generation Industry Revenue (Million) Forecast, by Application 2020 & 2033
Frequently Asked Questions
1. What is the projected Compound Annual Growth Rate (CAGR) of the Hydrogen Generation Industry?
The projected CAGR is approximately 4.23%.
2. Which companies are prominent players in the Hydrogen Generation Industry?
Key companies in the market include McPhy Energy, Engie SA, Taiyo Nippon, Fuel Cell Energy, Air Products & Chemicals, Linde plc, Cummins, Messer Group GmbH, Air Liquide, ITM Power plc, Enapter.
3. What are the main segments of the Hydrogen Generation Industry?
The market segments include Source, Technology, Application.
4. Can you provide details about the market size?
The market size is estimated to be USD 184.74 Million as of 2022.
5. What are some drivers contributing to market growth?
4.; Favorable Government Policies4.; Increasing Demand From Refinery and Industrial Sector.
6. What are the notable trends driving market growth?
Oil Refining Segment Expected to Dominate the Market.
7. Are there any restraints impacting market growth?
4.; Higher Production Cost.
8. Can you provide examples of recent developments in the market?
October 2023: H2B2, a technology company with a portfolio in Hydrogen production systems, unveiled the green hydrogen plant, which is expected to become operational in North America, the SoHyCal facility located in Fresno, California, United States. The project envisages 100 percent clean hydrogen production using PEM technology.
9. What pricing options are available for accessing the report?
Pricing options include single-user, multi-user, and enterprise licenses priced at USD 4750, USD 5250, and USD 8750 respectively.
10. Is the market size provided in terms of value or volume?
The market size is provided in terms of value, measured in Million.
11. Are there any specific market keywords associated with the report?
Yes, the market keyword associated with the report is "Hydrogen Generation Industry," which aids in identifying and referencing the specific market segment covered.
12. How do I determine which pricing option suits my needs best?
The pricing options vary based on user requirements and access needs. Individual users may opt for single-user licenses, while businesses requiring broader access may choose multi-user or enterprise licenses for cost-effective access to the report.
13. Are there any additional resources or data provided in the Hydrogen Generation Industry report?
While the report offers comprehensive insights, it's advisable to review the specific contents or supplementary materials provided to ascertain if additional resources or data are available.
14. How can I stay updated on further developments or reports in the Hydrogen Generation Industry?
To stay informed about further developments, trends, and reports in the Hydrogen Generation Industry, consider subscribing to industry newsletters, following relevant companies and organizations, or regularly checking reputable industry news sources and publications.
Methodology
Step 1 - Identification of Relevant Samples Size from Population Database


Step 2 - Approaches for Defining Global Market Size (Value, Volume* & Price*)

Note*: In applicable scenarios
Step 3 - Data Sources
Primary Research
- Web Analytics
- Survey Reports
- Research Institute
- Latest Research Reports
- Opinion Leaders
Secondary Research
- Annual Reports
- White Paper
- Latest Press Release
- Industry Association
- Paid Database
- Investor Presentations

Step 4 - Data Triangulation
Involves using different sources of information in order to increase the validity of a study
These sources are likely to be stakeholders in a program - participants, other researchers, program staff, other community members, and so on.
Then we put all data in single framework & apply various statistical tools to find out the dynamic on the market.
During the analysis stage, feedback from the stakeholder groups would be compared to determine areas of agreement as well as areas of divergence