

Key Insights
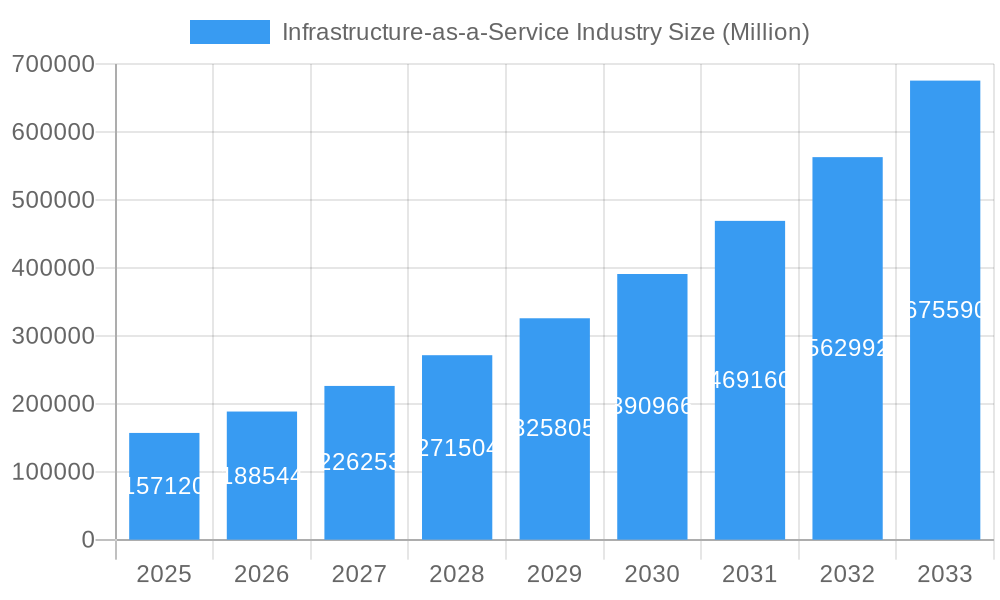
The Infrastructure-as-a-Service (IaaS) market is experiencing robust growth, projected to reach a substantial size. The compound annual growth rate (CAGR) of 20.01% from 2019 to 2024 indicates a significant expansion driven by several key factors. The increasing adoption of cloud computing across diverse industries, including BFSI, IT & Telecom, Healthcare, Media & Entertainment, and Retail, is a primary driver. Businesses are increasingly seeking scalability, cost-efficiency, and agility offered by IaaS solutions, migrating from traditional on-premise infrastructure. Furthermore, the rise of big data analytics, artificial intelligence, and the Internet of Things (IoT) necessitates robust and scalable cloud infrastructure, further fueling market demand. The diverse service offerings within IaaS, encompassing managed hosting, Disaster Recovery as a Service (DRaaS), Communication as a Service (CaaS), Database as a Service (DBaaS), and Storage as a Service (SaaS), cater to a wide range of business needs. The market is segmented by deployment mode (public, private, and hybrid cloud), allowing organizations to choose the model best suited to their security and operational requirements. While specific challenges such as data security concerns and vendor lock-in exist, the overall market trajectory remains positive, indicating continued growth and innovation in the coming years.
Infrastructure-as-a-Service Industry Market Size (In Billion)
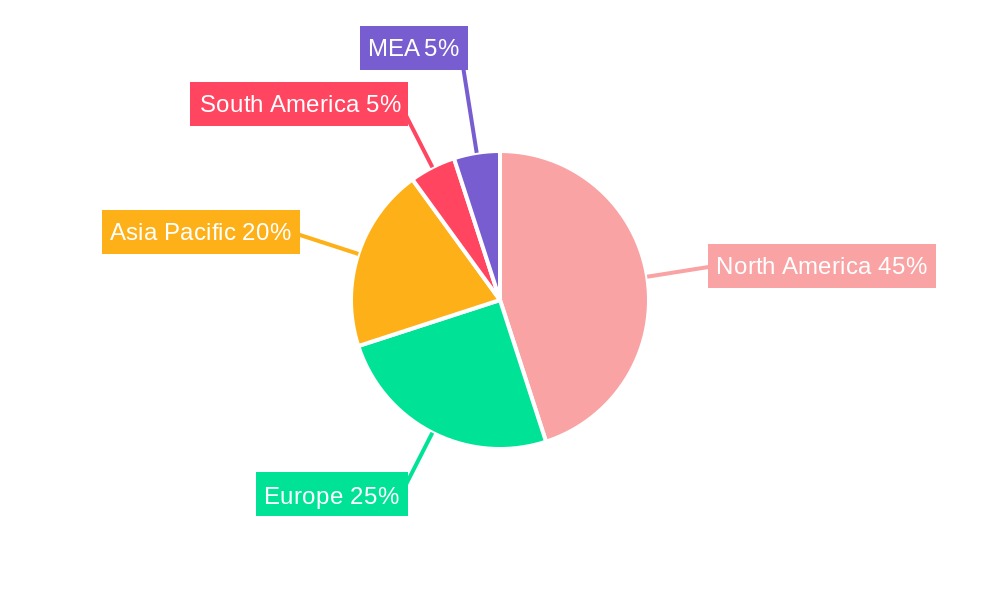
Competition in the IaaS market is fierce, with major players like Amazon Web Services (AWS), Microsoft Azure, Google Cloud Platform (GCP), and others constantly innovating and expanding their service offerings. The geographical distribution of the market reveals strong growth in North America and Asia-Pacific regions, driven by technological advancements and increased digitalization. Europe and other regions are also experiencing significant growth, although at potentially slightly slower rates compared to the leading regions. The forecast period (2025-2033) suggests continued expansion, with the market size anticipated to increase substantially due to the sustained adoption of cloud computing and the evolving technological landscape. Growth will likely be influenced by factors such as the increasing adoption of 5G technology, edge computing, and further developments in AI and machine learning, all of which require robust IaaS support. The market's continued evolution hinges on addressing challenges relating to security and data privacy, ensuring smooth transitions and reliable service delivery across various deployment models.
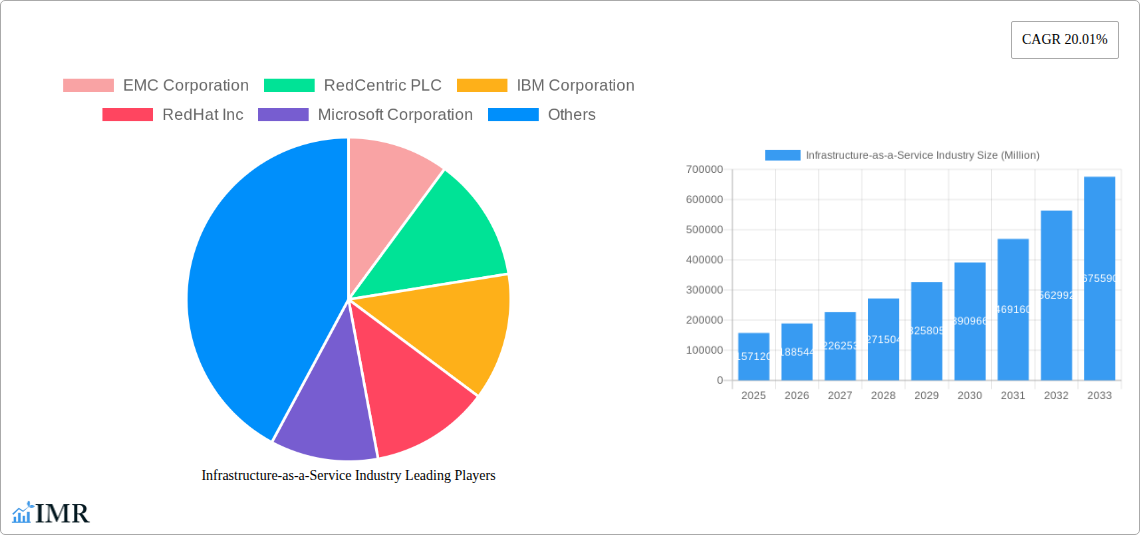
Infrastructure-as-a-Service Industry Company Market Share
Infrastructure-as-a-Service (IaaS) Industry Market Report: 2019-2033
This comprehensive report provides a detailed analysis of the Infrastructure-as-a-Service (IaaS) industry, encompassing market dynamics, growth trends, dominant segments, and key players. With a study period spanning 2019-2033, a base year of 2025, and a forecast period of 2025-2033, this report offers invaluable insights for industry professionals, investors, and strategic decision-makers. The report covers parent markets (Cloud Computing) and child markets (specific IaaS services like DRaaS, DBaaS etc.) for comprehensive market understanding. Market values are presented in millions of US dollars.
Infrastructure-as-a-Service Industry Market Dynamics & Structure
The IaaS market is characterized by a dynamic interplay of factors influencing its structure and growth trajectory. Market concentration is relatively high, with major players like Amazon Web Services, Microsoft Azure, and Google Cloud Platform holding significant market share (estimated at xx%, xx%, and xx% respectively in 2025). However, the landscape is competitive, with numerous smaller players vying for market share. Technological innovation, particularly in areas like serverless computing, edge computing, and AI-powered infrastructure management, is a key driver. Regulatory frameworks, including data privacy regulations (GDPR, CCPA), significantly impact market dynamics and operational strategies. Competitive product substitutes, such as on-premise solutions, present challenges, although IaaS's scalability and cost-effectiveness generally provide a compelling advantage. End-user demographics are broadening, with adoption increasing across various industries. M&A activity is substantial, with an estimated xx deals in the last 5 years, reflecting consolidation and expansion strategies within the sector.
- Market Concentration: High, with top 3 players holding xx% market share in 2025.
- Technological Innovation: Key drivers include serverless, edge, and AI-powered solutions.
- Regulatory Frameworks: Data privacy regulations impact market strategies.
- Competitive Substitutes: On-premise solutions pose a challenge, but IaaS offers superior scalability and cost benefits.
- M&A Activity: Significant, with approximately xx deals in the past 5 years.
Infrastructure-as-a-Service Industry Growth Trends & Insights
The IaaS market exhibited robust growth during the historical period (2019-2024), with a CAGR of xx%. This growth is projected to continue during the forecast period (2025-2033), albeit at a slightly moderated pace, reaching a market size of $xx million by 2033 and achieving a CAGR of xx%. Increased cloud adoption across various industries, driven by factors like digital transformation initiatives and the need for enhanced scalability and flexibility, is a primary driver. Technological disruptions, such as the rise of serverless computing and edge computing, are reshaping the market landscape and presenting new opportunities. Consumer behavior is shifting towards cloud-native applications and services, fueling demand for IaaS solutions. Market penetration, currently at xx%, is expected to increase to xx% by 2033, indicating substantial future growth potential. The growing adoption of hybrid cloud models is also expected to contribute significantly to market growth.
Dominant Regions, Countries, or Segments in Infrastructure-as-a-Service Industry
North America currently dominates the IaaS market, holding approximately xx% of the global market share in 2025, driven by strong technological advancements, high cloud adoption rates, and a robust IT infrastructure. Europe and Asia-Pacific are experiencing substantial growth, with Asia-Pacific projected to become a key growth region in the forecast period, driven by increasing digitalization and the expanding IT sector in countries like China and India. Within the segments, Public Cloud is the dominant deployment model, accounting for around xx% of the market share in 2025 due to its scalability and cost-effectiveness. Managed Hosting and SaaS (Storage as a Service) are the leading service segments, showing rapid growth driven by the demand for managed services and data storage solutions. The BFSI and IT & Telecom sectors are the largest end-user industries, leading the adoption of IaaS solutions.
- Leading Region: North America (xx% market share in 2025).
- Fastest-Growing Region: Asia-Pacific.
- Dominant Deployment Model: Public Cloud (xx% market share in 2025).
- Leading Service Segment: Managed Hosting and SaaS.
- Largest End-User Industries: BFSI and IT & Telecom.
Infrastructure-as-a-Service Industry Product Landscape
The IaaS product landscape is characterized by a wide range of offerings, from basic compute and storage services to sophisticated managed services and specialized solutions such as DBaaS and DRaaS. Key innovations include serverless computing platforms, container orchestration technologies (like Kubernetes), and AI-driven infrastructure management tools. These advancements enhance efficiency, scalability, and cost optimization, providing unique selling propositions for IaaS providers. Performance metrics, including uptime, latency, and data security, are crucial differentiators in a highly competitive marketplace.
Key Drivers, Barriers & Challenges in Infrastructure-as-a-Service Industry
Key Drivers: Technological advancements (AI, serverless computing), increasing digital transformation initiatives across industries, the need for enhanced scalability and flexibility, and government support for cloud computing adoption.
Key Challenges: Security concerns around data breaches and compliance issues, vendor lock-in, complexity of managing hybrid cloud environments, and increasing competition resulting in price pressure. These challenges impact market growth by potentially slowing adoption rates and increasing operational costs for businesses. The estimated impact of these challenges on market growth in 2025 is estimated at xx million dollars.
Emerging Opportunities in Infrastructure-as-a-Service Industry
Emerging opportunities lie in edge computing, AI-driven infrastructure optimization, the growing demand for specialized IaaS solutions (e.g., tailored for specific industries), and the expansion into underserved markets. The increasing adoption of IoT devices and the rise of 5G networks also create significant opportunities for IaaS providers by creating demand for improved connectivity and data management solutions.
Growth Accelerators in the Infrastructure-as-a-Service Industry Industry
Long-term growth will be driven by continuous technological innovation, strategic partnerships between IaaS providers and other technology companies (as exemplified by the Cisco-Kyndryl and Kyndryl-Cloudflare partnerships), and aggressive expansion into emerging markets with untapped potential. The development of more robust security measures and the simplification of cloud management tools will also contribute significantly to market expansion.
Key Players Shaping the Infrastructure-as-a-Service Industry Market
Notable Milestones in Infrastructure-as-a-Service Industry Sector
- August 2023: Cisco and Kyndryl extend their partnership to enhance cybersecurity for enterprise clients.
- May 2023: Kyndryl and Cloudflare partner to offer managed WAN-as-a-Service and Cloudflare Zero Trust solutions.
In-Depth Infrastructure-as-a-Service Industry Market Outlook
The IaaS market exhibits considerable future potential, driven by the continued growth of cloud computing and the increasing adoption of digital technologies across various industries. Strategic partnerships, technological advancements, and expansion into emerging markets present significant opportunities for market players. The market is expected to witness continued consolidation, with larger players acquiring smaller companies to enhance their product portfolios and expand their market reach. Focus on enhancing security features and user experience will be critical for success in the coming years.
Infrastructure-as-a-Service Industry Segmentation
-
1. Deployment Mode
- 1.1. Public Cloud
- 1.2. Private Cloud
- 1.3. Hybrid Cloud
-
2. Service
- 2.1. Managed Hosting
- 2.2. Disaster Recovery as a Service ( DRaaS)
- 2.3. Communication as a Service (CaaS)
- 2.4. Database as a Service (DBaaS)
- 2.5. Storage as a Service (SaaS)
-
3. End-user Industry
- 3.1. BFSI
- 3.2. IT & Telecom
- 3.3. Healthcare
- 3.4. Media & Entertainment
- 3.5. Retail
- 3.6. Other End-user Industries
Infrastructure-as-a-Service Industry Segmentation By Geography
- 1. North America
- 2. Europe
- 3. Asia Pacific
- 4. Latin America
- 5. Middle East
Infrastructure-as-a-Service Industry Regional Market Share
Geographic Coverage of Infrastructure-as-a-Service Industry
Infrastructure-as-a-Service Industry REPORT HIGHLIGHTS
| Aspects | Details |
|---|---|
| Study Period | 2020-2034 |
| Base Year | 2025 |
| Estimated Year | 2026 |
| Forecast Period | 2026-2034 |
| Historical Period | 2020-2025 |
| Growth Rate | CAGR of 20.01% from 2020-2034 |
| Segmentation |
|
Table of Contents
- 1. Introduction
- 1.1. Research Scope
- 1.2. Market Segmentation
- 1.3. Research Objective
- 1.4. Definitions and Assumptions
- 2. Executive Summary
- 2.1. Market Snapshot
- 3. Market Dynamics
- 3.1. Market Drivers
- 3.2. Market Restrains
- 3.3. Market Trends
- 3.4. Market Opportunities
- 4. Market Factor Analysis
- 4.1. Porters Five Forces
- 4.1.1. Bargaining Power of Suppliers
- 4.1.2. Bargaining Power of Buyers
- 4.1.3. Threat of New Entrants
- 4.1.4. Threat of Substitutes
- 4.1.5. Competitive Rivalry
- 4.2. PESTEL analysis
- 4.3. BCG Analysis
- 4.3.1. Stars (High Growth, High Market Share)
- 4.3.2. Cash Cows (Low Growth, High Market Share)
- 4.3.3. Question Mark (High Growth, Low Market Share)
- 4.3.4. Dogs (Low Growth, Low Market Share)
- 4.4. Ansoff Matrix Analysis
- 4.5. Supply Chain Analysis
- 4.6. Regulatory Landscape
- 4.7. Current Market Potential and Opportunity Assessment (TAM–SAM–SOM Framework)
- 4.8. IMR Analyst Note
- 4.1. Porters Five Forces
- 5. Market Analysis, Insights and Forecast 2021-2033
- 5.1. Market Analysis, Insights and Forecast - by Deployment Mode
- 5.1.1. Public Cloud
- 5.1.2. Private Cloud
- 5.1.3. Hybrid Cloud
- 5.2. Market Analysis, Insights and Forecast - by Service
- 5.2.1. Managed Hosting
- 5.2.2. Disaster Recovery as a Service ( DRaaS)
- 5.2.3. Communication as a Service (CaaS)
- 5.2.4. Database as a Service (DBaaS)
- 5.2.5. Storage as a Service (SaaS)
- 5.3. Market Analysis, Insights and Forecast - by End-user Industry
- 5.3.1. BFSI
- 5.3.2. IT & Telecom
- 5.3.3. Healthcare
- 5.3.4. Media & Entertainment
- 5.3.5. Retail
- 5.3.6. Other End-user Industries
- 5.4. Market Analysis, Insights and Forecast - by Region
- 5.4.1. North America
- 5.4.2. Europe
- 5.4.3. Asia Pacific
- 5.4.4. Latin America
- 5.4.5. Middle East
- 5.1. Market Analysis, Insights and Forecast - by Deployment Mode
- 6. Global Infrastructure-as-a-Service Industry Analysis, Insights and Forecast, 2021-2033
- 6.1. Market Analysis, Insights and Forecast - by Deployment Mode
- 6.1.1. Public Cloud
- 6.1.2. Private Cloud
- 6.1.3. Hybrid Cloud
- 6.2. Market Analysis, Insights and Forecast - by Service
- 6.2.1. Managed Hosting
- 6.2.2. Disaster Recovery as a Service ( DRaaS)
- 6.2.3. Communication as a Service (CaaS)
- 6.2.4. Database as a Service (DBaaS)
- 6.2.5. Storage as a Service (SaaS)
- 6.3. Market Analysis, Insights and Forecast - by End-user Industry
- 6.3.1. BFSI
- 6.3.2. IT & Telecom
- 6.3.3. Healthcare
- 6.3.4. Media & Entertainment
- 6.3.5. Retail
- 6.3.6. Other End-user Industries
- 6.1. Market Analysis, Insights and Forecast - by Deployment Mode
- 7. North America Infrastructure-as-a-Service Industry Analysis, Insights and Forecast, 2020-2032
- 7.1. Market Analysis, Insights and Forecast - by Deployment Mode
- 7.1.1. Public Cloud
- 7.1.2. Private Cloud
- 7.1.3. Hybrid Cloud
- 7.2. Market Analysis, Insights and Forecast - by Service
- 7.2.1. Managed Hosting
- 7.2.2. Disaster Recovery as a Service ( DRaaS)
- 7.2.3. Communication as a Service (CaaS)
- 7.2.4. Database as a Service (DBaaS)
- 7.2.5. Storage as a Service (SaaS)
- 7.3. Market Analysis, Insights and Forecast - by End-user Industry
- 7.3.1. BFSI
- 7.3.2. IT & Telecom
- 7.3.3. Healthcare
- 7.3.4. Media & Entertainment
- 7.3.5. Retail
- 7.3.6. Other End-user Industries
- 7.1. Market Analysis, Insights and Forecast - by Deployment Mode
- 8. Europe Infrastructure-as-a-Service Industry Analysis, Insights and Forecast, 2020-2032
- 8.1. Market Analysis, Insights and Forecast - by Deployment Mode
- 8.1.1. Public Cloud
- 8.1.2. Private Cloud
- 8.1.3. Hybrid Cloud
- 8.2. Market Analysis, Insights and Forecast - by Service
- 8.2.1. Managed Hosting
- 8.2.2. Disaster Recovery as a Service ( DRaaS)
- 8.2.3. Communication as a Service (CaaS)
- 8.2.4. Database as a Service (DBaaS)
- 8.2.5. Storage as a Service (SaaS)
- 8.3. Market Analysis, Insights and Forecast - by End-user Industry
- 8.3.1. BFSI
- 8.3.2. IT & Telecom
- 8.3.3. Healthcare
- 8.3.4. Media & Entertainment
- 8.3.5. Retail
- 8.3.6. Other End-user Industries
- 8.1. Market Analysis, Insights and Forecast - by Deployment Mode
- 9. Asia Pacific Infrastructure-as-a-Service Industry Analysis, Insights and Forecast, 2020-2032
- 9.1. Market Analysis, Insights and Forecast - by Deployment Mode
- 9.1.1. Public Cloud
- 9.1.2. Private Cloud
- 9.1.3. Hybrid Cloud
- 9.2. Market Analysis, Insights and Forecast - by Service
- 9.2.1. Managed Hosting
- 9.2.2. Disaster Recovery as a Service ( DRaaS)
- 9.2.3. Communication as a Service (CaaS)
- 9.2.4. Database as a Service (DBaaS)
- 9.2.5. Storage as a Service (SaaS)
- 9.3. Market Analysis, Insights and Forecast - by End-user Industry
- 9.3.1. BFSI
- 9.3.2. IT & Telecom
- 9.3.3. Healthcare
- 9.3.4. Media & Entertainment
- 9.3.5. Retail
- 9.3.6. Other End-user Industries
- 9.1. Market Analysis, Insights and Forecast - by Deployment Mode
- 10. Latin America Infrastructure-as-a-Service Industry Analysis, Insights and Forecast, 2020-2032
- 10.1. Market Analysis, Insights and Forecast - by Deployment Mode
- 10.1.1. Public Cloud
- 10.1.2. Private Cloud
- 10.1.3. Hybrid Cloud
- 10.2. Market Analysis, Insights and Forecast - by Service
- 10.2.1. Managed Hosting
- 10.2.2. Disaster Recovery as a Service ( DRaaS)
- 10.2.3. Communication as a Service (CaaS)
- 10.2.4. Database as a Service (DBaaS)
- 10.2.5. Storage as a Service (SaaS)
- 10.3. Market Analysis, Insights and Forecast - by End-user Industry
- 10.3.1. BFSI
- 10.3.2. IT & Telecom
- 10.3.3. Healthcare
- 10.3.4. Media & Entertainment
- 10.3.5. Retail
- 10.3.6. Other End-user Industries
- 10.1. Market Analysis, Insights and Forecast - by Deployment Mode
- 11. Middle East Infrastructure-as-a-Service Industry Analysis, Insights and Forecast, 2020-2032
- 11.1. Market Analysis, Insights and Forecast - by Deployment Mode
- 11.1.1. Public Cloud
- 11.1.2. Private Cloud
- 11.1.3. Hybrid Cloud
- 11.2. Market Analysis, Insights and Forecast - by Service
- 11.2.1. Managed Hosting
- 11.2.2. Disaster Recovery as a Service ( DRaaS)
- 11.2.3. Communication as a Service (CaaS)
- 11.2.4. Database as a Service (DBaaS)
- 11.2.5. Storage as a Service (SaaS)
- 11.3. Market Analysis, Insights and Forecast - by End-user Industry
- 11.3.1. BFSI
- 11.3.2. IT & Telecom
- 11.3.3. Healthcare
- 11.3.4. Media & Entertainment
- 11.3.5. Retail
- 11.3.6. Other End-user Industries
- 11.1. Market Analysis, Insights and Forecast - by Deployment Mode
- 12. Competitive Analysis
- 12.1. Company Profiles
- 12.1.1 EMC Corporation
- 12.1.1.1. Company Overview
- 12.1.1.2. Products
- 12.1.1.3. Company Financials
- 12.1.1.4. SWOT Analysis
- 12.1.2 RedCentric PLC
- 12.1.2.1. Company Overview
- 12.1.2.2. Products
- 12.1.2.3. Company Financials
- 12.1.2.4. SWOT Analysis
- 12.1.3 IBM Corporation
- 12.1.3.1. Company Overview
- 12.1.3.2. Products
- 12.1.3.3. Company Financials
- 12.1.3.4. SWOT Analysis
- 12.1.4 RedHat Inc
- 12.1.4.1. Company Overview
- 12.1.4.2. Products
- 12.1.4.3. Company Financials
- 12.1.4.4. SWOT Analysis
- 12.1.5 Microsoft Corporation
- 12.1.5.1. Company Overview
- 12.1.5.2. Products
- 12.1.5.3. Company Financials
- 12.1.5.4. SWOT Analysis
- 12.1.6 VMWare Inc
- 12.1.6.1. Company Overview
- 12.1.6.2. Products
- 12.1.6.3. Company Financials
- 12.1.6.4. SWOT Analysis
- 12.1.7 Amazon Web Services Inc
- 12.1.7.1. Company Overview
- 12.1.7.2. Products
- 12.1.7.3. Company Financials
- 12.1.7.4. SWOT Analysis
- 12.1.8 Rackspace Hosting Inc
- 12.1.8.1. Company Overview
- 12.1.8.2. Products
- 12.1.8.3. Company Financials
- 12.1.8.4. SWOT Analysis
- 12.1.9 Oracle Corporation
- 12.1.9.1. Company Overview
- 12.1.9.2. Products
- 12.1.9.3. Company Financials
- 12.1.9.4. SWOT Analysis
- 12.1.10 Google Inc
- 12.1.10.1. Company Overview
- 12.1.10.2. Products
- 12.1.10.3. Company Financials
- 12.1.10.4. SWOT Analysis
- 12.1.1 EMC Corporation
- 12.2. Market Entropy
- 12.2.1 Company's Key Areas Served
- 12.2.2 Recent Developments
- 12.3. Company Market Share Analysis 2025
- 12.3.1 Top 5 Companies Market Share Analysis
- 12.3.2 Top 3 Companies Market Share Analysis
- 12.4. List of Potential Customers
- 13. Research Methodology
List of Figures
- Figure 1: Global Infrastructure-as-a-Service Industry Revenue Breakdown (Million, %) by Region 2025 & 2033
- Figure 2: Global Infrastructure-as-a-Service Industry Volume Breakdown (K Unit, %) by Region 2025 & 2033
- Figure 3: North America Infrastructure-as-a-Service Industry Revenue (Million), by Deployment Mode 2025 & 2033
- Figure 4: North America Infrastructure-as-a-Service Industry Volume (K Unit), by Deployment Mode 2025 & 2033
- Figure 5: North America Infrastructure-as-a-Service Industry Revenue Share (%), by Deployment Mode 2025 & 2033
- Figure 6: North America Infrastructure-as-a-Service Industry Volume Share (%), by Deployment Mode 2025 & 2033
- Figure 7: North America Infrastructure-as-a-Service Industry Revenue (Million), by Service 2025 & 2033
- Figure 8: North America Infrastructure-as-a-Service Industry Volume (K Unit), by Service 2025 & 2033
- Figure 9: North America Infrastructure-as-a-Service Industry Revenue Share (%), by Service 2025 & 2033
- Figure 10: North America Infrastructure-as-a-Service Industry Volume Share (%), by Service 2025 & 2033
- Figure 11: North America Infrastructure-as-a-Service Industry Revenue (Million), by End-user Industry 2025 & 2033
- Figure 12: North America Infrastructure-as-a-Service Industry Volume (K Unit), by End-user Industry 2025 & 2033
- Figure 13: North America Infrastructure-as-a-Service Industry Revenue Share (%), by End-user Industry 2025 & 2033
- Figure 14: North America Infrastructure-as-a-Service Industry Volume Share (%), by End-user Industry 2025 & 2033
- Figure 15: North America Infrastructure-as-a-Service Industry Revenue (Million), by Country 2025 & 2033
- Figure 16: North America Infrastructure-as-a-Service Industry Volume (K Unit), by Country 2025 & 2033
- Figure 17: North America Infrastructure-as-a-Service Industry Revenue Share (%), by Country 2025 & 2033
- Figure 18: North America Infrastructure-as-a-Service Industry Volume Share (%), by Country 2025 & 2033
- Figure 19: Europe Infrastructure-as-a-Service Industry Revenue (Million), by Deployment Mode 2025 & 2033
- Figure 20: Europe Infrastructure-as-a-Service Industry Volume (K Unit), by Deployment Mode 2025 & 2033
- Figure 21: Europe Infrastructure-as-a-Service Industry Revenue Share (%), by Deployment Mode 2025 & 2033
- Figure 22: Europe Infrastructure-as-a-Service Industry Volume Share (%), by Deployment Mode 2025 & 2033
- Figure 23: Europe Infrastructure-as-a-Service Industry Revenue (Million), by Service 2025 & 2033
- Figure 24: Europe Infrastructure-as-a-Service Industry Volume (K Unit), by Service 2025 & 2033
- Figure 25: Europe Infrastructure-as-a-Service Industry Revenue Share (%), by Service 2025 & 2033
- Figure 26: Europe Infrastructure-as-a-Service Industry Volume Share (%), by Service 2025 & 2033
- Figure 27: Europe Infrastructure-as-a-Service Industry Revenue (Million), by End-user Industry 2025 & 2033
- Figure 28: Europe Infrastructure-as-a-Service Industry Volume (K Unit), by End-user Industry 2025 & 2033
- Figure 29: Europe Infrastructure-as-a-Service Industry Revenue Share (%), by End-user Industry 2025 & 2033
- Figure 30: Europe Infrastructure-as-a-Service Industry Volume Share (%), by End-user Industry 2025 & 2033
- Figure 31: Europe Infrastructure-as-a-Service Industry Revenue (Million), by Country 2025 & 2033
- Figure 32: Europe Infrastructure-as-a-Service Industry Volume (K Unit), by Country 2025 & 2033
- Figure 33: Europe Infrastructure-as-a-Service Industry Revenue Share (%), by Country 2025 & 2033
- Figure 34: Europe Infrastructure-as-a-Service Industry Volume Share (%), by Country 2025 & 2033
- Figure 35: Asia Pacific Infrastructure-as-a-Service Industry Revenue (Million), by Deployment Mode 2025 & 2033
- Figure 36: Asia Pacific Infrastructure-as-a-Service Industry Volume (K Unit), by Deployment Mode 2025 & 2033
- Figure 37: Asia Pacific Infrastructure-as-a-Service Industry Revenue Share (%), by Deployment Mode 2025 & 2033
- Figure 38: Asia Pacific Infrastructure-as-a-Service Industry Volume Share (%), by Deployment Mode 2025 & 2033
- Figure 39: Asia Pacific Infrastructure-as-a-Service Industry Revenue (Million), by Service 2025 & 2033
- Figure 40: Asia Pacific Infrastructure-as-a-Service Industry Volume (K Unit), by Service 2025 & 2033
- Figure 41: Asia Pacific Infrastructure-as-a-Service Industry Revenue Share (%), by Service 2025 & 2033
- Figure 42: Asia Pacific Infrastructure-as-a-Service Industry Volume Share (%), by Service 2025 & 2033
- Figure 43: Asia Pacific Infrastructure-as-a-Service Industry Revenue (Million), by End-user Industry 2025 & 2033
- Figure 44: Asia Pacific Infrastructure-as-a-Service Industry Volume (K Unit), by End-user Industry 2025 & 2033
- Figure 45: Asia Pacific Infrastructure-as-a-Service Industry Revenue Share (%), by End-user Industry 2025 & 2033
- Figure 46: Asia Pacific Infrastructure-as-a-Service Industry Volume Share (%), by End-user Industry 2025 & 2033
- Figure 47: Asia Pacific Infrastructure-as-a-Service Industry Revenue (Million), by Country 2025 & 2033
- Figure 48: Asia Pacific Infrastructure-as-a-Service Industry Volume (K Unit), by Country 2025 & 2033
- Figure 49: Asia Pacific Infrastructure-as-a-Service Industry Revenue Share (%), by Country 2025 & 2033
- Figure 50: Asia Pacific Infrastructure-as-a-Service Industry Volume Share (%), by Country 2025 & 2033
- Figure 51: Latin America Infrastructure-as-a-Service Industry Revenue (Million), by Deployment Mode 2025 & 2033
- Figure 52: Latin America Infrastructure-as-a-Service Industry Volume (K Unit), by Deployment Mode 2025 & 2033
- Figure 53: Latin America Infrastructure-as-a-Service Industry Revenue Share (%), by Deployment Mode 2025 & 2033
- Figure 54: Latin America Infrastructure-as-a-Service Industry Volume Share (%), by Deployment Mode 2025 & 2033
- Figure 55: Latin America Infrastructure-as-a-Service Industry Revenue (Million), by Service 2025 & 2033
- Figure 56: Latin America Infrastructure-as-a-Service Industry Volume (K Unit), by Service 2025 & 2033
- Figure 57: Latin America Infrastructure-as-a-Service Industry Revenue Share (%), by Service 2025 & 2033
- Figure 58: Latin America Infrastructure-as-a-Service Industry Volume Share (%), by Service 2025 & 2033
- Figure 59: Latin America Infrastructure-as-a-Service Industry Revenue (Million), by End-user Industry 2025 & 2033
- Figure 60: Latin America Infrastructure-as-a-Service Industry Volume (K Unit), by End-user Industry 2025 & 2033
- Figure 61: Latin America Infrastructure-as-a-Service Industry Revenue Share (%), by End-user Industry 2025 & 2033
- Figure 62: Latin America Infrastructure-as-a-Service Industry Volume Share (%), by End-user Industry 2025 & 2033
- Figure 63: Latin America Infrastructure-as-a-Service Industry Revenue (Million), by Country 2025 & 2033
- Figure 64: Latin America Infrastructure-as-a-Service Industry Volume (K Unit), by Country 2025 & 2033
- Figure 65: Latin America Infrastructure-as-a-Service Industry Revenue Share (%), by Country 2025 & 2033
- Figure 66: Latin America Infrastructure-as-a-Service Industry Volume Share (%), by Country 2025 & 2033
- Figure 67: Middle East Infrastructure-as-a-Service Industry Revenue (Million), by Deployment Mode 2025 & 2033
- Figure 68: Middle East Infrastructure-as-a-Service Industry Volume (K Unit), by Deployment Mode 2025 & 2033
- Figure 69: Middle East Infrastructure-as-a-Service Industry Revenue Share (%), by Deployment Mode 2025 & 2033
- Figure 70: Middle East Infrastructure-as-a-Service Industry Volume Share (%), by Deployment Mode 2025 & 2033
- Figure 71: Middle East Infrastructure-as-a-Service Industry Revenue (Million), by Service 2025 & 2033
- Figure 72: Middle East Infrastructure-as-a-Service Industry Volume (K Unit), by Service 2025 & 2033
- Figure 73: Middle East Infrastructure-as-a-Service Industry Revenue Share (%), by Service 2025 & 2033
- Figure 74: Middle East Infrastructure-as-a-Service Industry Volume Share (%), by Service 2025 & 2033
- Figure 75: Middle East Infrastructure-as-a-Service Industry Revenue (Million), by End-user Industry 2025 & 2033
- Figure 76: Middle East Infrastructure-as-a-Service Industry Volume (K Unit), by End-user Industry 2025 & 2033
- Figure 77: Middle East Infrastructure-as-a-Service Industry Revenue Share (%), by End-user Industry 2025 & 2033
- Figure 78: Middle East Infrastructure-as-a-Service Industry Volume Share (%), by End-user Industry 2025 & 2033
- Figure 79: Middle East Infrastructure-as-a-Service Industry Revenue (Million), by Country 2025 & 2033
- Figure 80: Middle East Infrastructure-as-a-Service Industry Volume (K Unit), by Country 2025 & 2033
- Figure 81: Middle East Infrastructure-as-a-Service Industry Revenue Share (%), by Country 2025 & 2033
- Figure 82: Middle East Infrastructure-as-a-Service Industry Volume Share (%), by Country 2025 & 2033
List of Tables
- Table 1: Global Infrastructure-as-a-Service Industry Revenue Million Forecast, by Deployment Mode 2020 & 2033
- Table 2: Global Infrastructure-as-a-Service Industry Volume K Unit Forecast, by Deployment Mode 2020 & 2033
- Table 3: Global Infrastructure-as-a-Service Industry Revenue Million Forecast, by Service 2020 & 2033
- Table 4: Global Infrastructure-as-a-Service Industry Volume K Unit Forecast, by Service 2020 & 2033
- Table 5: Global Infrastructure-as-a-Service Industry Revenue Million Forecast, by End-user Industry 2020 & 2033
- Table 6: Global Infrastructure-as-a-Service Industry Volume K Unit Forecast, by End-user Industry 2020 & 2033
- Table 7: Global Infrastructure-as-a-Service Industry Revenue Million Forecast, by Region 2020 & 2033
- Table 8: Global Infrastructure-as-a-Service Industry Volume K Unit Forecast, by Region 2020 & 2033
- Table 9: Global Infrastructure-as-a-Service Industry Revenue Million Forecast, by Deployment Mode 2020 & 2033
- Table 10: Global Infrastructure-as-a-Service Industry Volume K Unit Forecast, by Deployment Mode 2020 & 2033
- Table 11: Global Infrastructure-as-a-Service Industry Revenue Million Forecast, by Service 2020 & 2033
- Table 12: Global Infrastructure-as-a-Service Industry Volume K Unit Forecast, by Service 2020 & 2033
- Table 13: Global Infrastructure-as-a-Service Industry Revenue Million Forecast, by End-user Industry 2020 & 2033
- Table 14: Global Infrastructure-as-a-Service Industry Volume K Unit Forecast, by End-user Industry 2020 & 2033
- Table 15: Global Infrastructure-as-a-Service Industry Revenue Million Forecast, by Country 2020 & 2033
- Table 16: Global Infrastructure-as-a-Service Industry Volume K Unit Forecast, by Country 2020 & 2033
- Table 17: Global Infrastructure-as-a-Service Industry Revenue Million Forecast, by Deployment Mode 2020 & 2033
- Table 18: Global Infrastructure-as-a-Service Industry Volume K Unit Forecast, by Deployment Mode 2020 & 2033
- Table 19: Global Infrastructure-as-a-Service Industry Revenue Million Forecast, by Service 2020 & 2033
- Table 20: Global Infrastructure-as-a-Service Industry Volume K Unit Forecast, by Service 2020 & 2033
- Table 21: Global Infrastructure-as-a-Service Industry Revenue Million Forecast, by End-user Industry 2020 & 2033
- Table 22: Global Infrastructure-as-a-Service Industry Volume K Unit Forecast, by End-user Industry 2020 & 2033
- Table 23: Global Infrastructure-as-a-Service Industry Revenue Million Forecast, by Country 2020 & 2033
- Table 24: Global Infrastructure-as-a-Service Industry Volume K Unit Forecast, by Country 2020 & 2033
- Table 25: Global Infrastructure-as-a-Service Industry Revenue Million Forecast, by Deployment Mode 2020 & 2033
- Table 26: Global Infrastructure-as-a-Service Industry Volume K Unit Forecast, by Deployment Mode 2020 & 2033
- Table 27: Global Infrastructure-as-a-Service Industry Revenue Million Forecast, by Service 2020 & 2033
- Table 28: Global Infrastructure-as-a-Service Industry Volume K Unit Forecast, by Service 2020 & 2033
- Table 29: Global Infrastructure-as-a-Service Industry Revenue Million Forecast, by End-user Industry 2020 & 2033
- Table 30: Global Infrastructure-as-a-Service Industry Volume K Unit Forecast, by End-user Industry 2020 & 2033
- Table 31: Global Infrastructure-as-a-Service Industry Revenue Million Forecast, by Country 2020 & 2033
- Table 32: Global Infrastructure-as-a-Service Industry Volume K Unit Forecast, by Country 2020 & 2033
- Table 33: Global Infrastructure-as-a-Service Industry Revenue Million Forecast, by Deployment Mode 2020 & 2033
- Table 34: Global Infrastructure-as-a-Service Industry Volume K Unit Forecast, by Deployment Mode 2020 & 2033
- Table 35: Global Infrastructure-as-a-Service Industry Revenue Million Forecast, by Service 2020 & 2033
- Table 36: Global Infrastructure-as-a-Service Industry Volume K Unit Forecast, by Service 2020 & 2033
- Table 37: Global Infrastructure-as-a-Service Industry Revenue Million Forecast, by End-user Industry 2020 & 2033
- Table 38: Global Infrastructure-as-a-Service Industry Volume K Unit Forecast, by End-user Industry 2020 & 2033
- Table 39: Global Infrastructure-as-a-Service Industry Revenue Million Forecast, by Country 2020 & 2033
- Table 40: Global Infrastructure-as-a-Service Industry Volume K Unit Forecast, by Country 2020 & 2033
- Table 41: Global Infrastructure-as-a-Service Industry Revenue Million Forecast, by Deployment Mode 2020 & 2033
- Table 42: Global Infrastructure-as-a-Service Industry Volume K Unit Forecast, by Deployment Mode 2020 & 2033
- Table 43: Global Infrastructure-as-a-Service Industry Revenue Million Forecast, by Service 2020 & 2033
- Table 44: Global Infrastructure-as-a-Service Industry Volume K Unit Forecast, by Service 2020 & 2033
- Table 45: Global Infrastructure-as-a-Service Industry Revenue Million Forecast, by End-user Industry 2020 & 2033
- Table 46: Global Infrastructure-as-a-Service Industry Volume K Unit Forecast, by End-user Industry 2020 & 2033
- Table 47: Global Infrastructure-as-a-Service Industry Revenue Million Forecast, by Country 2020 & 2033
- Table 48: Global Infrastructure-as-a-Service Industry Volume K Unit Forecast, by Country 2020 & 2033
Frequently Asked Questions
1. What is the projected Compound Annual Growth Rate (CAGR) of the Infrastructure-as-a-Service Industry?
The projected CAGR is approximately 20.01%.
2. Which companies are prominent players in the Infrastructure-as-a-Service Industry?
Key companies in the market include EMC Corporation, RedCentric PLC, IBM Corporation, RedHat Inc, Microsoft Corporation, VMWare Inc, Amazon Web Services Inc, Rackspace Hosting Inc, Oracle Corporation, Google Inc.
3. What are the main segments of the Infrastructure-as-a-Service Industry?
The market segments include Deployment Mode, Service, End-user Industry.
4. Can you provide details about the market size?
The market size is estimated to be USD 157.12 Million as of 2022.
5. What are some drivers contributing to market growth?
Increased Demand For Hybrid Cloud Platform; Growing Need For High Speed Interaction Between Various Networks.
6. What are the notable trends driving market growth?
IT & Telecom Expected to Hold Significant Growth.
7. Are there any restraints impacting market growth?
Stringent Government Regulations.
8. Can you provide examples of recent developments in the market?
August 2023 - Cisco, a global technology company, and Kyndryl, an IT infrastructure services provider, have extended the partnership to include new services to assist enterprise clients more effectively in identifying and addressing cyber risks. More specifically, Kyndryl will integrate its cyber resilience solution with Cisco's comprehensive Security Cloud platform, comprising security elements like Multicloud Defense, which unifies security and policy across private and public clouds, Cisco's Duo access control, and extended detection and response features.
9. What pricing options are available for accessing the report?
Pricing options include single-user, multi-user, and enterprise licenses priced at USD 4750, USD 5250, and USD 8750 respectively.
10. Is the market size provided in terms of value or volume?
The market size is provided in terms of value, measured in Million and volume, measured in K Unit.
11. Are there any specific market keywords associated with the report?
Yes, the market keyword associated with the report is "Infrastructure-as-a-Service Industry," which aids in identifying and referencing the specific market segment covered.
12. How do I determine which pricing option suits my needs best?
The pricing options vary based on user requirements and access needs. Individual users may opt for single-user licenses, while businesses requiring broader access may choose multi-user or enterprise licenses for cost-effective access to the report.
13. Are there any additional resources or data provided in the Infrastructure-as-a-Service Industry report?
While the report offers comprehensive insights, it's advisable to review the specific contents or supplementary materials provided to ascertain if additional resources or data are available.
14. How can I stay updated on further developments or reports in the Infrastructure-as-a-Service Industry?
To stay informed about further developments, trends, and reports in the Infrastructure-as-a-Service Industry, consider subscribing to industry newsletters, following relevant companies and organizations, or regularly checking reputable industry news sources and publications.
Methodology
Step 1 - Identification of Relevant Samples Size from Population Database


Step 2 - Approaches for Defining Global Market Size (Value, Volume* & Price*)

Note*: In applicable scenarios
Step 3 - Data Sources
Primary Research
- Web Analytics
- Survey Reports
- Research Institute
- Latest Research Reports
- Opinion Leaders
Secondary Research
- Annual Reports
- White Paper
- Latest Press Release
- Industry Association
- Paid Database
- Investor Presentations

Step 4 - Data Triangulation
Involves using different sources of information in order to increase the validity of a study
These sources are likely to be stakeholders in a program - participants, other researchers, program staff, other community members, and so on.
Then we put all data in single framework & apply various statistical tools to find out the dynamic on the market.
During the analysis stage, feedback from the stakeholder groups would be compared to determine areas of agreement as well as areas of divergence