

Key Insights
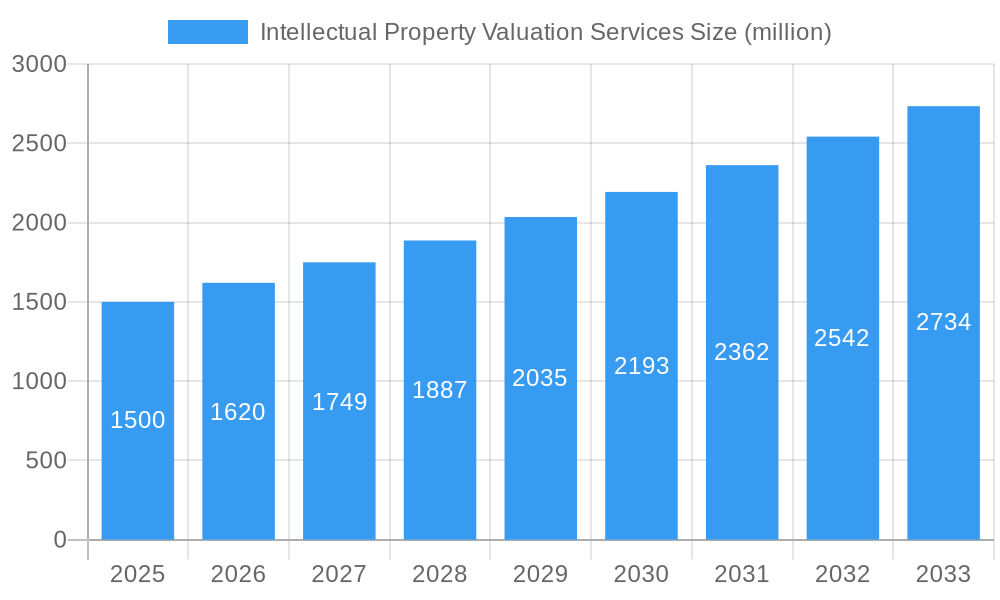
The Intellectual Property (IP) Valuation Services market is experiencing robust growth, driven by increasing awareness of IP as a strategic asset and the rising need for accurate valuations in mergers & acquisitions (M&A), licensing agreements, and financial reporting. The market, estimated at $1.5 billion in 2025, is projected to expand at a Compound Annual Growth Rate (CAGR) of 8% from 2025 to 2033, reaching approximately $2.8 billion by 2033. This growth is fueled by several key factors, including the escalating importance of intangible assets in overall corporate value, stricter regulatory requirements for IP reporting, and a surge in cross-border transactions necessitating accurate IP valuations. Major players such as Deloitte, PwC, and KPMG dominate the market, leveraging their established expertise in financial advisory and auditing. However, specialized IP valuation firms like Blackstone IP and Mathys & Squire are also gaining significant traction due to their deep industry knowledge and focused services. The market is segmented by service type (e.g., patent valuation, trademark valuation, brand valuation), industry (e.g., technology, pharmaceuticals, consumer goods), and geography. North America currently holds the largest market share, followed by Europe and Asia-Pacific, with emerging economies showing significant growth potential.
Intellectual Property Valuation Services Market Size (In Billion)
The market faces some challenges, including the complexity and subjectivity inherent in IP valuation, the lack of standardized valuation methodologies, and the potential for disputes over valuation outcomes. However, the ongoing development of sophisticated valuation techniques, the increasing adoption of industry best practices, and the growing demand for clear and defensible IP valuations are mitigating these challenges. The future trajectory of the market is likely to be shaped by advancements in data analytics and artificial intelligence (AI) for IP portfolio management and valuation, as well as the increasing importance of data-driven insights in supporting valuation decisions. The emergence of new valuation technologies will further enhance efficiency and precision, while a more consistent regulatory framework will help standardize processes and reduce uncertainty. The continuous expansion of the IP ecosystem is likely to fuel further growth across all segments in the coming years.
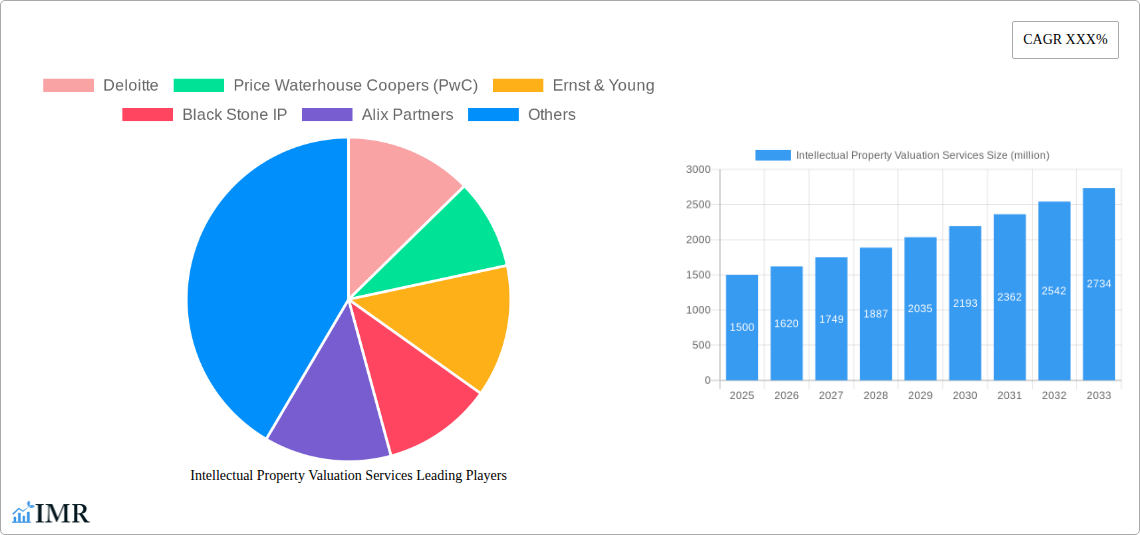
Intellectual Property Valuation Services Company Market Share
Intellectual Property Valuation Services Market Report: 2019-2033
This comprehensive report provides a detailed analysis of the Intellectual Property (IP) Valuation Services market, encompassing market dynamics, growth trends, regional analysis, competitive landscape, and future outlook. The study period covers 2019-2033, with 2025 as the base and estimated year. The forecast period spans 2025-2033, and the historical period covers 2019-2024. This report is crucial for businesses, investors, and industry professionals seeking to understand and capitalize on the opportunities within this rapidly evolving market. The total market size in 2025 is estimated at $XX billion.
Intellectual Property Valuation Services Market Dynamics & Structure
The Intellectual Property Valuation Services market is characterized by a moderately concentrated structure, with several major players and a significant number of smaller, specialized firms. The market's growth is driven by technological advancements in IP management software, increasing awareness of IP's strategic value, and the growing prevalence of M&A activity. Regulatory frameworks, particularly regarding patent valuation and transfer pricing, play a significant role in shaping market dynamics. Competitive substitutes include internal valuation efforts, though these often lack the expertise and objectivity of specialized firms. End-user demographics span a wide range, including technology companies, pharmaceutical firms, manufacturing businesses, and law firms.
- Market Concentration: The top 5 players hold approximately 35% of the market share in 2025.
- Technological Innovation: AI-powered valuation tools and automated data analysis are driving efficiency gains.
- Regulatory Framework: Harmonization of IP valuation standards across jurisdictions is a key growth factor.
- M&A Trends: A rising number of IP-focused mergers and acquisitions is boosting demand for valuation services, with approximately 1500 deals recorded in 2024.
- Innovation Barriers: High entry barriers due to specialized expertise and regulatory compliance.
Intellectual Property Valuation Services Growth Trends & Insights
The global Intellectual Property Valuation Services market exhibited robust growth during the historical period (2019-2024), driven by factors such as increasing IP litigation, rising demand for IP licensing agreements, and the growing importance of IP as a strategic asset. The market is projected to maintain a healthy Compound Annual Growth Rate (CAGR) of xx% during the forecast period (2025-2033), reaching an estimated market size of $XX billion by 2033. This growth is attributed to ongoing technological advancements, increasing adoption rates across various industry sectors, and a shift towards more sophisticated IP management strategies. The market penetration rate is expected to increase from xx% in 2025 to xx% by 2033. Technological disruptions, such as the emergence of blockchain-based IP registries, are expected to further fuel market expansion. Consumer behavior shifts toward valuing intangible assets are also driving growth.
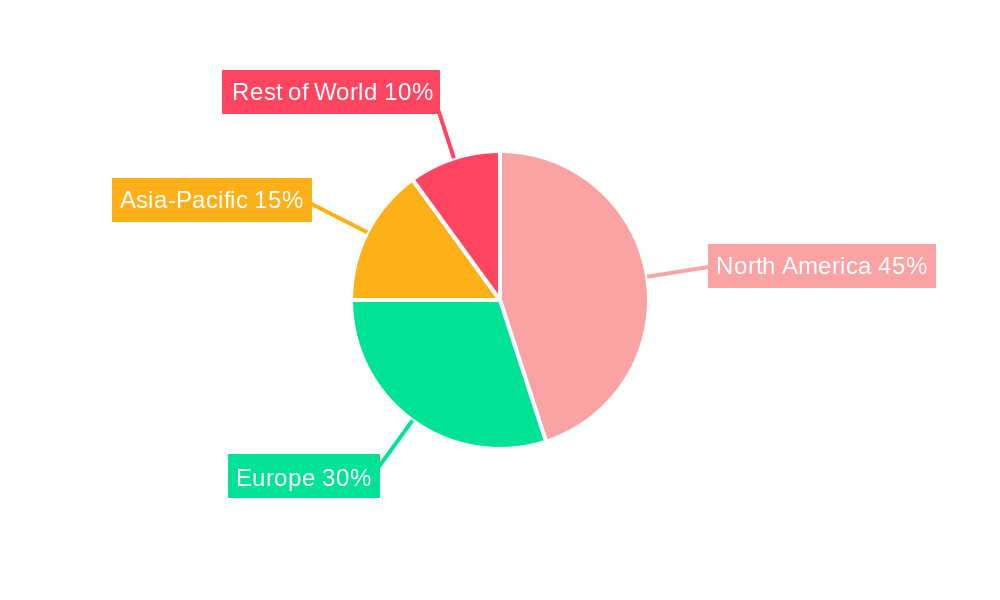
Dominant Regions, Countries, or Segments in Intellectual Property Valuation Services
North America currently dominates the Intellectual Property Valuation Services market, followed by Europe and Asia Pacific. This dominance is largely attributed to the presence of major players, a robust legal framework, and a high concentration of IP-intensive industries. The US and UK are the leading countries within their respective regions. The pharmaceutical and technology sectors are the fastest-growing segments, driven by increased R&D investment and a rising number of patent filings.
- Key Drivers in North America: Strong IP protection laws, a high concentration of technology companies, and significant M&A activity.
- Key Drivers in Europe: Growing awareness of IP valuation's importance and the increasing number of cross-border transactions.
- Key Drivers in Asia Pacific: Rapid economic growth, increasing R&D investments, and rising demand for IP licensing.
Intellectual Property Valuation Services Product Landscape
The Intellectual Property Valuation Services market offers a range of services, including patent valuation, trademark valuation, copyright valuation, and brand valuation. Recent innovations include the incorporation of AI and machine learning algorithms to enhance valuation accuracy and efficiency. These advanced methods improve the speed and precision of valuation processes, offering unique selling propositions. Key performance metrics include valuation accuracy, turnaround time, and client satisfaction.
Key Drivers, Barriers & Challenges in Intellectual Property Valuation Services
Key Drivers: Rising M&A activity, increasing IP litigation, stringent regulatory compliance needs, and a growing recognition of IP as a strategic asset are driving market growth. Technological advancements, such as AI-powered valuation tools, are also contributing to market expansion.
Key Challenges: The complexity of IP valuation methodologies, a lack of standardized valuation practices, and the need for specialized expertise present significant challenges. Competition from internal valuation departments and the high cost of services can limit market adoption. Supply chain disruptions could impact the availability of specialized talent.
Emerging Opportunities in Intellectual Property Valuation Services
Emerging opportunities include the application of IP valuation in emerging markets, particularly in the Asia-Pacific region, and the increasing demand for IP valuation in specialized industries like biotechnology and renewable energy. The development of innovative valuation methodologies tailored to specific IP types and the utilization of blockchain technology to enhance IP management are also promising areas. The growing importance of data privacy and its valuation is also an emerging opportunity.
Growth Accelerators in the Intellectual Property Valuation Services Industry
Strategic partnerships between IP valuation firms and technology providers are accelerating growth by improving service efficiency and reach. Technological breakthroughs, particularly in AI and machine learning, are automating processes and improving valuation accuracy. Expansion into untapped markets, including emerging economies, is also driving significant growth.
Key Players Shaping the Intellectual Property Valuation Services Market
- Deloitte
- Price Waterhouse Coopers (PwC)
- Ernst & Young
- Black Stone IP
- Alix Partners
- KPMG
- FTI Consulting
- Mathys & Squire
- Pellegrino & Associates
- Parallel North IP
- CONSOR
- Keystone Strategy
- IPmetrics Intellectual Property Consulting
- Duff & Phelps
- Berkeley Research Group
- Valuation Consulting
- CTY-DH Financials
- Ip21
- ClearView IP
- Metis Partners
- Hilco Valuation Services
- Great American Group
- Nevium Intellectual Property Solutions
- Stout Risius Ross
- Foresight Valuation Group
Notable Milestones in Intellectual Property Valuation Services Sector
- 2020: Increased adoption of AI-powered valuation tools by major players.
- 2021: Several mergers and acquisitions among smaller valuation firms.
- 2022: Launch of new software platforms offering enhanced IP management and valuation capabilities.
- 2023: Increased regulatory scrutiny of IP valuation practices.
- 2024: Significant rise in demand for services related to data privacy valuation.
In-Depth Intellectual Property Valuation Services Market Outlook
The Intellectual Property Valuation Services market is poised for continued strong growth, driven by technological advancements, regulatory changes, and the increasing recognition of IP's strategic importance. Opportunities exist for firms that can leverage technology to enhance efficiency and accuracy, cater to specialized industry needs, and expand into new geographic markets. The market's future success will depend on the ability of firms to adapt to evolving regulatory landscapes and meet the growing demand for sophisticated valuation services.
Intellectual Property Valuation Services Segmentation
-
1. Application
- 1.1. Acquisitions and Mergers
- 1.2. Intellectual Property Licensing and Transfer
- 1.3. Litigation and Dispute Resolution
- 1.4. Risk Management and Insurance
- 1.5. Others
-
2. Type
- 2.1. Patent
- 2.2. Trademark
- 2.3. Copyright
- 2.4. Trade Secret
- 2.5. Technology
- 2.6. Others
Intellectual Property Valuation Services Segmentation By Geography
-
1. North America
- 1.1. United States
- 1.2. Canada
- 1.3. Mexico
-
2. South America
- 2.1. Brazil
- 2.2. Argentina
- 2.3. Rest of South America
-
3. Europe
- 3.1. United Kingdom
- 3.2. Germany
- 3.3. France
- 3.4. Italy
- 3.5. Spain
- 3.6. Russia
- 3.7. Benelux
- 3.8. Nordics
- 3.9. Rest of Europe
-
4. Middle East & Africa
- 4.1. Turkey
- 4.2. Israel
- 4.3. GCC
- 4.4. North Africa
- 4.5. South Africa
- 4.6. Rest of Middle East & Africa
-
5. Asia Pacific
- 5.1. China
- 5.2. India
- 5.3. Japan
- 5.4. South Korea
- 5.5. ASEAN
- 5.6. Oceania
- 5.7. Rest of Asia Pacific
Intellectual Property Valuation Services Regional Market Share
Geographic Coverage of Intellectual Property Valuation Services
Intellectual Property Valuation Services REPORT HIGHLIGHTS
| Aspects | Details |
|---|---|
| Study Period | 2020-2034 |
| Base Year | 2025 |
| Estimated Year | 2026 |
| Forecast Period | 2026-2034 |
| Historical Period | 2020-2025 |
| Growth Rate | CAGR of 11.16% from 2020-2034 |
| Segmentation |
|
Table of Contents
- 1. Introduction
- 1.1. Research Scope
- 1.2. Market Segmentation
- 1.3. Research Methodology
- 1.4. Definitions and Assumptions
- 2. Executive Summary
- 2.1. Introduction
- 3. Market Dynamics
- 3.1. Introduction
- 3.2. Market Drivers
- 3.3. Market Restrains
- 3.4. Market Trends
- 4. Market Factor Analysis
- 4.1. Porters Five Forces
- 4.2. Supply/Value Chain
- 4.3. PESTEL analysis
- 4.4. Market Entropy
- 4.5. Patent/Trademark Analysis
- 5. Global Intellectual Property Valuation Services Analysis, Insights and Forecast, 2020-2032
- 5.1. Market Analysis, Insights and Forecast - by Application
- 5.1.1. Acquisitions and Mergers
- 5.1.2. Intellectual Property Licensing and Transfer
- 5.1.3. Litigation and Dispute Resolution
- 5.1.4. Risk Management and Insurance
- 5.1.5. Others
- 5.2. Market Analysis, Insights and Forecast - by Type
- 5.2.1. Patent
- 5.2.2. Trademark
- 5.2.3. Copyright
- 5.2.4. Trade Secret
- 5.2.5. Technology
- 5.2.6. Others
- 5.3. Market Analysis, Insights and Forecast - by Region
- 5.3.1. North America
- 5.3.2. South America
- 5.3.3. Europe
- 5.3.4. Middle East & Africa
- 5.3.5. Asia Pacific
- 5.1. Market Analysis, Insights and Forecast - by Application
- 6. North America Intellectual Property Valuation Services Analysis, Insights and Forecast, 2020-2032
- 6.1. Market Analysis, Insights and Forecast - by Application
- 6.1.1. Acquisitions and Mergers
- 6.1.2. Intellectual Property Licensing and Transfer
- 6.1.3. Litigation and Dispute Resolution
- 6.1.4. Risk Management and Insurance
- 6.1.5. Others
- 6.2. Market Analysis, Insights and Forecast - by Type
- 6.2.1. Patent
- 6.2.2. Trademark
- 6.2.3. Copyright
- 6.2.4. Trade Secret
- 6.2.5. Technology
- 6.2.6. Others
- 6.1. Market Analysis, Insights and Forecast - by Application
- 7. South America Intellectual Property Valuation Services Analysis, Insights and Forecast, 2020-2032
- 7.1. Market Analysis, Insights and Forecast - by Application
- 7.1.1. Acquisitions and Mergers
- 7.1.2. Intellectual Property Licensing and Transfer
- 7.1.3. Litigation and Dispute Resolution
- 7.1.4. Risk Management and Insurance
- 7.1.5. Others
- 7.2. Market Analysis, Insights and Forecast - by Type
- 7.2.1. Patent
- 7.2.2. Trademark
- 7.2.3. Copyright
- 7.2.4. Trade Secret
- 7.2.5. Technology
- 7.2.6. Others
- 7.1. Market Analysis, Insights and Forecast - by Application
- 8. Europe Intellectual Property Valuation Services Analysis, Insights and Forecast, 2020-2032
- 8.1. Market Analysis, Insights and Forecast - by Application
- 8.1.1. Acquisitions and Mergers
- 8.1.2. Intellectual Property Licensing and Transfer
- 8.1.3. Litigation and Dispute Resolution
- 8.1.4. Risk Management and Insurance
- 8.1.5. Others
- 8.2. Market Analysis, Insights and Forecast - by Type
- 8.2.1. Patent
- 8.2.2. Trademark
- 8.2.3. Copyright
- 8.2.4. Trade Secret
- 8.2.5. Technology
- 8.2.6. Others
- 8.1. Market Analysis, Insights and Forecast - by Application
- 9. Middle East & Africa Intellectual Property Valuation Services Analysis, Insights and Forecast, 2020-2032
- 9.1. Market Analysis, Insights and Forecast - by Application
- 9.1.1. Acquisitions and Mergers
- 9.1.2. Intellectual Property Licensing and Transfer
- 9.1.3. Litigation and Dispute Resolution
- 9.1.4. Risk Management and Insurance
- 9.1.5. Others
- 9.2. Market Analysis, Insights and Forecast - by Type
- 9.2.1. Patent
- 9.2.2. Trademark
- 9.2.3. Copyright
- 9.2.4. Trade Secret
- 9.2.5. Technology
- 9.2.6. Others
- 9.1. Market Analysis, Insights and Forecast - by Application
- 10. Asia Pacific Intellectual Property Valuation Services Analysis, Insights and Forecast, 2020-2032
- 10.1. Market Analysis, Insights and Forecast - by Application
- 10.1.1. Acquisitions and Mergers
- 10.1.2. Intellectual Property Licensing and Transfer
- 10.1.3. Litigation and Dispute Resolution
- 10.1.4. Risk Management and Insurance
- 10.1.5. Others
- 10.2. Market Analysis, Insights and Forecast - by Type
- 10.2.1. Patent
- 10.2.2. Trademark
- 10.2.3. Copyright
- 10.2.4. Trade Secret
- 10.2.5. Technology
- 10.2.6. Others
- 10.1. Market Analysis, Insights and Forecast - by Application
- 11. Competitive Analysis
- 11.1. Global Market Share Analysis 2025
- 11.2. Company Profiles
- 11.2.1 Deloitte
- 11.2.1.1. Overview
- 11.2.1.2. Products
- 11.2.1.3. SWOT Analysis
- 11.2.1.4. Recent Developments
- 11.2.1.5. Financials (Based on Availability)
- 11.2.2 Price Waterhouse Coopers (PwC)
- 11.2.2.1. Overview
- 11.2.2.2. Products
- 11.2.2.3. SWOT Analysis
- 11.2.2.4. Recent Developments
- 11.2.2.5. Financials (Based on Availability)
- 11.2.3 Ernst & Young
- 11.2.3.1. Overview
- 11.2.3.2. Products
- 11.2.3.3. SWOT Analysis
- 11.2.3.4. Recent Developments
- 11.2.3.5. Financials (Based on Availability)
- 11.2.4 Black Stone IP
- 11.2.4.1. Overview
- 11.2.4.2. Products
- 11.2.4.3. SWOT Analysis
- 11.2.4.4. Recent Developments
- 11.2.4.5. Financials (Based on Availability)
- 11.2.5 Alix Partners
- 11.2.5.1. Overview
- 11.2.5.2. Products
- 11.2.5.3. SWOT Analysis
- 11.2.5.4. Recent Developments
- 11.2.5.5. Financials (Based on Availability)
- 11.2.6 KPMG
- 11.2.6.1. Overview
- 11.2.6.2. Products
- 11.2.6.3. SWOT Analysis
- 11.2.6.4. Recent Developments
- 11.2.6.5. Financials (Based on Availability)
- 11.2.7 FTI Consulting
- 11.2.7.1. Overview
- 11.2.7.2. Products
- 11.2.7.3. SWOT Analysis
- 11.2.7.4. Recent Developments
- 11.2.7.5. Financials (Based on Availability)
- 11.2.8 Mathys & Squire
- 11.2.8.1. Overview
- 11.2.8.2. Products
- 11.2.8.3. SWOT Analysis
- 11.2.8.4. Recent Developments
- 11.2.8.5. Financials (Based on Availability)
- 11.2.9 Pellegrino & Associates
- 11.2.9.1. Overview
- 11.2.9.2. Products
- 11.2.9.3. SWOT Analysis
- 11.2.9.4. Recent Developments
- 11.2.9.5. Financials (Based on Availability)
- 11.2.10 Parallel North IP
- 11.2.10.1. Overview
- 11.2.10.2. Products
- 11.2.10.3. SWOT Analysis
- 11.2.10.4. Recent Developments
- 11.2.10.5. Financials (Based on Availability)
- 11.2.11 CONSOR
- 11.2.11.1. Overview
- 11.2.11.2. Products
- 11.2.11.3. SWOT Analysis
- 11.2.11.4. Recent Developments
- 11.2.11.5. Financials (Based on Availability)
- 11.2.12 Keystone Strategy
- 11.2.12.1. Overview
- 11.2.12.2. Products
- 11.2.12.3. SWOT Analysis
- 11.2.12.4. Recent Developments
- 11.2.12.5. Financials (Based on Availability)
- 11.2.13 IPmetrics Intellectual Property Consulting
- 11.2.13.1. Overview
- 11.2.13.2. Products
- 11.2.13.3. SWOT Analysis
- 11.2.13.4. Recent Developments
- 11.2.13.5. Financials (Based on Availability)
- 11.2.14 Duff & Phelps
- 11.2.14.1. Overview
- 11.2.14.2. Products
- 11.2.14.3. SWOT Analysis
- 11.2.14.4. Recent Developments
- 11.2.14.5. Financials (Based on Availability)
- 11.2.15 Berkeley Research Group
- 11.2.15.1. Overview
- 11.2.15.2. Products
- 11.2.15.3. SWOT Analysis
- 11.2.15.4. Recent Developments
- 11.2.15.5. Financials (Based on Availability)
- 11.2.16 Valuation Consulting
- 11.2.16.1. Overview
- 11.2.16.2. Products
- 11.2.16.3. SWOT Analysis
- 11.2.16.4. Recent Developments
- 11.2.16.5. Financials (Based on Availability)
- 11.2.17 CTY-DH Financials
- 11.2.17.1. Overview
- 11.2.17.2. Products
- 11.2.17.3. SWOT Analysis
- 11.2.17.4. Recent Developments
- 11.2.17.5. Financials (Based on Availability)
- 11.2.18 Ip21
- 11.2.18.1. Overview
- 11.2.18.2. Products
- 11.2.18.3. SWOT Analysis
- 11.2.18.4. Recent Developments
- 11.2.18.5. Financials (Based on Availability)
- 11.2.19 ClearView IP
- 11.2.19.1. Overview
- 11.2.19.2. Products
- 11.2.19.3. SWOT Analysis
- 11.2.19.4. Recent Developments
- 11.2.19.5. Financials (Based on Availability)
- 11.2.20 Metis Partners
- 11.2.20.1. Overview
- 11.2.20.2. Products
- 11.2.20.3. SWOT Analysis
- 11.2.20.4. Recent Developments
- 11.2.20.5. Financials (Based on Availability)
- 11.2.21 Hilco Valuation Services
- 11.2.21.1. Overview
- 11.2.21.2. Products
- 11.2.21.3. SWOT Analysis
- 11.2.21.4. Recent Developments
- 11.2.21.5. Financials (Based on Availability)
- 11.2.22 Great American Group
- 11.2.22.1. Overview
- 11.2.22.2. Products
- 11.2.22.3. SWOT Analysis
- 11.2.22.4. Recent Developments
- 11.2.22.5. Financials (Based on Availability)
- 11.2.23 Nevium Intellectual Property Solutions
- 11.2.23.1. Overview
- 11.2.23.2. Products
- 11.2.23.3. SWOT Analysis
- 11.2.23.4. Recent Developments
- 11.2.23.5. Financials (Based on Availability)
- 11.2.24 Stout Risius Ross
- 11.2.24.1. Overview
- 11.2.24.2. Products
- 11.2.24.3. SWOT Analysis
- 11.2.24.4. Recent Developments
- 11.2.24.5. Financials (Based on Availability)
- 11.2.25 Foresight Valuation Group
- 11.2.25.1. Overview
- 11.2.25.2. Products
- 11.2.25.3. SWOT Analysis
- 11.2.25.4. Recent Developments
- 11.2.25.5. Financials (Based on Availability)
- 11.2.1 Deloitte
List of Figures
- Figure 1: Global Intellectual Property Valuation Services Revenue Breakdown (undefined, %) by Region 2025 & 2033
- Figure 2: North America Intellectual Property Valuation Services Revenue (undefined), by Application 2025 & 2033
- Figure 3: North America Intellectual Property Valuation Services Revenue Share (%), by Application 2025 & 2033
- Figure 4: North America Intellectual Property Valuation Services Revenue (undefined), by Type 2025 & 2033
- Figure 5: North America Intellectual Property Valuation Services Revenue Share (%), by Type 2025 & 2033
- Figure 6: North America Intellectual Property Valuation Services Revenue (undefined), by Country 2025 & 2033
- Figure 7: North America Intellectual Property Valuation Services Revenue Share (%), by Country 2025 & 2033
- Figure 8: South America Intellectual Property Valuation Services Revenue (undefined), by Application 2025 & 2033
- Figure 9: South America Intellectual Property Valuation Services Revenue Share (%), by Application 2025 & 2033
- Figure 10: South America Intellectual Property Valuation Services Revenue (undefined), by Type 2025 & 2033
- Figure 11: South America Intellectual Property Valuation Services Revenue Share (%), by Type 2025 & 2033
- Figure 12: South America Intellectual Property Valuation Services Revenue (undefined), by Country 2025 & 2033
- Figure 13: South America Intellectual Property Valuation Services Revenue Share (%), by Country 2025 & 2033
- Figure 14: Europe Intellectual Property Valuation Services Revenue (undefined), by Application 2025 & 2033
- Figure 15: Europe Intellectual Property Valuation Services Revenue Share (%), by Application 2025 & 2033
- Figure 16: Europe Intellectual Property Valuation Services Revenue (undefined), by Type 2025 & 2033
- Figure 17: Europe Intellectual Property Valuation Services Revenue Share (%), by Type 2025 & 2033
- Figure 18: Europe Intellectual Property Valuation Services Revenue (undefined), by Country 2025 & 2033
- Figure 19: Europe Intellectual Property Valuation Services Revenue Share (%), by Country 2025 & 2033
- Figure 20: Middle East & Africa Intellectual Property Valuation Services Revenue (undefined), by Application 2025 & 2033
- Figure 21: Middle East & Africa Intellectual Property Valuation Services Revenue Share (%), by Application 2025 & 2033
- Figure 22: Middle East & Africa Intellectual Property Valuation Services Revenue (undefined), by Type 2025 & 2033
- Figure 23: Middle East & Africa Intellectual Property Valuation Services Revenue Share (%), by Type 2025 & 2033
- Figure 24: Middle East & Africa Intellectual Property Valuation Services Revenue (undefined), by Country 2025 & 2033
- Figure 25: Middle East & Africa Intellectual Property Valuation Services Revenue Share (%), by Country 2025 & 2033
- Figure 26: Asia Pacific Intellectual Property Valuation Services Revenue (undefined), by Application 2025 & 2033
- Figure 27: Asia Pacific Intellectual Property Valuation Services Revenue Share (%), by Application 2025 & 2033
- Figure 28: Asia Pacific Intellectual Property Valuation Services Revenue (undefined), by Type 2025 & 2033
- Figure 29: Asia Pacific Intellectual Property Valuation Services Revenue Share (%), by Type 2025 & 2033
- Figure 30: Asia Pacific Intellectual Property Valuation Services Revenue (undefined), by Country 2025 & 2033
- Figure 31: Asia Pacific Intellectual Property Valuation Services Revenue Share (%), by Country 2025 & 2033
List of Tables
- Table 1: Global Intellectual Property Valuation Services Revenue undefined Forecast, by Application 2020 & 2033
- Table 2: Global Intellectual Property Valuation Services Revenue undefined Forecast, by Type 2020 & 2033
- Table 3: Global Intellectual Property Valuation Services Revenue undefined Forecast, by Region 2020 & 2033
- Table 4: Global Intellectual Property Valuation Services Revenue undefined Forecast, by Application 2020 & 2033
- Table 5: Global Intellectual Property Valuation Services Revenue undefined Forecast, by Type 2020 & 2033
- Table 6: Global Intellectual Property Valuation Services Revenue undefined Forecast, by Country 2020 & 2033
- Table 7: United States Intellectual Property Valuation Services Revenue (undefined) Forecast, by Application 2020 & 2033
- Table 8: Canada Intellectual Property Valuation Services Revenue (undefined) Forecast, by Application 2020 & 2033
- Table 9: Mexico Intellectual Property Valuation Services Revenue (undefined) Forecast, by Application 2020 & 2033
- Table 10: Global Intellectual Property Valuation Services Revenue undefined Forecast, by Application 2020 & 2033
- Table 11: Global Intellectual Property Valuation Services Revenue undefined Forecast, by Type 2020 & 2033
- Table 12: Global Intellectual Property Valuation Services Revenue undefined Forecast, by Country 2020 & 2033
- Table 13: Brazil Intellectual Property Valuation Services Revenue (undefined) Forecast, by Application 2020 & 2033
- Table 14: Argentina Intellectual Property Valuation Services Revenue (undefined) Forecast, by Application 2020 & 2033
- Table 15: Rest of South America Intellectual Property Valuation Services Revenue (undefined) Forecast, by Application 2020 & 2033
- Table 16: Global Intellectual Property Valuation Services Revenue undefined Forecast, by Application 2020 & 2033
- Table 17: Global Intellectual Property Valuation Services Revenue undefined Forecast, by Type 2020 & 2033
- Table 18: Global Intellectual Property Valuation Services Revenue undefined Forecast, by Country 2020 & 2033
- Table 19: United Kingdom Intellectual Property Valuation Services Revenue (undefined) Forecast, by Application 2020 & 2033
- Table 20: Germany Intellectual Property Valuation Services Revenue (undefined) Forecast, by Application 2020 & 2033
- Table 21: France Intellectual Property Valuation Services Revenue (undefined) Forecast, by Application 2020 & 2033
- Table 22: Italy Intellectual Property Valuation Services Revenue (undefined) Forecast, by Application 2020 & 2033
- Table 23: Spain Intellectual Property Valuation Services Revenue (undefined) Forecast, by Application 2020 & 2033
- Table 24: Russia Intellectual Property Valuation Services Revenue (undefined) Forecast, by Application 2020 & 2033
- Table 25: Benelux Intellectual Property Valuation Services Revenue (undefined) Forecast, by Application 2020 & 2033
- Table 26: Nordics Intellectual Property Valuation Services Revenue (undefined) Forecast, by Application 2020 & 2033
- Table 27: Rest of Europe Intellectual Property Valuation Services Revenue (undefined) Forecast, by Application 2020 & 2033
- Table 28: Global Intellectual Property Valuation Services Revenue undefined Forecast, by Application 2020 & 2033
- Table 29: Global Intellectual Property Valuation Services Revenue undefined Forecast, by Type 2020 & 2033
- Table 30: Global Intellectual Property Valuation Services Revenue undefined Forecast, by Country 2020 & 2033
- Table 31: Turkey Intellectual Property Valuation Services Revenue (undefined) Forecast, by Application 2020 & 2033
- Table 32: Israel Intellectual Property Valuation Services Revenue (undefined) Forecast, by Application 2020 & 2033
- Table 33: GCC Intellectual Property Valuation Services Revenue (undefined) Forecast, by Application 2020 & 2033
- Table 34: North Africa Intellectual Property Valuation Services Revenue (undefined) Forecast, by Application 2020 & 2033
- Table 35: South Africa Intellectual Property Valuation Services Revenue (undefined) Forecast, by Application 2020 & 2033
- Table 36: Rest of Middle East & Africa Intellectual Property Valuation Services Revenue (undefined) Forecast, by Application 2020 & 2033
- Table 37: Global Intellectual Property Valuation Services Revenue undefined Forecast, by Application 2020 & 2033
- Table 38: Global Intellectual Property Valuation Services Revenue undefined Forecast, by Type 2020 & 2033
- Table 39: Global Intellectual Property Valuation Services Revenue undefined Forecast, by Country 2020 & 2033
- Table 40: China Intellectual Property Valuation Services Revenue (undefined) Forecast, by Application 2020 & 2033
- Table 41: India Intellectual Property Valuation Services Revenue (undefined) Forecast, by Application 2020 & 2033
- Table 42: Japan Intellectual Property Valuation Services Revenue (undefined) Forecast, by Application 2020 & 2033
- Table 43: South Korea Intellectual Property Valuation Services Revenue (undefined) Forecast, by Application 2020 & 2033
- Table 44: ASEAN Intellectual Property Valuation Services Revenue (undefined) Forecast, by Application 2020 & 2033
- Table 45: Oceania Intellectual Property Valuation Services Revenue (undefined) Forecast, by Application 2020 & 2033
- Table 46: Rest of Asia Pacific Intellectual Property Valuation Services Revenue (undefined) Forecast, by Application 2020 & 2033
Frequently Asked Questions
1. What is the projected Compound Annual Growth Rate (CAGR) of the Intellectual Property Valuation Services?
The projected CAGR is approximately 11.16%.
2. Which companies are prominent players in the Intellectual Property Valuation Services?
Key companies in the market include Deloitte, Price Waterhouse Coopers (PwC), Ernst & Young, Black Stone IP, Alix Partners, KPMG, FTI Consulting, Mathys & Squire, Pellegrino & Associates, Parallel North IP, CONSOR, Keystone Strategy, IPmetrics Intellectual Property Consulting, Duff & Phelps, Berkeley Research Group, Valuation Consulting, CTY-DH Financials, Ip21, ClearView IP, Metis Partners, Hilco Valuation Services, Great American Group, Nevium Intellectual Property Solutions, Stout Risius Ross, Foresight Valuation Group.
3. What are the main segments of the Intellectual Property Valuation Services?
The market segments include Application, Type.
4. Can you provide details about the market size?
The market size is estimated to be USD XXX N/A as of 2022.
5. What are some drivers contributing to market growth?
N/A
6. What are the notable trends driving market growth?
N/A
7. Are there any restraints impacting market growth?
N/A
8. Can you provide examples of recent developments in the market?
N/A
9. What pricing options are available for accessing the report?
Pricing options include single-user, multi-user, and enterprise licenses priced at USD 3950.00, USD 5925.00, and USD 7900.00 respectively.
10. Is the market size provided in terms of value or volume?
The market size is provided in terms of value, measured in N/A.
11. Are there any specific market keywords associated with the report?
Yes, the market keyword associated with the report is "Intellectual Property Valuation Services," which aids in identifying and referencing the specific market segment covered.
12. How do I determine which pricing option suits my needs best?
The pricing options vary based on user requirements and access needs. Individual users may opt for single-user licenses, while businesses requiring broader access may choose multi-user or enterprise licenses for cost-effective access to the report.
13. Are there any additional resources or data provided in the Intellectual Property Valuation Services report?
While the report offers comprehensive insights, it's advisable to review the specific contents or supplementary materials provided to ascertain if additional resources or data are available.
14. How can I stay updated on further developments or reports in the Intellectual Property Valuation Services?
To stay informed about further developments, trends, and reports in the Intellectual Property Valuation Services, consider subscribing to industry newsletters, following relevant companies and organizations, or regularly checking reputable industry news sources and publications.
Methodology
Step 1 - Identification of Relevant Samples Size from Population Database


Step 2 - Approaches for Defining Global Market Size (Value, Volume* & Price*)

Note*: In applicable scenarios
Step 3 - Data Sources
Primary Research
- Web Analytics
- Survey Reports
- Research Institute
- Latest Research Reports
- Opinion Leaders
Secondary Research
- Annual Reports
- White Paper
- Latest Press Release
- Industry Association
- Paid Database
- Investor Presentations

Step 4 - Data Triangulation
Involves using different sources of information in order to increase the validity of a study
These sources are likely to be stakeholders in a program - participants, other researchers, program staff, other community members, and so on.
Then we put all data in single framework & apply various statistical tools to find out the dynamic on the market.
During the analysis stage, feedback from the stakeholder groups would be compared to determine areas of agreement as well as areas of divergence