

Key Insights
The global medical X-ray equipment and imaging software market is experiencing robust growth, projected at a 4.60% CAGR from 2025 to 2033. This expansion is fueled by several key drivers. Technological advancements, such as the development of AI-powered image analysis and improved detector technologies leading to higher resolution images with lower radiation doses, are significantly impacting market growth. Increasing prevalence of chronic diseases requiring frequent imaging, coupled with a rising geriatric population susceptible to age-related ailments, further boosts demand. The rising adoption of minimally invasive surgical procedures, which often rely heavily on real-time X-ray imaging guidance, also contributes. Furthermore, expanding healthcare infrastructure in developing nations and increasing government initiatives focused on improving healthcare access are creating new market opportunities. The market is segmented by type (equipment and software, 2D and 3D), technology (radiography/mammography, computed tomography, fluoroscopy/angiography), and end-user (hospitals, diagnostic centers, research centers). The equipment segment currently dominates, but the software segment is witnessing rapid growth due to the increasing adoption of digital imaging and image analysis solutions.
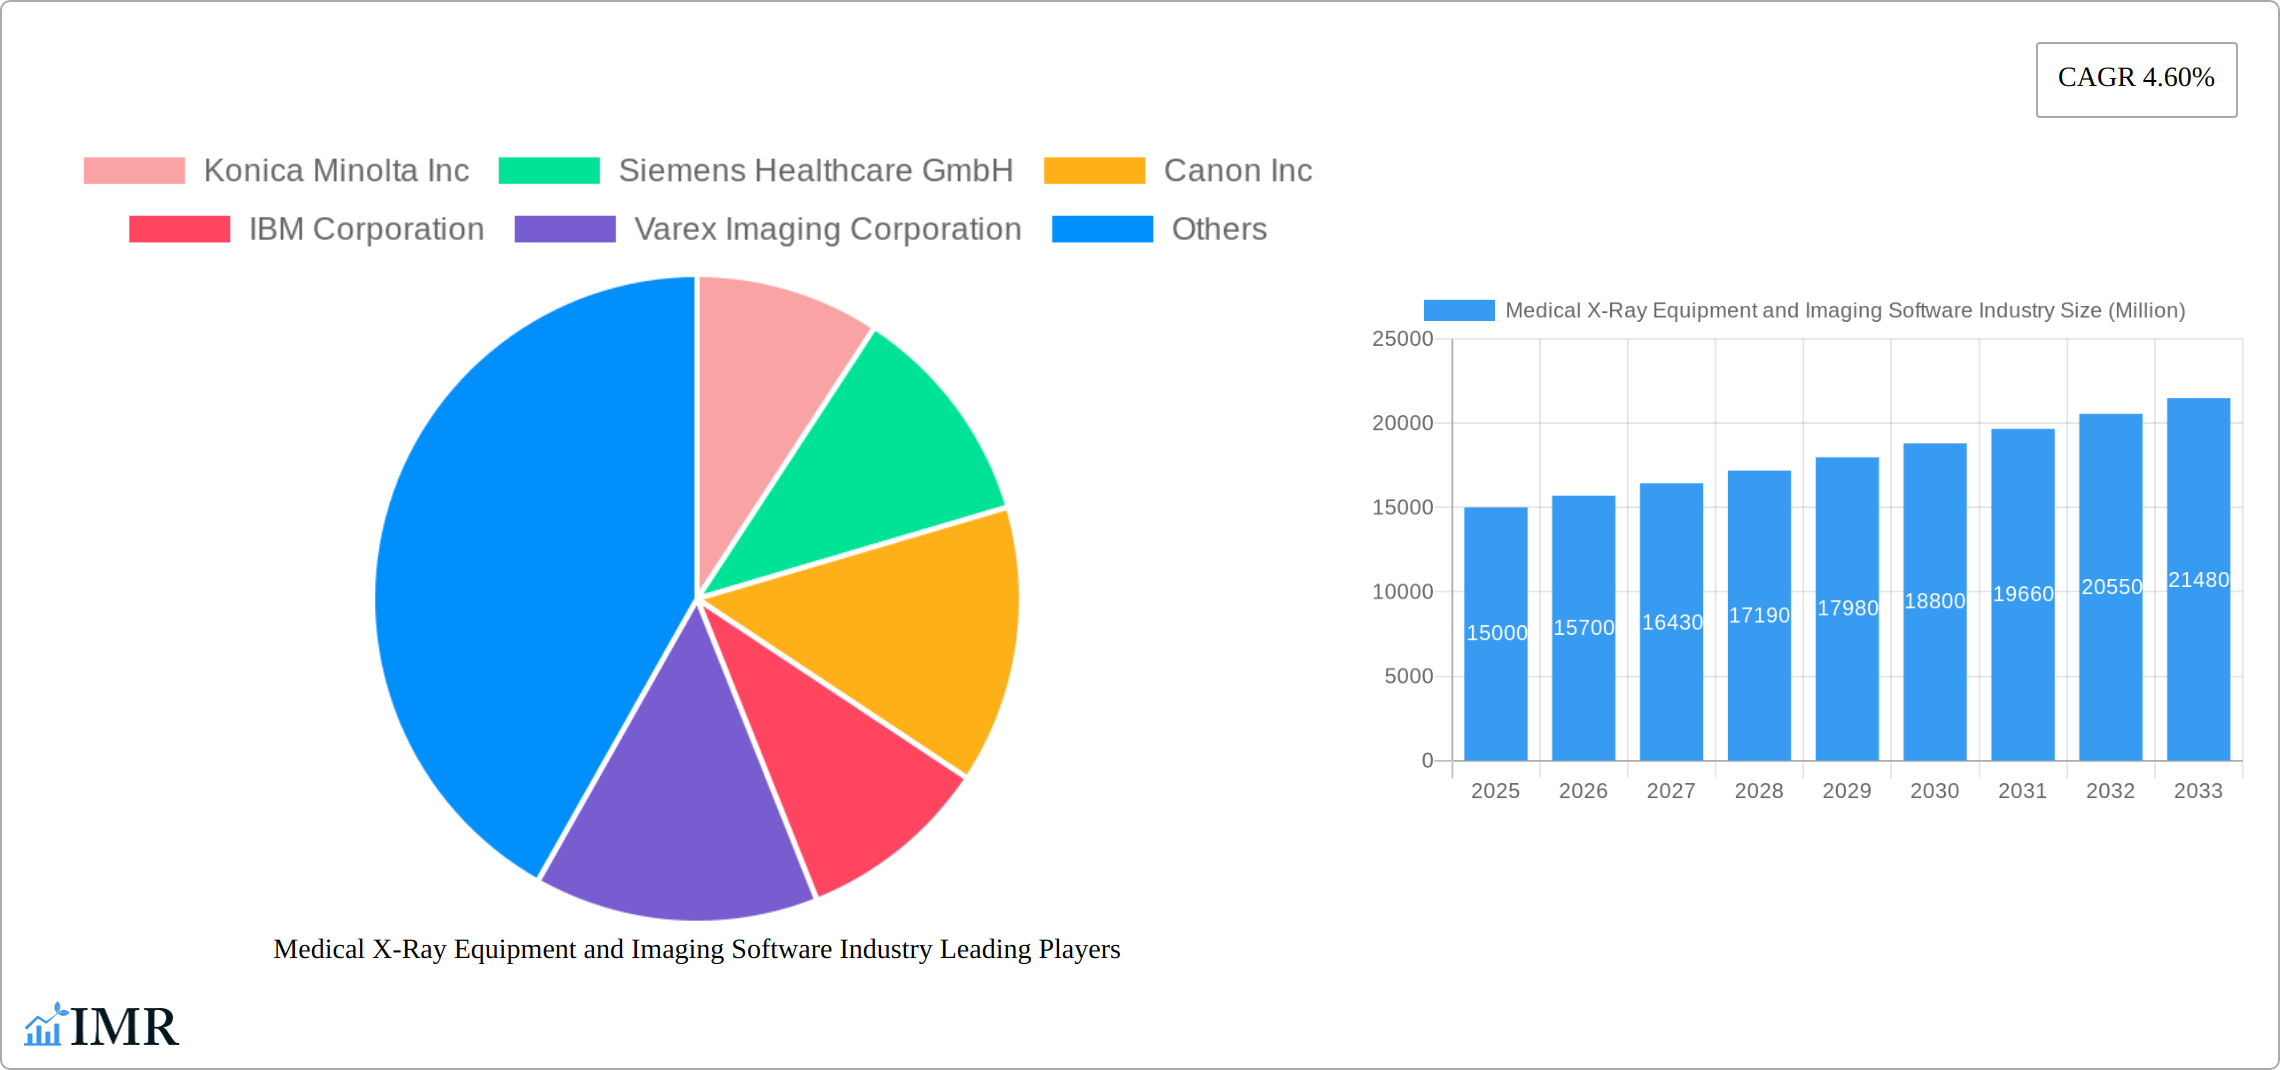
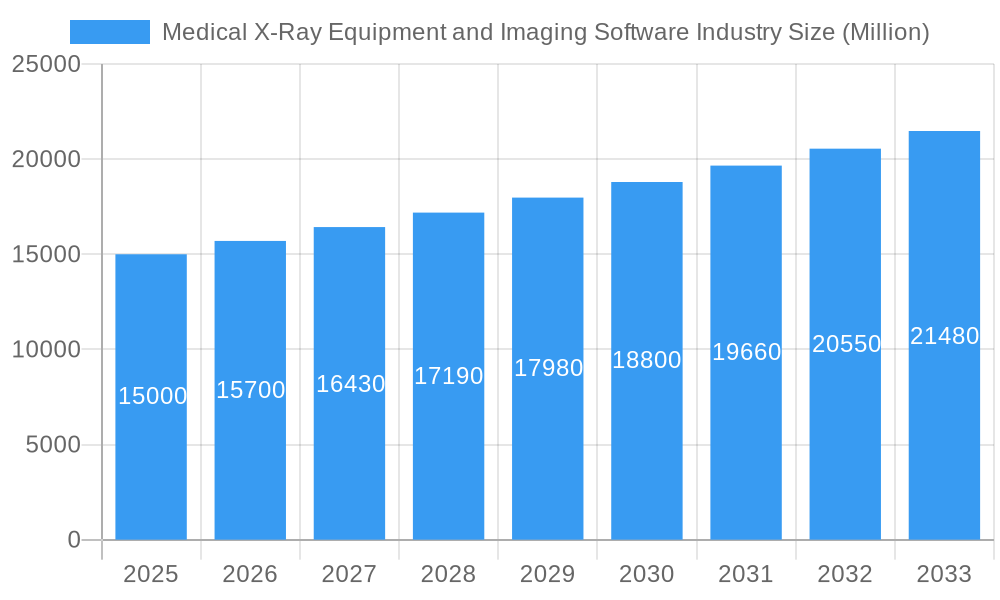
Medical X-Ray Equipment and Imaging Software Industry Market Size (In Billion)
Competition is fierce, with established players like GE Healthcare, Siemens Healthineers, Philips, and Fujifilm competing alongside other significant players such as Konica Minolta, Canon, and Carestream Health. These companies are actively involved in research and development, strategic partnerships, and acquisitions to maintain their market share and expand their product portfolios. While the market faces challenges such as high equipment costs and stringent regulatory approvals, these are being offset by the increasing availability of financing options and a growing emphasis on cost-effective healthcare solutions. Regional growth patterns are diverse, with North America and Europe currently holding the largest market shares due to well-established healthcare infrastructure and high adoption rates. However, rapidly developing economies in Asia-Pacific are anticipated to exhibit significant growth potential in the coming years, driven by rising healthcare expenditure and increasing disposable incomes.
Medical X-Ray Equipment and Imaging Software Industry Company Market Share
Medical X-Ray Equipment and Imaging Software Industry Market Report: 2019-2033
This comprehensive report provides an in-depth analysis of the Medical X-Ray Equipment and Imaging Software industry, encompassing market dynamics, growth trends, competitive landscape, and future outlook. The study period covers 2019-2033, with 2025 as the base and estimated year. The report segments the market by type (Equipment, Software), technology (Radiography/Mammography, Computed Tomography, Fluoroscopy/Angiography), and end-user (Hospitals, Diagnostic Centers, Research Centers), offering granular insights into this vital sector of healthcare technology. The market size is valued in million units.
Medical X-Ray Equipment and Imaging Software Industry Market Dynamics & Structure
The medical X-ray equipment and imaging software market is characterized by a dynamic and evolving landscape. While moderately concentrated, it features a mix of established global conglomerates and specialized innovators. Key players such as Konica Minolta Inc., Siemens Healthcare GmbH, Canon Inc., IBM Corporation, Varex Imaging Corporation, Hitachi Ltd., Shimadzu Corporation, Hologic Inc., Koninklijke Philips N.V., GE Healthcare Inc., Carestream Health Inc., and Fujifilm Holdings Corporation continue to hold significant market share through their comprehensive product portfolios and extensive global reach. The market's robust growth trajectory is propelled by relentless technological advancements, including the integration of Artificial Intelligence (AI) for enhanced image analysis and diagnostics, the increasing prevalence of chronic diseases necessitating advanced diagnostic imaging, and a consistent rise in global healthcare expenditure.
- Market Concentration & Key Players: The top 10 players collectively commanded approximately 70-75% of the global market share in 2025, indicating a significant concentration among leading vendors. This concentration is driven by substantial R&D investments, strong brand recognition, and extensive distribution networks.
- Technological Innovation as a Growth Engine: The industry is witnessing rapid innovation with AI-powered image analysis poised to revolutionize diagnostic accuracy and speed. Advancements in 3D imaging offer deeper insights, while the development and adoption of portable and mobile X-ray systems are enhancing accessibility and efficiency in diverse clinical settings.
- Navigating the Regulatory Landscape: Stringent regulatory approvals and evolving safety standards, particularly concerning radiation exposure and data privacy, significantly influence market entry, product development cycles, and ongoing compliance efforts for manufacturers.
- Competitive Substitutes & Market Differentiation: While X-ray remains a cornerstone of diagnostic imaging, it faces competitive pressure from alternative modalities like ultrasound, MRI, and CT scans. Manufacturers differentiate by focusing on improved image quality, reduced radiation dosage, faster acquisition times, and enhanced workflow integration.
- Evolving End-User Demographics: The market is experiencing sustained growth driven by the increasing prevalence of an aging global population, which is more susceptible to conditions requiring diagnostic imaging, and the rising incidence of lifestyle-related and chronic diseases.
- Strategic Mergers & Acquisitions: The past five years have seen a notable trend of strategic M&A activity within the sector, with approximately 15-20 significant deals. These acquisitions are primarily focused on consolidating product portfolios, acquiring innovative technologies (especially in AI and software), and expanding market reach into untapped regions. The estimated total value of these deals is in the range of $500 - $700 million, highlighting the strategic importance of consolidation and capability enhancement.
Medical X-Ray Equipment and Imaging Software Industry Growth Trends & Insights
The global medical X-ray equipment and imaging software market exhibited a CAGR of xx% during the historical period (2019-2024) and is projected to grow at a CAGR of xx% during the forecast period (2025-2033), reaching a market value of xx million units by 2033. This growth is attributed to factors such as increasing demand for advanced imaging technologies, rising healthcare spending, technological advancements in image processing and analysis, and increasing adoption of tele-radiology. Market penetration of digital X-ray systems continues to increase, while the adoption of AI-powered diagnostic tools is gaining momentum. Consumer behavior is shifting towards preference for higher image quality, faster diagnosis, and reduced radiation exposure.
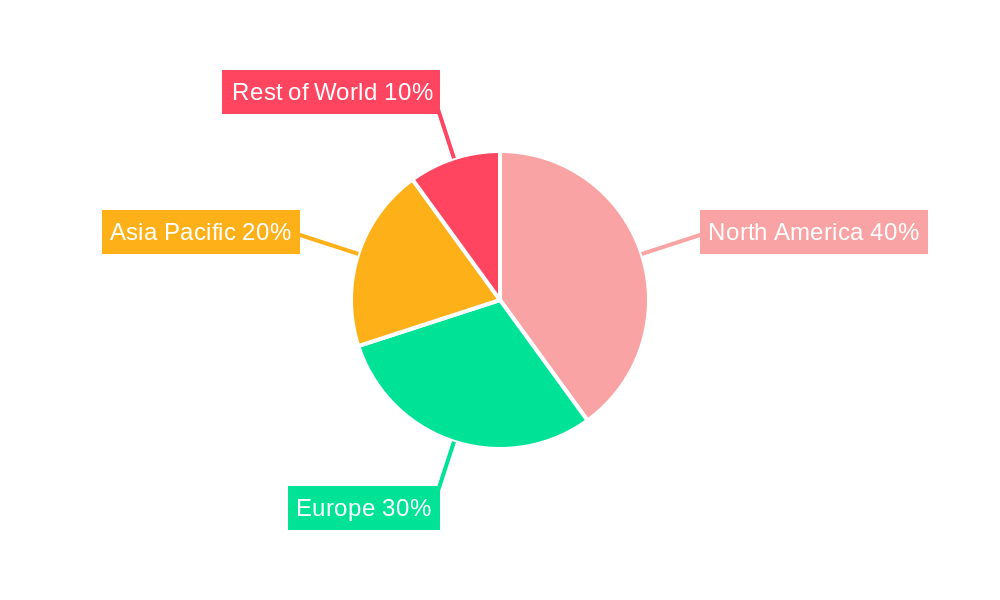
Dominant Regions, Countries, or Segments in Medical X-Ray Equipment and Imaging Software Industry
North America currently spearheads the global market for medical X-ray equipment and imaging software, driven by its robust healthcare infrastructure, substantial investment in advanced medical technologies, and high adoption rates of innovative diagnostic solutions. Europe follows closely, characterized by its strong regulatory frameworks, an aging population prone to chronic diseases, and a growing demand for sophisticated diagnostic imaging. The Asia-Pacific region presents a significant growth opportunity, fueled by rapid economic development, escalating healthcare expenditures, and increasing awareness and accessibility of advanced medical services. Within the market segments, the 'Equipment' segment continues to dominate by value due to the substantial capital investment required for high-end systems. However, the 'Software' segment is experiencing rapid growth, particularly with the integration of AI and advanced analytics. The 'Radiography/Mammography' technology segment remains a cornerstone, widely adopted for its versatility and cost-effectiveness, while also showing promising growth. Hospitals, with their comprehensive diagnostic needs and patient volumes, represent the largest and most significant end-user segment.
-
Key Regional Drivers:
- North America: Characterized by high per capita healthcare spending, a well-established reimbursement system, advanced technological infrastructure, and a strong culture of early adoption for cutting-edge medical innovations.
- Europe: Benefitting from strong government support for healthcare modernization, stringent quality and safety standards, a high prevalence of chronic diseases, and a growing demand for integrated diagnostic and therapeutic solutions.
- Asia-Pacific: Experiencing accelerated growth due to rapid economic expansion, increasing disposable incomes, a burgeoning middle class with greater access to healthcare, significant investments in public and private healthcare facilities, and a rising awareness of preventive healthcare.
-
Dominant and Growing Segments:
- By Type: The Equipment segment is projected to account for over $8 billion units in 2025, underscoring the high capital expenditure inherent in acquiring advanced X-ray systems. The Software segment, while smaller in unit volume (estimated at $3 billion units in 2025), is rapidly expanding due to the increasing demand for AI-driven diagnostics, PACS (Picture Archiving and Communication Systems), and RIS (Radiology Information Systems).
- By Technology: The Radiography/Mammography segment is expected to see substantial growth, reaching approximately $6 billion units in 2025. Its widespread applications in general diagnostics and women's health, coupled with its relative affordability, contribute to its dominance and continued expansion.
- By End-User: Hospitals remain the largest end-user segment, with an estimated $7 billion units in diagnostic X-ray procedures and equipment utilization in 2025. Their high patient throughput and the need for a broad spectrum of imaging capabilities make them the primary market for these technologies. Outpatient imaging centers and specialized clinics are also emerging as significant growth segments.
Medical X-Ray Equipment and Imaging Software Industry Product Landscape
The product landscape within the medical X-ray equipment and imaging software industry is remarkably diverse, encompassing a continuum from foundational 2D X-ray systems to sophisticated 3D imaging solutions augmented by Artificial Intelligence (AI). A significant trend is the proliferation of mobile X-ray systems, designed to enhance portability and deployability in a wide array of clinical environments, including emergency response, remote patient care, and bedside diagnostics, thereby improving operational efficiency and patient accessibility. Key performance indicators for these products are meticulously evaluated, focusing on critical aspects such as image resolution for diagnostic clarity, optimization of radiation dose to minimize patient exposure, speed of image acquisition for workflow efficiency, and user-friendliness of interfaces for healthcare professionals. Manufacturers consistently strive to differentiate their offerings through compelling unique selling propositions that highlight superior image quality, demonstrably reduced radiation exposure levels, streamlined workflow integration, and demonstrable cost-effectiveness over the product lifecycle. Furthermore, the software component is becoming increasingly integral, offering advanced image processing, AI-driven diagnostic assistance, and seamless integration with existing healthcare IT infrastructures.
Key Drivers, Barriers & Challenges in Medical X-Ray Equipment and Imaging Software Industry
Key Drivers: The industry's expansion is fundamentally driven by continuous technological innovation, particularly in the integration of AI for advanced image analysis and interpretation, alongside the development of high-resolution 3D imaging capabilities. The persistent and increasing prevalence of chronic diseases worldwide necessitates sophisticated diagnostic imaging tools. Growing global healthcare expenditure, coupled with supportive government initiatives aimed at enhancing healthcare infrastructure and promoting digital health adoption, further fuels market growth. The demand for more accessible and efficient diagnostic solutions, especially in underserved regions, also acts as a significant driver.
Barriers & Challenges: A primary barrier remains the substantial initial investment costs associated with acquiring cutting-edge X-ray equipment and integrated software solutions, which can be prohibitive for smaller healthcare facilities. Stringent and evolving regulatory approval processes, while crucial for patient safety, can prolong time-to-market for new products and add significant compliance overhead. Competition from alternative imaging modalities, such as MRI and CT scans, requires continuous innovation and value proposition refinement. Furthermore, a persistent challenge is the need for a highly skilled workforce capable of operating advanced equipment and interpreting complex diagnostic images, alongside the ongoing maintenance and calibration requirements of sophisticated medical devices. Supply chain disruptions, exacerbated by geopolitical factors and global events, have led to a notable increase in equipment costs, with an estimated xx% rise in equipment prices observed in 2024 compared to 2019, impacting both procurement and overall market affordability.
Emerging Opportunities in Medical X-Ray Equipment and Imaging Software Industry
Emerging opportunities lie in the development of AI-powered diagnostic tools, the expansion of mobile X-ray services to underserved areas, and the integration of X-ray imaging with other diagnostic modalities. The growth of tele-radiology and the increasing demand for point-of-care diagnostics also present significant opportunities.
Growth Accelerators in the Medical X-Ray Equipment and Imaging Software Industry Industry
The sustained long-term growth of the medical X-ray equipment and imaging software industry is poised to be significantly accelerated by several key strategic initiatives and market trends. Strategic partnerships and collaborations between leading equipment manufacturers and innovative software developers are crucial for co-creating integrated solutions that leverage the strengths of both hardware and software. Expanding market penetration into emerging economies, where healthcare infrastructure is rapidly developing and demand for diagnostic imaging is surging, represents a significant growth frontier. Continued, focused investment in technological innovation, particularly in the areas of AI-powered image analysis for enhanced diagnostic accuracy and speed, and the advancement of real-time 3D imaging techniques for more detailed anatomical visualization, will remain critical differentiators. Moreover, proactive government initiatives that support the digital transformation of healthcare systems, incentivize the adoption of advanced medical technologies, and promote the development of robust healthcare infrastructure will act as powerful catalysts, further accelerating the market's expansion and its ability to meet the growing global demand for effective diagnostic imaging solutions.
Key Players Shaping the Medical X-Ray Equipment and Imaging Software Industry Market
- Konica Minolta Inc
- Siemens Healthcare GmbH
- Canon Inc
- IBM Corporation
- Varex Imaging Corporation
- Hitachi Ltd
- Shimazdu Corporation
- Hologic Inc
- Koninklijke Philips NV
- GE Healthcare Inc
- Carestream Health Inc
- Fujifilm Holdings Corporation
Notable Milestones in Medical X-Ray Equipment and Imaging Software Industry Sector
- July 2023: Shimadzu Corporation launched the MobileDaRt Evolution MX8 version k type mobile X-ray system with Dynamic Digital Radiography (DDR).
- May 2023: Carestream Health introduced the DRX-Rise Mobile X-ray System, enhancing its mobile X-ray portfolio.
In-Depth Medical X-Ray Equipment and Imaging Software Industry Market Outlook
The medical X-ray equipment and imaging software market is poised for robust growth over the next decade, driven by technological advancements, increasing healthcare expenditure, and a growing need for efficient and accurate diagnostic tools. Strategic investments in research and development, coupled with strategic partnerships and market expansion strategies, will further enhance the market's future potential. The integration of AI and machine learning will be pivotal in shaping future market dynamics, improving diagnostic accuracy, and enhancing workflow efficiency.
Medical X-Ray Equipment and Imaging Software Industry Segmentation
-
1. Type
- 1.1. Equipment
- 1.2. Software
-
2. Technology
- 2.1. Radiography/Mammography
- 2.2. Computed Tomography
- 2.3. Fluoroscopy/Angiography
-
3. Image Type
- 3.1. 2-Dimensional
- 3.2. 3-Dimensional
-
4. End-user
- 4.1. Hospitals
- 4.2. Diagnostic Centers
- 4.3. Research Centers
Medical X-Ray Equipment and Imaging Software Industry Segmentation By Geography
- 1. North America
- 2. Europe
- 3. Asia
- 4. Australia and New Zealand
- 5. Middle East and Africa
- 6. Latin America
Medical X-Ray Equipment and Imaging Software Industry Regional Market Share
Geographic Coverage of Medical X-Ray Equipment and Imaging Software Industry
Medical X-Ray Equipment and Imaging Software Industry REPORT HIGHLIGHTS
| Aspects | Details |
|---|---|
| Study Period | 2020-2034 |
| Base Year | 2025 |
| Estimated Year | 2026 |
| Forecast Period | 2026-2034 |
| Historical Period | 2020-2025 |
| Growth Rate | CAGR of 4.60% from 2020-2034 |
| Segmentation |
|
Table of Contents
- 1. Introduction
- 1.1. Research Scope
- 1.2. Market Segmentation
- 1.3. Research Objective
- 1.4. Definitions and Assumptions
- 2. Executive Summary
- 2.1. Market Snapshot
- 3. Market Dynamics
- 3.1. Market Drivers
- 3.2. Market Restrains
- 3.3. Market Trends
- 3.4. Market Opportunities
- 4. Market Factor Analysis
- 4.1. Porters Five Forces
- 4.1.1. Bargaining Power of Suppliers
- 4.1.2. Bargaining Power of Buyers
- 4.1.3. Threat of New Entrants
- 4.1.4. Threat of Substitutes
- 4.1.5. Competitive Rivalry
- 4.2. PESTEL analysis
- 4.3. BCG Analysis
- 4.3.1. Stars (High Growth, High Market Share)
- 4.3.2. Cash Cows (Low Growth, High Market Share)
- 4.3.3. Question Mark (High Growth, Low Market Share)
- 4.3.4. Dogs (Low Growth, Low Market Share)
- 4.4. Ansoff Matrix Analysis
- 4.5. Supply Chain Analysis
- 4.6. Regulatory Landscape
- 4.7. Current Market Potential and Opportunity Assessment (TAM–SAM–SOM Framework)
- 4.8. IMR Analyst Note
- 4.1. Porters Five Forces
- 5. Market Analysis, Insights and Forecast 2021-2033
- 5.1. Market Analysis, Insights and Forecast - by Type
- 5.1.1. Equipment
- 5.1.2. Software
- 5.2. Market Analysis, Insights and Forecast - by Technology
- 5.2.1. Radiography/Mammography
- 5.2.2. Computed Tomography
- 5.2.3. Fluoroscopy/Angiography
- 5.3. Market Analysis, Insights and Forecast - by Image Type
- 5.3.1. 2-Dimensional
- 5.3.2. 3-Dimensional
- 5.4. Market Analysis, Insights and Forecast - by End-user
- 5.4.1. Hospitals
- 5.4.2. Diagnostic Centers
- 5.4.3. Research Centers
- 5.5. Market Analysis, Insights and Forecast - by Region
- 5.5.1. North America
- 5.5.2. Europe
- 5.5.3. Asia
- 5.5.4. Australia and New Zealand
- 5.5.5. Middle East and Africa
- 5.5.6. Latin America
- 5.1. Market Analysis, Insights and Forecast - by Type
- 6. Global Medical X-Ray Equipment and Imaging Software Industry Analysis, Insights and Forecast, 2021-2033
- 6.1. Market Analysis, Insights and Forecast - by Type
- 6.1.1. Equipment
- 6.1.2. Software
- 6.2. Market Analysis, Insights and Forecast - by Technology
- 6.2.1. Radiography/Mammography
- 6.2.2. Computed Tomography
- 6.2.3. Fluoroscopy/Angiography
- 6.3. Market Analysis, Insights and Forecast - by Image Type
- 6.3.1. 2-Dimensional
- 6.3.2. 3-Dimensional
- 6.4. Market Analysis, Insights and Forecast - by End-user
- 6.4.1. Hospitals
- 6.4.2. Diagnostic Centers
- 6.4.3. Research Centers
- 6.1. Market Analysis, Insights and Forecast - by Type
- 7. North America Medical X-Ray Equipment and Imaging Software Industry Analysis, Insights and Forecast, 2020-2032
- 7.1. Market Analysis, Insights and Forecast - by Type
- 7.1.1. Equipment
- 7.1.2. Software
- 7.2. Market Analysis, Insights and Forecast - by Technology
- 7.2.1. Radiography/Mammography
- 7.2.2. Computed Tomography
- 7.2.3. Fluoroscopy/Angiography
- 7.3. Market Analysis, Insights and Forecast - by Image Type
- 7.3.1. 2-Dimensional
- 7.3.2. 3-Dimensional
- 7.4. Market Analysis, Insights and Forecast - by End-user
- 7.4.1. Hospitals
- 7.4.2. Diagnostic Centers
- 7.4.3. Research Centers
- 7.1. Market Analysis, Insights and Forecast - by Type
- 8. Europe Medical X-Ray Equipment and Imaging Software Industry Analysis, Insights and Forecast, 2020-2032
- 8.1. Market Analysis, Insights and Forecast - by Type
- 8.1.1. Equipment
- 8.1.2. Software
- 8.2. Market Analysis, Insights and Forecast - by Technology
- 8.2.1. Radiography/Mammography
- 8.2.2. Computed Tomography
- 8.2.3. Fluoroscopy/Angiography
- 8.3. Market Analysis, Insights and Forecast - by Image Type
- 8.3.1. 2-Dimensional
- 8.3.2. 3-Dimensional
- 8.4. Market Analysis, Insights and Forecast - by End-user
- 8.4.1. Hospitals
- 8.4.2. Diagnostic Centers
- 8.4.3. Research Centers
- 8.1. Market Analysis, Insights and Forecast - by Type
- 9. Asia Medical X-Ray Equipment and Imaging Software Industry Analysis, Insights and Forecast, 2020-2032
- 9.1. Market Analysis, Insights and Forecast - by Type
- 9.1.1. Equipment
- 9.1.2. Software
- 9.2. Market Analysis, Insights and Forecast - by Technology
- 9.2.1. Radiography/Mammography
- 9.2.2. Computed Tomography
- 9.2.3. Fluoroscopy/Angiography
- 9.3. Market Analysis, Insights and Forecast - by Image Type
- 9.3.1. 2-Dimensional
- 9.3.2. 3-Dimensional
- 9.4. Market Analysis, Insights and Forecast - by End-user
- 9.4.1. Hospitals
- 9.4.2. Diagnostic Centers
- 9.4.3. Research Centers
- 9.1. Market Analysis, Insights and Forecast - by Type
- 10. Australia and New Zealand Medical X-Ray Equipment and Imaging Software Industry Analysis, Insights and Forecast, 2020-2032
- 10.1. Market Analysis, Insights and Forecast - by Type
- 10.1.1. Equipment
- 10.1.2. Software
- 10.2. Market Analysis, Insights and Forecast - by Technology
- 10.2.1. Radiography/Mammography
- 10.2.2. Computed Tomography
- 10.2.3. Fluoroscopy/Angiography
- 10.3. Market Analysis, Insights and Forecast - by Image Type
- 10.3.1. 2-Dimensional
- 10.3.2. 3-Dimensional
- 10.4. Market Analysis, Insights and Forecast - by End-user
- 10.4.1. Hospitals
- 10.4.2. Diagnostic Centers
- 10.4.3. Research Centers
- 10.1. Market Analysis, Insights and Forecast - by Type
- 11. Middle East and Africa Medical X-Ray Equipment and Imaging Software Industry Analysis, Insights and Forecast, 2020-2032
- 11.1. Market Analysis, Insights and Forecast - by Type
- 11.1.1. Equipment
- 11.1.2. Software
- 11.2. Market Analysis, Insights and Forecast - by Technology
- 11.2.1. Radiography/Mammography
- 11.2.2. Computed Tomography
- 11.2.3. Fluoroscopy/Angiography
- 11.3. Market Analysis, Insights and Forecast - by Image Type
- 11.3.1. 2-Dimensional
- 11.3.2. 3-Dimensional
- 11.4. Market Analysis, Insights and Forecast - by End-user
- 11.4.1. Hospitals
- 11.4.2. Diagnostic Centers
- 11.4.3. Research Centers
- 11.1. Market Analysis, Insights and Forecast - by Type
- 12. Latin America Medical X-Ray Equipment and Imaging Software Industry Analysis, Insights and Forecast, 2020-2032
- 12.1. Market Analysis, Insights and Forecast - by Type
- 12.1.1. Equipment
- 12.1.2. Software
- 12.2. Market Analysis, Insights and Forecast - by Technology
- 12.2.1. Radiography/Mammography
- 12.2.2. Computed Tomography
- 12.2.3. Fluoroscopy/Angiography
- 12.3. Market Analysis, Insights and Forecast - by Image Type
- 12.3.1. 2-Dimensional
- 12.3.2. 3-Dimensional
- 12.4. Market Analysis, Insights and Forecast - by End-user
- 12.4.1. Hospitals
- 12.4.2. Diagnostic Centers
- 12.4.3. Research Centers
- 12.1. Market Analysis, Insights and Forecast - by Type
- 13. Competitive Analysis
- 13.1. Company Profiles
- 13.1.1 Konica Minolta Inc
- 13.1.1.1. Company Overview
- 13.1.1.2. Products
- 13.1.1.3. Company Financials
- 13.1.1.4. SWOT Analysis
- 13.1.2 Siemens Healthcare GmbH
- 13.1.2.1. Company Overview
- 13.1.2.2. Products
- 13.1.2.3. Company Financials
- 13.1.2.4. SWOT Analysis
- 13.1.3 Canon Inc
- 13.1.3.1. Company Overview
- 13.1.3.2. Products
- 13.1.3.3. Company Financials
- 13.1.3.4. SWOT Analysis
- 13.1.4 IBM Corporation
- 13.1.4.1. Company Overview
- 13.1.4.2. Products
- 13.1.4.3. Company Financials
- 13.1.4.4. SWOT Analysis
- 13.1.5 Varex Imaging Corporation
- 13.1.5.1. Company Overview
- 13.1.5.2. Products
- 13.1.5.3. Company Financials
- 13.1.5.4. SWOT Analysis
- 13.1.6 Hitachi Ltd
- 13.1.6.1. Company Overview
- 13.1.6.2. Products
- 13.1.6.3. Company Financials
- 13.1.6.4. SWOT Analysis
- 13.1.7 Shimazdu Corporation
- 13.1.7.1. Company Overview
- 13.1.7.2. Products
- 13.1.7.3. Company Financials
- 13.1.7.4. SWOT Analysis
- 13.1.8 Hologic Inc
- 13.1.8.1. Company Overview
- 13.1.8.2. Products
- 13.1.8.3. Company Financials
- 13.1.8.4. SWOT Analysis
- 13.1.9 Koninklijke Philips NV
- 13.1.9.1. Company Overview
- 13.1.9.2. Products
- 13.1.9.3. Company Financials
- 13.1.9.4. SWOT Analysis
- 13.1.10 GE Healthcare Inc
- 13.1.10.1. Company Overview
- 13.1.10.2. Products
- 13.1.10.3. Company Financials
- 13.1.10.4. SWOT Analysis
- 13.1.11 Carestream Health Inc
- 13.1.11.1. Company Overview
- 13.1.11.2. Products
- 13.1.11.3. Company Financials
- 13.1.11.4. SWOT Analysis
- 13.1.12 Fujifilm Holdings Corporation
- 13.1.12.1. Company Overview
- 13.1.12.2. Products
- 13.1.12.3. Company Financials
- 13.1.12.4. SWOT Analysis
- 13.1.1 Konica Minolta Inc
- 13.2. Market Entropy
- 13.2.1 Company's Key Areas Served
- 13.2.2 Recent Developments
- 13.3. Company Market Share Analysis 2025
- 13.3.1 Top 5 Companies Market Share Analysis
- 13.3.2 Top 3 Companies Market Share Analysis
- 13.4. List of Potential Customers
- 14. Research Methodology
List of Figures
- Figure 1: Global Medical X-Ray Equipment and Imaging Software Industry Revenue Breakdown (Million, %) by Region 2025 & 2033
- Figure 2: Global Medical X-Ray Equipment and Imaging Software Industry Volume Breakdown (K Unit, %) by Region 2025 & 2033
- Figure 3: North America Medical X-Ray Equipment and Imaging Software Industry Revenue (Million), by Type 2025 & 2033
- Figure 4: North America Medical X-Ray Equipment and Imaging Software Industry Volume (K Unit), by Type 2025 & 2033
- Figure 5: North America Medical X-Ray Equipment and Imaging Software Industry Revenue Share (%), by Type 2025 & 2033
- Figure 6: North America Medical X-Ray Equipment and Imaging Software Industry Volume Share (%), by Type 2025 & 2033
- Figure 7: North America Medical X-Ray Equipment and Imaging Software Industry Revenue (Million), by Technology 2025 & 2033
- Figure 8: North America Medical X-Ray Equipment and Imaging Software Industry Volume (K Unit), by Technology 2025 & 2033
- Figure 9: North America Medical X-Ray Equipment and Imaging Software Industry Revenue Share (%), by Technology 2025 & 2033
- Figure 10: North America Medical X-Ray Equipment and Imaging Software Industry Volume Share (%), by Technology 2025 & 2033
- Figure 11: North America Medical X-Ray Equipment and Imaging Software Industry Revenue (Million), by Image Type 2025 & 2033
- Figure 12: North America Medical X-Ray Equipment and Imaging Software Industry Volume (K Unit), by Image Type 2025 & 2033
- Figure 13: North America Medical X-Ray Equipment and Imaging Software Industry Revenue Share (%), by Image Type 2025 & 2033
- Figure 14: North America Medical X-Ray Equipment and Imaging Software Industry Volume Share (%), by Image Type 2025 & 2033
- Figure 15: North America Medical X-Ray Equipment and Imaging Software Industry Revenue (Million), by End-user 2025 & 2033
- Figure 16: North America Medical X-Ray Equipment and Imaging Software Industry Volume (K Unit), by End-user 2025 & 2033
- Figure 17: North America Medical X-Ray Equipment and Imaging Software Industry Revenue Share (%), by End-user 2025 & 2033
- Figure 18: North America Medical X-Ray Equipment and Imaging Software Industry Volume Share (%), by End-user 2025 & 2033
- Figure 19: North America Medical X-Ray Equipment and Imaging Software Industry Revenue (Million), by Country 2025 & 2033
- Figure 20: North America Medical X-Ray Equipment and Imaging Software Industry Volume (K Unit), by Country 2025 & 2033
- Figure 21: North America Medical X-Ray Equipment and Imaging Software Industry Revenue Share (%), by Country 2025 & 2033
- Figure 22: North America Medical X-Ray Equipment and Imaging Software Industry Volume Share (%), by Country 2025 & 2033
- Figure 23: Europe Medical X-Ray Equipment and Imaging Software Industry Revenue (Million), by Type 2025 & 2033
- Figure 24: Europe Medical X-Ray Equipment and Imaging Software Industry Volume (K Unit), by Type 2025 & 2033
- Figure 25: Europe Medical X-Ray Equipment and Imaging Software Industry Revenue Share (%), by Type 2025 & 2033
- Figure 26: Europe Medical X-Ray Equipment and Imaging Software Industry Volume Share (%), by Type 2025 & 2033
- Figure 27: Europe Medical X-Ray Equipment and Imaging Software Industry Revenue (Million), by Technology 2025 & 2033
- Figure 28: Europe Medical X-Ray Equipment and Imaging Software Industry Volume (K Unit), by Technology 2025 & 2033
- Figure 29: Europe Medical X-Ray Equipment and Imaging Software Industry Revenue Share (%), by Technology 2025 & 2033
- Figure 30: Europe Medical X-Ray Equipment and Imaging Software Industry Volume Share (%), by Technology 2025 & 2033
- Figure 31: Europe Medical X-Ray Equipment and Imaging Software Industry Revenue (Million), by Image Type 2025 & 2033
- Figure 32: Europe Medical X-Ray Equipment and Imaging Software Industry Volume (K Unit), by Image Type 2025 & 2033
- Figure 33: Europe Medical X-Ray Equipment and Imaging Software Industry Revenue Share (%), by Image Type 2025 & 2033
- Figure 34: Europe Medical X-Ray Equipment and Imaging Software Industry Volume Share (%), by Image Type 2025 & 2033
- Figure 35: Europe Medical X-Ray Equipment and Imaging Software Industry Revenue (Million), by End-user 2025 & 2033
- Figure 36: Europe Medical X-Ray Equipment and Imaging Software Industry Volume (K Unit), by End-user 2025 & 2033
- Figure 37: Europe Medical X-Ray Equipment and Imaging Software Industry Revenue Share (%), by End-user 2025 & 2033
- Figure 38: Europe Medical X-Ray Equipment and Imaging Software Industry Volume Share (%), by End-user 2025 & 2033
- Figure 39: Europe Medical X-Ray Equipment and Imaging Software Industry Revenue (Million), by Country 2025 & 2033
- Figure 40: Europe Medical X-Ray Equipment and Imaging Software Industry Volume (K Unit), by Country 2025 & 2033
- Figure 41: Europe Medical X-Ray Equipment and Imaging Software Industry Revenue Share (%), by Country 2025 & 2033
- Figure 42: Europe Medical X-Ray Equipment and Imaging Software Industry Volume Share (%), by Country 2025 & 2033
- Figure 43: Asia Medical X-Ray Equipment and Imaging Software Industry Revenue (Million), by Type 2025 & 2033
- Figure 44: Asia Medical X-Ray Equipment and Imaging Software Industry Volume (K Unit), by Type 2025 & 2033
- Figure 45: Asia Medical X-Ray Equipment and Imaging Software Industry Revenue Share (%), by Type 2025 & 2033
- Figure 46: Asia Medical X-Ray Equipment and Imaging Software Industry Volume Share (%), by Type 2025 & 2033
- Figure 47: Asia Medical X-Ray Equipment and Imaging Software Industry Revenue (Million), by Technology 2025 & 2033
- Figure 48: Asia Medical X-Ray Equipment and Imaging Software Industry Volume (K Unit), by Technology 2025 & 2033
- Figure 49: Asia Medical X-Ray Equipment and Imaging Software Industry Revenue Share (%), by Technology 2025 & 2033
- Figure 50: Asia Medical X-Ray Equipment and Imaging Software Industry Volume Share (%), by Technology 2025 & 2033
- Figure 51: Asia Medical X-Ray Equipment and Imaging Software Industry Revenue (Million), by Image Type 2025 & 2033
- Figure 52: Asia Medical X-Ray Equipment and Imaging Software Industry Volume (K Unit), by Image Type 2025 & 2033
- Figure 53: Asia Medical X-Ray Equipment and Imaging Software Industry Revenue Share (%), by Image Type 2025 & 2033
- Figure 54: Asia Medical X-Ray Equipment and Imaging Software Industry Volume Share (%), by Image Type 2025 & 2033
- Figure 55: Asia Medical X-Ray Equipment and Imaging Software Industry Revenue (Million), by End-user 2025 & 2033
- Figure 56: Asia Medical X-Ray Equipment and Imaging Software Industry Volume (K Unit), by End-user 2025 & 2033
- Figure 57: Asia Medical X-Ray Equipment and Imaging Software Industry Revenue Share (%), by End-user 2025 & 2033
- Figure 58: Asia Medical X-Ray Equipment and Imaging Software Industry Volume Share (%), by End-user 2025 & 2033
- Figure 59: Asia Medical X-Ray Equipment and Imaging Software Industry Revenue (Million), by Country 2025 & 2033
- Figure 60: Asia Medical X-Ray Equipment and Imaging Software Industry Volume (K Unit), by Country 2025 & 2033
- Figure 61: Asia Medical X-Ray Equipment and Imaging Software Industry Revenue Share (%), by Country 2025 & 2033
- Figure 62: Asia Medical X-Ray Equipment and Imaging Software Industry Volume Share (%), by Country 2025 & 2033
- Figure 63: Australia and New Zealand Medical X-Ray Equipment and Imaging Software Industry Revenue (Million), by Type 2025 & 2033
- Figure 64: Australia and New Zealand Medical X-Ray Equipment and Imaging Software Industry Volume (K Unit), by Type 2025 & 2033
- Figure 65: Australia and New Zealand Medical X-Ray Equipment and Imaging Software Industry Revenue Share (%), by Type 2025 & 2033
- Figure 66: Australia and New Zealand Medical X-Ray Equipment and Imaging Software Industry Volume Share (%), by Type 2025 & 2033
- Figure 67: Australia and New Zealand Medical X-Ray Equipment and Imaging Software Industry Revenue (Million), by Technology 2025 & 2033
- Figure 68: Australia and New Zealand Medical X-Ray Equipment and Imaging Software Industry Volume (K Unit), by Technology 2025 & 2033
- Figure 69: Australia and New Zealand Medical X-Ray Equipment and Imaging Software Industry Revenue Share (%), by Technology 2025 & 2033
- Figure 70: Australia and New Zealand Medical X-Ray Equipment and Imaging Software Industry Volume Share (%), by Technology 2025 & 2033
- Figure 71: Australia and New Zealand Medical X-Ray Equipment and Imaging Software Industry Revenue (Million), by Image Type 2025 & 2033
- Figure 72: Australia and New Zealand Medical X-Ray Equipment and Imaging Software Industry Volume (K Unit), by Image Type 2025 & 2033
- Figure 73: Australia and New Zealand Medical X-Ray Equipment and Imaging Software Industry Revenue Share (%), by Image Type 2025 & 2033
- Figure 74: Australia and New Zealand Medical X-Ray Equipment and Imaging Software Industry Volume Share (%), by Image Type 2025 & 2033
- Figure 75: Australia and New Zealand Medical X-Ray Equipment and Imaging Software Industry Revenue (Million), by End-user 2025 & 2033
- Figure 76: Australia and New Zealand Medical X-Ray Equipment and Imaging Software Industry Volume (K Unit), by End-user 2025 & 2033
- Figure 77: Australia and New Zealand Medical X-Ray Equipment and Imaging Software Industry Revenue Share (%), by End-user 2025 & 2033
- Figure 78: Australia and New Zealand Medical X-Ray Equipment and Imaging Software Industry Volume Share (%), by End-user 2025 & 2033
- Figure 79: Australia and New Zealand Medical X-Ray Equipment and Imaging Software Industry Revenue (Million), by Country 2025 & 2033
- Figure 80: Australia and New Zealand Medical X-Ray Equipment and Imaging Software Industry Volume (K Unit), by Country 2025 & 2033
- Figure 81: Australia and New Zealand Medical X-Ray Equipment and Imaging Software Industry Revenue Share (%), by Country 2025 & 2033
- Figure 82: Australia and New Zealand Medical X-Ray Equipment and Imaging Software Industry Volume Share (%), by Country 2025 & 2033
- Figure 83: Middle East and Africa Medical X-Ray Equipment and Imaging Software Industry Revenue (Million), by Type 2025 & 2033
- Figure 84: Middle East and Africa Medical X-Ray Equipment and Imaging Software Industry Volume (K Unit), by Type 2025 & 2033
- Figure 85: Middle East and Africa Medical X-Ray Equipment and Imaging Software Industry Revenue Share (%), by Type 2025 & 2033
- Figure 86: Middle East and Africa Medical X-Ray Equipment and Imaging Software Industry Volume Share (%), by Type 2025 & 2033
- Figure 87: Middle East and Africa Medical X-Ray Equipment and Imaging Software Industry Revenue (Million), by Technology 2025 & 2033
- Figure 88: Middle East and Africa Medical X-Ray Equipment and Imaging Software Industry Volume (K Unit), by Technology 2025 & 2033
- Figure 89: Middle East and Africa Medical X-Ray Equipment and Imaging Software Industry Revenue Share (%), by Technology 2025 & 2033
- Figure 90: Middle East and Africa Medical X-Ray Equipment and Imaging Software Industry Volume Share (%), by Technology 2025 & 2033
- Figure 91: Middle East and Africa Medical X-Ray Equipment and Imaging Software Industry Revenue (Million), by Image Type 2025 & 2033
- Figure 92: Middle East and Africa Medical X-Ray Equipment and Imaging Software Industry Volume (K Unit), by Image Type 2025 & 2033
- Figure 93: Middle East and Africa Medical X-Ray Equipment and Imaging Software Industry Revenue Share (%), by Image Type 2025 & 2033
- Figure 94: Middle East and Africa Medical X-Ray Equipment and Imaging Software Industry Volume Share (%), by Image Type 2025 & 2033
- Figure 95: Middle East and Africa Medical X-Ray Equipment and Imaging Software Industry Revenue (Million), by End-user 2025 & 2033
- Figure 96: Middle East and Africa Medical X-Ray Equipment and Imaging Software Industry Volume (K Unit), by End-user 2025 & 2033
- Figure 97: Middle East and Africa Medical X-Ray Equipment and Imaging Software Industry Revenue Share (%), by End-user 2025 & 2033
- Figure 98: Middle East and Africa Medical X-Ray Equipment and Imaging Software Industry Volume Share (%), by End-user 2025 & 2033
- Figure 99: Middle East and Africa Medical X-Ray Equipment and Imaging Software Industry Revenue (Million), by Country 2025 & 2033
- Figure 100: Middle East and Africa Medical X-Ray Equipment and Imaging Software Industry Volume (K Unit), by Country 2025 & 2033
- Figure 101: Middle East and Africa Medical X-Ray Equipment and Imaging Software Industry Revenue Share (%), by Country 2025 & 2033
- Figure 102: Middle East and Africa Medical X-Ray Equipment and Imaging Software Industry Volume Share (%), by Country 2025 & 2033
- Figure 103: Latin America Medical X-Ray Equipment and Imaging Software Industry Revenue (Million), by Type 2025 & 2033
- Figure 104: Latin America Medical X-Ray Equipment and Imaging Software Industry Volume (K Unit), by Type 2025 & 2033
- Figure 105: Latin America Medical X-Ray Equipment and Imaging Software Industry Revenue Share (%), by Type 2025 & 2033
- Figure 106: Latin America Medical X-Ray Equipment and Imaging Software Industry Volume Share (%), by Type 2025 & 2033
- Figure 107: Latin America Medical X-Ray Equipment and Imaging Software Industry Revenue (Million), by Technology 2025 & 2033
- Figure 108: Latin America Medical X-Ray Equipment and Imaging Software Industry Volume (K Unit), by Technology 2025 & 2033
- Figure 109: Latin America Medical X-Ray Equipment and Imaging Software Industry Revenue Share (%), by Technology 2025 & 2033
- Figure 110: Latin America Medical X-Ray Equipment and Imaging Software Industry Volume Share (%), by Technology 2025 & 2033
- Figure 111: Latin America Medical X-Ray Equipment and Imaging Software Industry Revenue (Million), by Image Type 2025 & 2033
- Figure 112: Latin America Medical X-Ray Equipment and Imaging Software Industry Volume (K Unit), by Image Type 2025 & 2033
- Figure 113: Latin America Medical X-Ray Equipment and Imaging Software Industry Revenue Share (%), by Image Type 2025 & 2033
- Figure 114: Latin America Medical X-Ray Equipment and Imaging Software Industry Volume Share (%), by Image Type 2025 & 2033
- Figure 115: Latin America Medical X-Ray Equipment and Imaging Software Industry Revenue (Million), by End-user 2025 & 2033
- Figure 116: Latin America Medical X-Ray Equipment and Imaging Software Industry Volume (K Unit), by End-user 2025 & 2033
- Figure 117: Latin America Medical X-Ray Equipment and Imaging Software Industry Revenue Share (%), by End-user 2025 & 2033
- Figure 118: Latin America Medical X-Ray Equipment and Imaging Software Industry Volume Share (%), by End-user 2025 & 2033
- Figure 119: Latin America Medical X-Ray Equipment and Imaging Software Industry Revenue (Million), by Country 2025 & 2033
- Figure 120: Latin America Medical X-Ray Equipment and Imaging Software Industry Volume (K Unit), by Country 2025 & 2033
- Figure 121: Latin America Medical X-Ray Equipment and Imaging Software Industry Revenue Share (%), by Country 2025 & 2033
- Figure 122: Latin America Medical X-Ray Equipment and Imaging Software Industry Volume Share (%), by Country 2025 & 2033
List of Tables
- Table 1: Global Medical X-Ray Equipment and Imaging Software Industry Revenue Million Forecast, by Type 2020 & 2033
- Table 2: Global Medical X-Ray Equipment and Imaging Software Industry Volume K Unit Forecast, by Type 2020 & 2033
- Table 3: Global Medical X-Ray Equipment and Imaging Software Industry Revenue Million Forecast, by Technology 2020 & 2033
- Table 4: Global Medical X-Ray Equipment and Imaging Software Industry Volume K Unit Forecast, by Technology 2020 & 2033
- Table 5: Global Medical X-Ray Equipment and Imaging Software Industry Revenue Million Forecast, by Image Type 2020 & 2033
- Table 6: Global Medical X-Ray Equipment and Imaging Software Industry Volume K Unit Forecast, by Image Type 2020 & 2033
- Table 7: Global Medical X-Ray Equipment and Imaging Software Industry Revenue Million Forecast, by End-user 2020 & 2033
- Table 8: Global Medical X-Ray Equipment and Imaging Software Industry Volume K Unit Forecast, by End-user 2020 & 2033
- Table 9: Global Medical X-Ray Equipment and Imaging Software Industry Revenue Million Forecast, by Region 2020 & 2033
- Table 10: Global Medical X-Ray Equipment and Imaging Software Industry Volume K Unit Forecast, by Region 2020 & 2033
- Table 11: Global Medical X-Ray Equipment and Imaging Software Industry Revenue Million Forecast, by Type 2020 & 2033
- Table 12: Global Medical X-Ray Equipment and Imaging Software Industry Volume K Unit Forecast, by Type 2020 & 2033
- Table 13: Global Medical X-Ray Equipment and Imaging Software Industry Revenue Million Forecast, by Technology 2020 & 2033
- Table 14: Global Medical X-Ray Equipment and Imaging Software Industry Volume K Unit Forecast, by Technology 2020 & 2033
- Table 15: Global Medical X-Ray Equipment and Imaging Software Industry Revenue Million Forecast, by Image Type 2020 & 2033
- Table 16: Global Medical X-Ray Equipment and Imaging Software Industry Volume K Unit Forecast, by Image Type 2020 & 2033
- Table 17: Global Medical X-Ray Equipment and Imaging Software Industry Revenue Million Forecast, by End-user 2020 & 2033
- Table 18: Global Medical X-Ray Equipment and Imaging Software Industry Volume K Unit Forecast, by End-user 2020 & 2033
- Table 19: Global Medical X-Ray Equipment and Imaging Software Industry Revenue Million Forecast, by Country 2020 & 2033
- Table 20: Global Medical X-Ray Equipment and Imaging Software Industry Volume K Unit Forecast, by Country 2020 & 2033
- Table 21: Global Medical X-Ray Equipment and Imaging Software Industry Revenue Million Forecast, by Type 2020 & 2033
- Table 22: Global Medical X-Ray Equipment and Imaging Software Industry Volume K Unit Forecast, by Type 2020 & 2033
- Table 23: Global Medical X-Ray Equipment and Imaging Software Industry Revenue Million Forecast, by Technology 2020 & 2033
- Table 24: Global Medical X-Ray Equipment and Imaging Software Industry Volume K Unit Forecast, by Technology 2020 & 2033
- Table 25: Global Medical X-Ray Equipment and Imaging Software Industry Revenue Million Forecast, by Image Type 2020 & 2033
- Table 26: Global Medical X-Ray Equipment and Imaging Software Industry Volume K Unit Forecast, by Image Type 2020 & 2033
- Table 27: Global Medical X-Ray Equipment and Imaging Software Industry Revenue Million Forecast, by End-user 2020 & 2033
- Table 28: Global Medical X-Ray Equipment and Imaging Software Industry Volume K Unit Forecast, by End-user 2020 & 2033
- Table 29: Global Medical X-Ray Equipment and Imaging Software Industry Revenue Million Forecast, by Country 2020 & 2033
- Table 30: Global Medical X-Ray Equipment and Imaging Software Industry Volume K Unit Forecast, by Country 2020 & 2033
- Table 31: Global Medical X-Ray Equipment and Imaging Software Industry Revenue Million Forecast, by Type 2020 & 2033
- Table 32: Global Medical X-Ray Equipment and Imaging Software Industry Volume K Unit Forecast, by Type 2020 & 2033
- Table 33: Global Medical X-Ray Equipment and Imaging Software Industry Revenue Million Forecast, by Technology 2020 & 2033
- Table 34: Global Medical X-Ray Equipment and Imaging Software Industry Volume K Unit Forecast, by Technology 2020 & 2033
- Table 35: Global Medical X-Ray Equipment and Imaging Software Industry Revenue Million Forecast, by Image Type 2020 & 2033
- Table 36: Global Medical X-Ray Equipment and Imaging Software Industry Volume K Unit Forecast, by Image Type 2020 & 2033
- Table 37: Global Medical X-Ray Equipment and Imaging Software Industry Revenue Million Forecast, by End-user 2020 & 2033
- Table 38: Global Medical X-Ray Equipment and Imaging Software Industry Volume K Unit Forecast, by End-user 2020 & 2033
- Table 39: Global Medical X-Ray Equipment and Imaging Software Industry Revenue Million Forecast, by Country 2020 & 2033
- Table 40: Global Medical X-Ray Equipment and Imaging Software Industry Volume K Unit Forecast, by Country 2020 & 2033
- Table 41: Global Medical X-Ray Equipment and Imaging Software Industry Revenue Million Forecast, by Type 2020 & 2033
- Table 42: Global Medical X-Ray Equipment and Imaging Software Industry Volume K Unit Forecast, by Type 2020 & 2033
- Table 43: Global Medical X-Ray Equipment and Imaging Software Industry Revenue Million Forecast, by Technology 2020 & 2033
- Table 44: Global Medical X-Ray Equipment and Imaging Software Industry Volume K Unit Forecast, by Technology 2020 & 2033
- Table 45: Global Medical X-Ray Equipment and Imaging Software Industry Revenue Million Forecast, by Image Type 2020 & 2033
- Table 46: Global Medical X-Ray Equipment and Imaging Software Industry Volume K Unit Forecast, by Image Type 2020 & 2033
- Table 47: Global Medical X-Ray Equipment and Imaging Software Industry Revenue Million Forecast, by End-user 2020 & 2033
- Table 48: Global Medical X-Ray Equipment and Imaging Software Industry Volume K Unit Forecast, by End-user 2020 & 2033
- Table 49: Global Medical X-Ray Equipment and Imaging Software Industry Revenue Million Forecast, by Country 2020 & 2033
- Table 50: Global Medical X-Ray Equipment and Imaging Software Industry Volume K Unit Forecast, by Country 2020 & 2033
- Table 51: Global Medical X-Ray Equipment and Imaging Software Industry Revenue Million Forecast, by Type 2020 & 2033
- Table 52: Global Medical X-Ray Equipment and Imaging Software Industry Volume K Unit Forecast, by Type 2020 & 2033
- Table 53: Global Medical X-Ray Equipment and Imaging Software Industry Revenue Million Forecast, by Technology 2020 & 2033
- Table 54: Global Medical X-Ray Equipment and Imaging Software Industry Volume K Unit Forecast, by Technology 2020 & 2033
- Table 55: Global Medical X-Ray Equipment and Imaging Software Industry Revenue Million Forecast, by Image Type 2020 & 2033
- Table 56: Global Medical X-Ray Equipment and Imaging Software Industry Volume K Unit Forecast, by Image Type 2020 & 2033
- Table 57: Global Medical X-Ray Equipment and Imaging Software Industry Revenue Million Forecast, by End-user 2020 & 2033
- Table 58: Global Medical X-Ray Equipment and Imaging Software Industry Volume K Unit Forecast, by End-user 2020 & 2033
- Table 59: Global Medical X-Ray Equipment and Imaging Software Industry Revenue Million Forecast, by Country 2020 & 2033
- Table 60: Global Medical X-Ray Equipment and Imaging Software Industry Volume K Unit Forecast, by Country 2020 & 2033
- Table 61: Global Medical X-Ray Equipment and Imaging Software Industry Revenue Million Forecast, by Type 2020 & 2033
- Table 62: Global Medical X-Ray Equipment and Imaging Software Industry Volume K Unit Forecast, by Type 2020 & 2033
- Table 63: Global Medical X-Ray Equipment and Imaging Software Industry Revenue Million Forecast, by Technology 2020 & 2033
- Table 64: Global Medical X-Ray Equipment and Imaging Software Industry Volume K Unit Forecast, by Technology 2020 & 2033
- Table 65: Global Medical X-Ray Equipment and Imaging Software Industry Revenue Million Forecast, by Image Type 2020 & 2033
- Table 66: Global Medical X-Ray Equipment and Imaging Software Industry Volume K Unit Forecast, by Image Type 2020 & 2033
- Table 67: Global Medical X-Ray Equipment and Imaging Software Industry Revenue Million Forecast, by End-user 2020 & 2033
- Table 68: Global Medical X-Ray Equipment and Imaging Software Industry Volume K Unit Forecast, by End-user 2020 & 2033
- Table 69: Global Medical X-Ray Equipment and Imaging Software Industry Revenue Million Forecast, by Country 2020 & 2033
- Table 70: Global Medical X-Ray Equipment and Imaging Software Industry Volume K Unit Forecast, by Country 2020 & 2033
Frequently Asked Questions
1. What is the projected Compound Annual Growth Rate (CAGR) of the Medical X-Ray Equipment and Imaging Software Industry?
The projected CAGR is approximately 4.60%.
2. Which companies are prominent players in the Medical X-Ray Equipment and Imaging Software Industry?
Key companies in the market include Konica Minolta Inc, Siemens Healthcare GmbH, Canon Inc, IBM Corporation, Varex Imaging Corporation, Hitachi Ltd, Shimazdu Corporation, Hologic Inc , Koninklijke Philips NV, GE Healthcare Inc, Carestream Health Inc, Fujifilm Holdings Corporation.
3. What are the main segments of the Medical X-Ray Equipment and Imaging Software Industry?
The market segments include Type, Technology, Image Type, End-user.
4. Can you provide details about the market size?
The market size is estimated to be USD XX Million as of 2022.
5. What are some drivers contributing to market growth?
Increasing Incidences of Diseases and Growing Geriatric Population; Rising Investments in Healthcare Industry and Favorable Government Initiatives.
6. What are the notable trends driving market growth?
Diagnostic Centers Majorly Drive the Market Demand.
7. Are there any restraints impacting market growth?
Stringent Regulations and Validator Guidelines; Security Issues Associated with the Software.
8. Can you provide examples of recent developments in the market?
July 2023 - Shimadzu Corporation announced the release of a new mobile X-ray system known as MobileDaRt Evolution MX8 version k type, which is equipped with serial radiography functionality known as Dynamic Digital Radiography (DDR). It displays a series of static images captured at high speed as a moving image.
9. What pricing options are available for accessing the report?
Pricing options include single-user, multi-user, and enterprise licenses priced at USD 4750, USD 5250, and USD 8750 respectively.
10. Is the market size provided in terms of value or volume?
The market size is provided in terms of value, measured in Million and volume, measured in K Unit.
11. Are there any specific market keywords associated with the report?
Yes, the market keyword associated with the report is "Medical X-Ray Equipment and Imaging Software Industry," which aids in identifying and referencing the specific market segment covered.
12. How do I determine which pricing option suits my needs best?
The pricing options vary based on user requirements and access needs. Individual users may opt for single-user licenses, while businesses requiring broader access may choose multi-user or enterprise licenses for cost-effective access to the report.
13. Are there any additional resources or data provided in the Medical X-Ray Equipment and Imaging Software Industry report?
While the report offers comprehensive insights, it's advisable to review the specific contents or supplementary materials provided to ascertain if additional resources or data are available.
14. How can I stay updated on further developments or reports in the Medical X-Ray Equipment and Imaging Software Industry?
To stay informed about further developments, trends, and reports in the Medical X-Ray Equipment and Imaging Software Industry, consider subscribing to industry newsletters, following relevant companies and organizations, or regularly checking reputable industry news sources and publications.
Methodology
Step 1 - Identification of Relevant Samples Size from Population Database


Step 2 - Approaches for Defining Global Market Size (Value, Volume* & Price*)

Note*: In applicable scenarios
Step 3 - Data Sources
Primary Research
- Web Analytics
- Survey Reports
- Research Institute
- Latest Research Reports
- Opinion Leaders
Secondary Research
- Annual Reports
- White Paper
- Latest Press Release
- Industry Association
- Paid Database
- Investor Presentations

Step 4 - Data Triangulation
Involves using different sources of information in order to increase the validity of a study
These sources are likely to be stakeholders in a program - participants, other researchers, program staff, other community members, and so on.
Then we put all data in single framework & apply various statistical tools to find out the dynamic on the market.
During the analysis stage, feedback from the stakeholder groups would be compared to determine areas of agreement as well as areas of divergence