

Key Insights
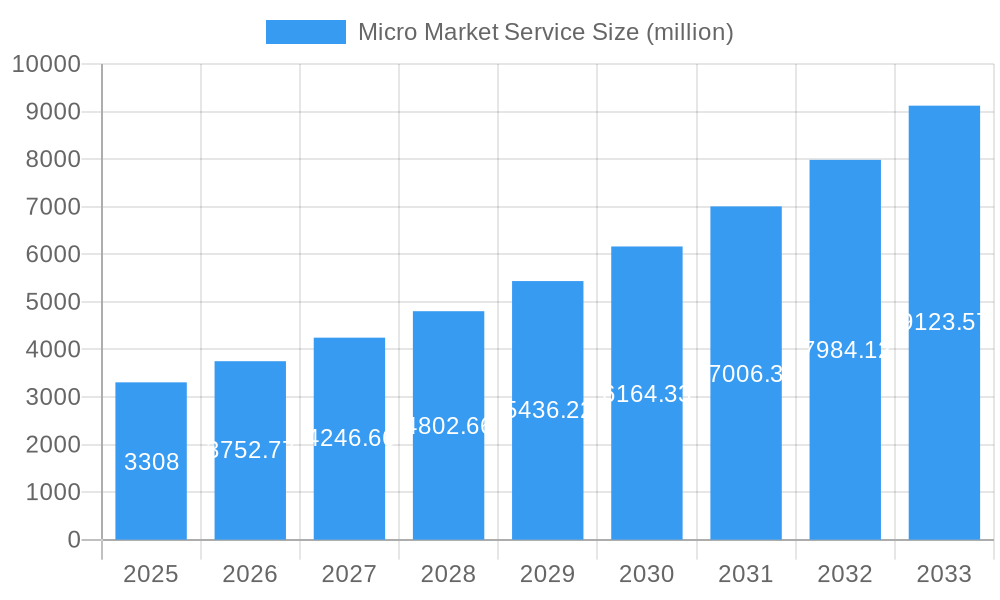
The micro market service industry is experiencing robust growth, projected to reach a market size of $3.308 billion in 2025, expanding at a compound annual growth rate (CAGR) of 13.6%. This expansion is fueled by several key drivers. Firstly, the increasing demand for convenient and healthy food options in workplaces is significantly boosting adoption. Employees are increasingly seeking alternatives to traditional vending machines, favoring the wider selection, fresher products, and often healthier choices offered by micro markets. Secondly, technological advancements, such as cashless payment systems and inventory management software, are streamlining operations and enhancing the customer experience. This technological integration also enables better data analysis, allowing operators to optimize product offerings and improve profitability. Furthermore, the rise of corporate wellness initiatives is driving demand, as companies recognize the positive impact of providing nutritious food options on employee productivity and morale. Competition among providers is driving innovation, leading to enhanced services such as personalized meal planning and integration with employee wellness programs. However, challenges such as managing food waste, maintaining hygiene standards, and adapting to fluctuating consumer preferences require ongoing attention.
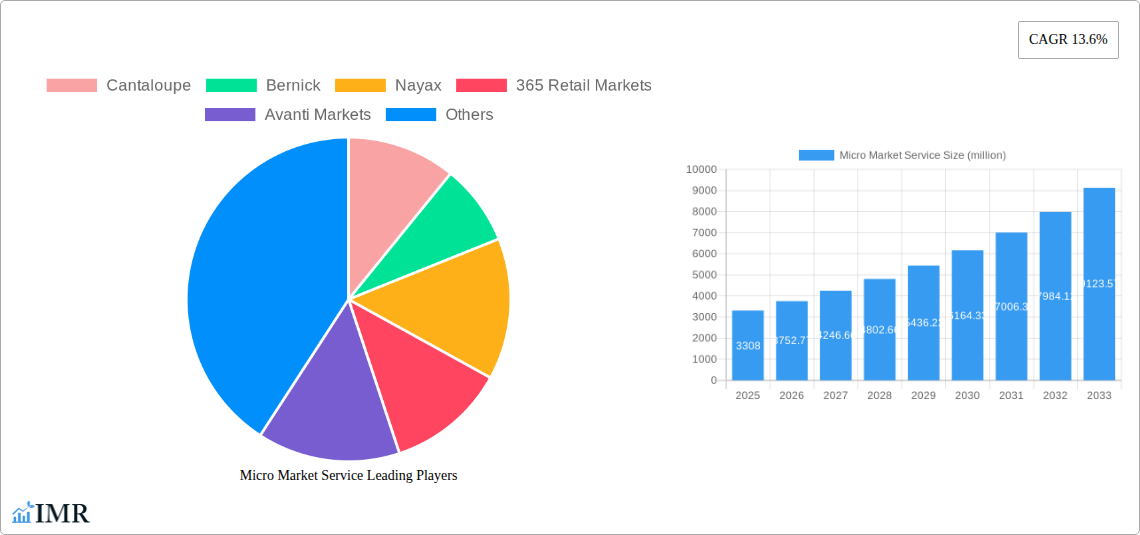
Micro Market Service Market Size (In Billion)
The competitive landscape is characterized by a mix of established players and emerging companies. Key players like Cantaloupe, Nayax, and 365 Retail Markets are leveraging their technological capabilities and established networks to maintain market share. Smaller, more agile companies are focusing on niche markets and innovative service offerings, contributing to the overall market dynamism. Geographical expansion, particularly into underserved regions, presents significant growth opportunities. As the trend towards flexible and hybrid work models continues, micro markets are well-positioned to benefit from the increased demand for convenient food solutions in various work settings, beyond traditional office environments. Future growth will likely hinge on further technological innovation, effective marketing to reach a wider target audience, and a focus on sustainable and environmentally conscious practices.
Micro Market Service Company Market Share
Micro Market Service Market Report: 2019-2033
This comprehensive report provides an in-depth analysis of the Micro Market Service market, encompassing market dynamics, growth trends, regional dominance, product landscape, key players, and future outlook. The study period covers 2019-2033, with 2025 as the base and estimated year. The forecast period spans 2025-2033, and the historical period is 2019-2024. This report is invaluable for industry professionals, investors, and strategic decision-makers seeking to understand and capitalize on opportunities within this rapidly evolving market. The parent market is the Food Service industry, and the child market is the automated vending and refreshment solutions segment.
Micro Market Service Market Dynamics & Structure
The Micro Market Service market is experiencing significant growth fueled by technological advancements and changing consumer preferences. Market concentration is moderate, with several key players holding substantial shares, but a fragmented landscape also exists, particularly amongst smaller regional operators. Technological innovation, primarily in areas like cashless payment systems, inventory management software, and smart refrigerators, is a major driver. Regulatory frameworks concerning food safety and hygiene significantly impact operations. Competitive substitutes include traditional vending machines and employee cafeterias, putting pressure on market share. End-user demographics show a strong preference for convenient, healthy, and customizable options. M&A activity is moderate, with larger players consolidating their market positions.
- Market Concentration: Moderately concentrated, with the top 5 players holding approximately xx% of the market share in 2025.
- Technological Innovation: Key drivers include cashless payment systems, smart refrigerators, and automated inventory management.
- Regulatory Framework: Food safety and hygiene regulations are major considerations.
- Competitive Substitutes: Traditional vending machines and employee cafeterias pose competition.
- End-User Demographics: Growing demand from businesses seeking to enhance employee satisfaction and improve workplace productivity.
- M&A Trends: Moderate M&A activity, with xx major deals observed during the historical period (2019-2024).
Micro Market Service Growth Trends & Insights
The Micro Market Service market exhibits robust growth, driven by a combination of factors including rising disposable incomes, increasing demand for convenient food options in the workplace, and the adoption of advanced technologies. The market size is expected to reach $xx billion in 2025 and is projected to reach $xx billion by 2033, exhibiting a CAGR of xx% during the forecast period. This growth reflects an increasing adoption rate across diverse industries and locations. Technological disruptions, such as the integration of AI and IoT, are enhancing efficiency and providing personalized experiences. Consumer behavior shifts indicate a growing preference for healthy and customizable food choices, influencing market offerings and driving innovation in product and service offerings.
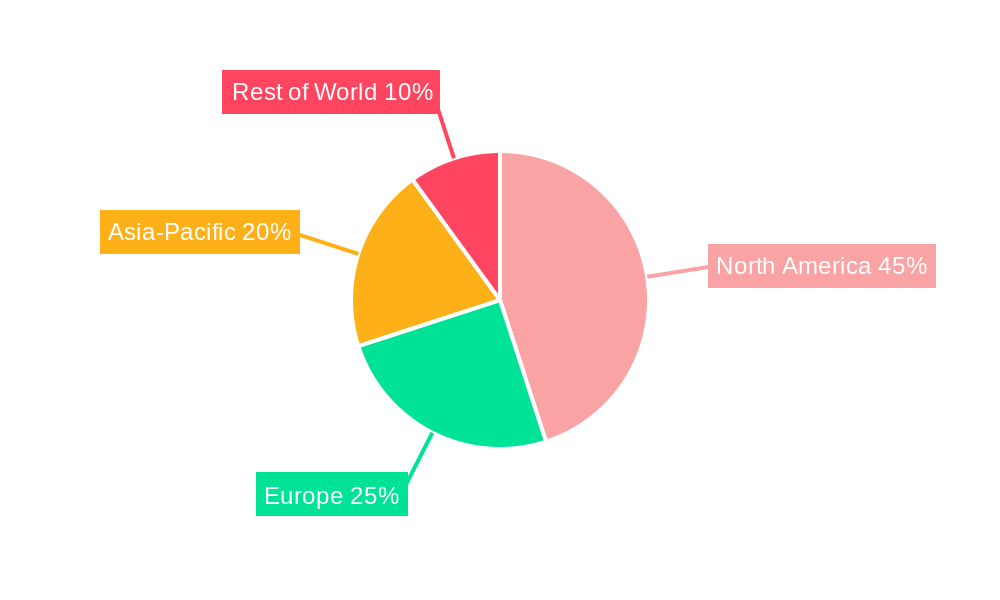
Dominant Regions, Countries, or Segments in Micro Market Service
North America currently holds the largest market share in the Micro Market Service industry, driven primarily by high consumer spending, strong infrastructure, and a robust business environment. Europe follows closely, with significant growth expected in emerging economies within the region. The key drivers in North America include a high concentration of businesses, favorable economic conditions, and the widespread adoption of advanced technologies.
- Key Drivers in North America:
- Strong economic growth and high disposable income.
- Established business infrastructure and supportive regulatory environment.
- High adoption rate of advanced technologies.
- Growth Potential in Europe: Expansion in emerging markets within the region and increasing adoption of healthy food choices.
- Asia-Pacific Region: Significant growth potential driven by economic expansion and increasing urbanization.
Micro Market Service Product Landscape
The product landscape is characterized by a wide variety of food and beverage offerings tailored to meet diverse consumer preferences. Innovations include customizable meal options, healthy and organic selections, and integration with mobile ordering apps. Performance metrics focus on improving efficiency, reducing waste, and enhancing consumer satisfaction through features such as real-time inventory management and advanced payment systems. The unique selling propositions of various providers often center on convenience, personalization, and a focus on fresh, high-quality products.
Key Drivers, Barriers & Challenges in Micro Market Service
Key Drivers: Increasing demand for convenient food options in the workplace, technological advancements leading to improved efficiency and cost reduction, and rising disposable incomes are driving market growth. Government initiatives promoting healthy eating habits further fuel market expansion.
Key Challenges: High initial investment costs for equipment and technology, competition from traditional food service providers, and supply chain disruptions due to unforeseen circumstances can hinder market expansion. Stringent food safety regulations and fluctuating food prices also present challenges.
Emerging Opportunities in Micro Market Service
Untapped markets in developing economies offer significant growth potential. Innovations like personalized meal planning based on dietary needs and preferences create new opportunities. Evolving consumer preferences towards sustainable and ethically sourced products are opening doors for new market entries emphasizing sustainability and social responsibility.
Growth Accelerators in the Micro Market Service Industry
Technological advancements such as AI-powered inventory management and predictive analytics are accelerating growth. Strategic partnerships between micro-market operators and food suppliers enhance efficiency and expand product offerings. Expansion into new geographical areas and diversification of product offerings to cater to a broader range of dietary needs and preferences contribute to accelerated growth.
Key Players Shaping the Micro Market Service Market
- Cantaloupe
- Bernick's
- Nayax
- 365 Retail Markets
- Avanti Markets
- NVCS
- Company Kitchen
- Aramark Corporation
- Breakroom Choices
- Vending Sense
- ECRS
- C&S Vending
- Five Star
- Prestige
- Canteen
- USConnect
- Florida Fresh Vending
- Eurest
- Culinary Ventures Vending
- FreshUp
- InReachers
- Market 24-7
Notable Milestones in Micro Market Service Sector
- 2020: Increased adoption of contactless payment systems due to the COVID-19 pandemic.
- 2021: Launch of several new micro-market platforms integrating advanced inventory management and analytics.
- 2022: Significant investment in AI and IoT technologies to improve operational efficiency.
- 2023: Several key acquisitions and mergers among major players.
In-Depth Micro Market Service Market Outlook
The future of the Micro Market Service market is bright, driven by continuous technological innovation and evolving consumer preferences. Strategic partnerships and expansion into new markets will play a key role in shaping future growth. Companies that effectively leverage technology and adapt to changing consumer demands will be best positioned to succeed in this dynamic and competitive landscape. The market is poised for sustained growth, with significant opportunities for both established players and new entrants.
Micro Market Service Segmentation
-
1. Application
- 1.1. Airport
- 1.2. Railway Station
- 1.3. School
- 1.4. Business Center
- 1.5. Others
-
2. Type
- 2.1. On-Site Micro Markets
- 2.2. Off-Site Micro Markets
Micro Market Service Segmentation By Geography
-
1. North America
- 1.1. United States
- 1.2. Canada
- 1.3. Mexico
-
2. South America
- 2.1. Brazil
- 2.2. Argentina
- 2.3. Rest of South America
-
3. Europe
- 3.1. United Kingdom
- 3.2. Germany
- 3.3. France
- 3.4. Italy
- 3.5. Spain
- 3.6. Russia
- 3.7. Benelux
- 3.8. Nordics
- 3.9. Rest of Europe
-
4. Middle East & Africa
- 4.1. Turkey
- 4.2. Israel
- 4.3. GCC
- 4.4. North Africa
- 4.5. South Africa
- 4.6. Rest of Middle East & Africa
-
5. Asia Pacific
- 5.1. China
- 5.2. India
- 5.3. Japan
- 5.4. South Korea
- 5.5. ASEAN
- 5.6. Oceania
- 5.7. Rest of Asia Pacific
Micro Market Service Regional Market Share
Geographic Coverage of Micro Market Service
Micro Market Service REPORT HIGHLIGHTS
| Aspects | Details |
|---|---|
| Study Period | 2020-2034 |
| Base Year | 2025 |
| Estimated Year | 2026 |
| Forecast Period | 2026-2034 |
| Historical Period | 2020-2025 |
| Growth Rate | CAGR of 13.6% from 2020-2034 |
| Segmentation |
|
Table of Contents
- 1. Introduction
- 1.1. Research Scope
- 1.2. Market Segmentation
- 1.3. Research Objective
- 1.4. Definitions and Assumptions
- 2. Executive Summary
- 2.1. Market Snapshot
- 3. Market Dynamics
- 3.1. Market Drivers
- 3.2. Market Restrains
- 3.3. Market Trends
- 3.4. Market Opportunities
- 4. Market Factor Analysis
- 4.1. Porters Five Forces
- 4.1.1. Bargaining Power of Suppliers
- 4.1.2. Bargaining Power of Buyers
- 4.1.3. Threat of New Entrants
- 4.1.4. Threat of Substitutes
- 4.1.5. Competitive Rivalry
- 4.2. PESTEL analysis
- 4.3. BCG Analysis
- 4.3.1. Stars (High Growth, High Market Share)
- 4.3.2. Cash Cows (Low Growth, High Market Share)
- 4.3.3. Question Mark (High Growth, Low Market Share)
- 4.3.4. Dogs (Low Growth, Low Market Share)
- 4.4. Ansoff Matrix Analysis
- 4.5. Supply Chain Analysis
- 4.6. Regulatory Landscape
- 4.7. Current Market Potential and Opportunity Assessment (TAM–SAM–SOM Framework)
- 4.8. IMR Analyst Note
- 4.1. Porters Five Forces
- 5. Market Analysis, Insights and Forecast 2021-2033
- 5.1. Market Analysis, Insights and Forecast - by Application
- 5.1.1. Airport
- 5.1.2. Railway Station
- 5.1.3. School
- 5.1.4. Business Center
- 5.1.5. Others
- 5.2. Market Analysis, Insights and Forecast - by Type
- 5.2.1. On-Site Micro Markets
- 5.2.2. Off-Site Micro Markets
- 5.3. Market Analysis, Insights and Forecast - by Region
- 5.3.1. North America
- 5.3.2. South America
- 5.3.3. Europe
- 5.3.4. Middle East & Africa
- 5.3.5. Asia Pacific
- 5.1. Market Analysis, Insights and Forecast - by Application
- 6. Global Micro Market Service Analysis, Insights and Forecast, 2021-2033
- 6.1. Market Analysis, Insights and Forecast - by Application
- 6.1.1. Airport
- 6.1.2. Railway Station
- 6.1.3. School
- 6.1.4. Business Center
- 6.1.5. Others
- 6.2. Market Analysis, Insights and Forecast - by Type
- 6.2.1. On-Site Micro Markets
- 6.2.2. Off-Site Micro Markets
- 6.1. Market Analysis, Insights and Forecast - by Application
- 7. North America Micro Market Service Analysis, Insights and Forecast, 2020-2032
- 7.1. Market Analysis, Insights and Forecast - by Application
- 7.1.1. Airport
- 7.1.2. Railway Station
- 7.1.3. School
- 7.1.4. Business Center
- 7.1.5. Others
- 7.2. Market Analysis, Insights and Forecast - by Type
- 7.2.1. On-Site Micro Markets
- 7.2.2. Off-Site Micro Markets
- 7.1. Market Analysis, Insights and Forecast - by Application
- 8. South America Micro Market Service Analysis, Insights and Forecast, 2020-2032
- 8.1. Market Analysis, Insights and Forecast - by Application
- 8.1.1. Airport
- 8.1.2. Railway Station
- 8.1.3. School
- 8.1.4. Business Center
- 8.1.5. Others
- 8.2. Market Analysis, Insights and Forecast - by Type
- 8.2.1. On-Site Micro Markets
- 8.2.2. Off-Site Micro Markets
- 8.1. Market Analysis, Insights and Forecast - by Application
- 9. Europe Micro Market Service Analysis, Insights and Forecast, 2020-2032
- 9.1. Market Analysis, Insights and Forecast - by Application
- 9.1.1. Airport
- 9.1.2. Railway Station
- 9.1.3. School
- 9.1.4. Business Center
- 9.1.5. Others
- 9.2. Market Analysis, Insights and Forecast - by Type
- 9.2.1. On-Site Micro Markets
- 9.2.2. Off-Site Micro Markets
- 9.1. Market Analysis, Insights and Forecast - by Application
- 10. Middle East & Africa Micro Market Service Analysis, Insights and Forecast, 2020-2032
- 10.1. Market Analysis, Insights and Forecast - by Application
- 10.1.1. Airport
- 10.1.2. Railway Station
- 10.1.3. School
- 10.1.4. Business Center
- 10.1.5. Others
- 10.2. Market Analysis, Insights and Forecast - by Type
- 10.2.1. On-Site Micro Markets
- 10.2.2. Off-Site Micro Markets
- 10.1. Market Analysis, Insights and Forecast - by Application
- 11. Asia Pacific Micro Market Service Analysis, Insights and Forecast, 2020-2032
- 11.1. Market Analysis, Insights and Forecast - by Application
- 11.1.1. Airport
- 11.1.2. Railway Station
- 11.1.3. School
- 11.1.4. Business Center
- 11.1.5. Others
- 11.2. Market Analysis, Insights and Forecast - by Type
- 11.2.1. On-Site Micro Markets
- 11.2.2. Off-Site Micro Markets
- 11.1. Market Analysis, Insights and Forecast - by Application
- 12. Competitive Analysis
- 12.1. Company Profiles
- 12.1.1 Cantaloupe
- 12.1.1.1. Company Overview
- 12.1.1.2. Products
- 12.1.1.3. Company Financials
- 12.1.1.4. SWOT Analysis
- 12.1.2 Bernick
- 12.1.2.1. Company Overview
- 12.1.2.2. Products
- 12.1.2.3. Company Financials
- 12.1.2.4. SWOT Analysis
- 12.1.3 Nayax
- 12.1.3.1. Company Overview
- 12.1.3.2. Products
- 12.1.3.3. Company Financials
- 12.1.3.4. SWOT Analysis
- 12.1.4 365 Retail Markets
- 12.1.4.1. Company Overview
- 12.1.4.2. Products
- 12.1.4.3. Company Financials
- 12.1.4.4. SWOT Analysis
- 12.1.5 Avanti Markets
- 12.1.5.1. Company Overview
- 12.1.5.2. Products
- 12.1.5.3. Company Financials
- 12.1.5.4. SWOT Analysis
- 12.1.6 NVCS
- 12.1.6.1. Company Overview
- 12.1.6.2. Products
- 12.1.6.3. Company Financials
- 12.1.6.4. SWOT Analysis
- 12.1.7 Company Kitchen
- 12.1.7.1. Company Overview
- 12.1.7.2. Products
- 12.1.7.3. Company Financials
- 12.1.7.4. SWOT Analysis
- 12.1.8 Aramark Corporation
- 12.1.8.1. Company Overview
- 12.1.8.2. Products
- 12.1.8.3. Company Financials
- 12.1.8.4. SWOT Analysis
- 12.1.9 Breakroom Choices
- 12.1.9.1. Company Overview
- 12.1.9.2. Products
- 12.1.9.3. Company Financials
- 12.1.9.4. SWOT Analysis
- 12.1.10 Vending Sense
- 12.1.10.1. Company Overview
- 12.1.10.2. Products
- 12.1.10.3. Company Financials
- 12.1.10.4. SWOT Analysis
- 12.1.11 ECRS
- 12.1.11.1. Company Overview
- 12.1.11.2. Products
- 12.1.11.3. Company Financials
- 12.1.11.4. SWOT Analysis
- 12.1.12 C&S Vending
- 12.1.12.1. Company Overview
- 12.1.12.2. Products
- 12.1.12.3. Company Financials
- 12.1.12.4. SWOT Analysis
- 12.1.13 Five Star
- 12.1.13.1. Company Overview
- 12.1.13.2. Products
- 12.1.13.3. Company Financials
- 12.1.13.4. SWOT Analysis
- 12.1.14 Prestige
- 12.1.14.1. Company Overview
- 12.1.14.2. Products
- 12.1.14.3. Company Financials
- 12.1.14.4. SWOT Analysis
- 12.1.15 Canteen
- 12.1.15.1. Company Overview
- 12.1.15.2. Products
- 12.1.15.3. Company Financials
- 12.1.15.4. SWOT Analysis
- 12.1.16 USConnect
- 12.1.16.1. Company Overview
- 12.1.16.2. Products
- 12.1.16.3. Company Financials
- 12.1.16.4. SWOT Analysis
- 12.1.17 Florida Fresh Vending
- 12.1.17.1. Company Overview
- 12.1.17.2. Products
- 12.1.17.3. Company Financials
- 12.1.17.4. SWOT Analysis
- 12.1.18 Eurest
- 12.1.18.1. Company Overview
- 12.1.18.2. Products
- 12.1.18.3. Company Financials
- 12.1.18.4. SWOT Analysis
- 12.1.19 Culinary Ventures Vending
- 12.1.19.1. Company Overview
- 12.1.19.2. Products
- 12.1.19.3. Company Financials
- 12.1.19.4. SWOT Analysis
- 12.1.20 FreshUp
- 12.1.20.1. Company Overview
- 12.1.20.2. Products
- 12.1.20.3. Company Financials
- 12.1.20.4. SWOT Analysis
- 12.1.21 InReachers
- 12.1.21.1. Company Overview
- 12.1.21.2. Products
- 12.1.21.3. Company Financials
- 12.1.21.4. SWOT Analysis
- 12.1.22 Market 24-7
- 12.1.22.1. Company Overview
- 12.1.22.2. Products
- 12.1.22.3. Company Financials
- 12.1.22.4. SWOT Analysis
- 12.1.1 Cantaloupe
- 12.2. Market Entropy
- 12.2.1 Company's Key Areas Served
- 12.2.2 Recent Developments
- 12.3. Company Market Share Analysis 2025
- 12.3.1 Top 5 Companies Market Share Analysis
- 12.3.2 Top 3 Companies Market Share Analysis
- 12.4. List of Potential Customers
- 13. Research Methodology
List of Figures
- Figure 1: Global Micro Market Service Revenue Breakdown (million, %) by Region 2025 & 2033
- Figure 2: North America Micro Market Service Revenue (million), by Application 2025 & 2033
- Figure 3: North America Micro Market Service Revenue Share (%), by Application 2025 & 2033
- Figure 4: North America Micro Market Service Revenue (million), by Type 2025 & 2033
- Figure 5: North America Micro Market Service Revenue Share (%), by Type 2025 & 2033
- Figure 6: North America Micro Market Service Revenue (million), by Country 2025 & 2033
- Figure 7: North America Micro Market Service Revenue Share (%), by Country 2025 & 2033
- Figure 8: South America Micro Market Service Revenue (million), by Application 2025 & 2033
- Figure 9: South America Micro Market Service Revenue Share (%), by Application 2025 & 2033
- Figure 10: South America Micro Market Service Revenue (million), by Type 2025 & 2033
- Figure 11: South America Micro Market Service Revenue Share (%), by Type 2025 & 2033
- Figure 12: South America Micro Market Service Revenue (million), by Country 2025 & 2033
- Figure 13: South America Micro Market Service Revenue Share (%), by Country 2025 & 2033
- Figure 14: Europe Micro Market Service Revenue (million), by Application 2025 & 2033
- Figure 15: Europe Micro Market Service Revenue Share (%), by Application 2025 & 2033
- Figure 16: Europe Micro Market Service Revenue (million), by Type 2025 & 2033
- Figure 17: Europe Micro Market Service Revenue Share (%), by Type 2025 & 2033
- Figure 18: Europe Micro Market Service Revenue (million), by Country 2025 & 2033
- Figure 19: Europe Micro Market Service Revenue Share (%), by Country 2025 & 2033
- Figure 20: Middle East & Africa Micro Market Service Revenue (million), by Application 2025 & 2033
- Figure 21: Middle East & Africa Micro Market Service Revenue Share (%), by Application 2025 & 2033
- Figure 22: Middle East & Africa Micro Market Service Revenue (million), by Type 2025 & 2033
- Figure 23: Middle East & Africa Micro Market Service Revenue Share (%), by Type 2025 & 2033
- Figure 24: Middle East & Africa Micro Market Service Revenue (million), by Country 2025 & 2033
- Figure 25: Middle East & Africa Micro Market Service Revenue Share (%), by Country 2025 & 2033
- Figure 26: Asia Pacific Micro Market Service Revenue (million), by Application 2025 & 2033
- Figure 27: Asia Pacific Micro Market Service Revenue Share (%), by Application 2025 & 2033
- Figure 28: Asia Pacific Micro Market Service Revenue (million), by Type 2025 & 2033
- Figure 29: Asia Pacific Micro Market Service Revenue Share (%), by Type 2025 & 2033
- Figure 30: Asia Pacific Micro Market Service Revenue (million), by Country 2025 & 2033
- Figure 31: Asia Pacific Micro Market Service Revenue Share (%), by Country 2025 & 2033
List of Tables
- Table 1: Global Micro Market Service Revenue million Forecast, by Application 2020 & 2033
- Table 2: Global Micro Market Service Revenue million Forecast, by Type 2020 & 2033
- Table 3: Global Micro Market Service Revenue million Forecast, by Region 2020 & 2033
- Table 4: Global Micro Market Service Revenue million Forecast, by Application 2020 & 2033
- Table 5: Global Micro Market Service Revenue million Forecast, by Type 2020 & 2033
- Table 6: Global Micro Market Service Revenue million Forecast, by Country 2020 & 2033
- Table 7: United States Micro Market Service Revenue (million) Forecast, by Application 2020 & 2033
- Table 8: Canada Micro Market Service Revenue (million) Forecast, by Application 2020 & 2033
- Table 9: Mexico Micro Market Service Revenue (million) Forecast, by Application 2020 & 2033
- Table 10: Global Micro Market Service Revenue million Forecast, by Application 2020 & 2033
- Table 11: Global Micro Market Service Revenue million Forecast, by Type 2020 & 2033
- Table 12: Global Micro Market Service Revenue million Forecast, by Country 2020 & 2033
- Table 13: Brazil Micro Market Service Revenue (million) Forecast, by Application 2020 & 2033
- Table 14: Argentina Micro Market Service Revenue (million) Forecast, by Application 2020 & 2033
- Table 15: Rest of South America Micro Market Service Revenue (million) Forecast, by Application 2020 & 2033
- Table 16: Global Micro Market Service Revenue million Forecast, by Application 2020 & 2033
- Table 17: Global Micro Market Service Revenue million Forecast, by Type 2020 & 2033
- Table 18: Global Micro Market Service Revenue million Forecast, by Country 2020 & 2033
- Table 19: United Kingdom Micro Market Service Revenue (million) Forecast, by Application 2020 & 2033
- Table 20: Germany Micro Market Service Revenue (million) Forecast, by Application 2020 & 2033
- Table 21: France Micro Market Service Revenue (million) Forecast, by Application 2020 & 2033
- Table 22: Italy Micro Market Service Revenue (million) Forecast, by Application 2020 & 2033
- Table 23: Spain Micro Market Service Revenue (million) Forecast, by Application 2020 & 2033
- Table 24: Russia Micro Market Service Revenue (million) Forecast, by Application 2020 & 2033
- Table 25: Benelux Micro Market Service Revenue (million) Forecast, by Application 2020 & 2033
- Table 26: Nordics Micro Market Service Revenue (million) Forecast, by Application 2020 & 2033
- Table 27: Rest of Europe Micro Market Service Revenue (million) Forecast, by Application 2020 & 2033
- Table 28: Global Micro Market Service Revenue million Forecast, by Application 2020 & 2033
- Table 29: Global Micro Market Service Revenue million Forecast, by Type 2020 & 2033
- Table 30: Global Micro Market Service Revenue million Forecast, by Country 2020 & 2033
- Table 31: Turkey Micro Market Service Revenue (million) Forecast, by Application 2020 & 2033
- Table 32: Israel Micro Market Service Revenue (million) Forecast, by Application 2020 & 2033
- Table 33: GCC Micro Market Service Revenue (million) Forecast, by Application 2020 & 2033
- Table 34: North Africa Micro Market Service Revenue (million) Forecast, by Application 2020 & 2033
- Table 35: South Africa Micro Market Service Revenue (million) Forecast, by Application 2020 & 2033
- Table 36: Rest of Middle East & Africa Micro Market Service Revenue (million) Forecast, by Application 2020 & 2033
- Table 37: Global Micro Market Service Revenue million Forecast, by Application 2020 & 2033
- Table 38: Global Micro Market Service Revenue million Forecast, by Type 2020 & 2033
- Table 39: Global Micro Market Service Revenue million Forecast, by Country 2020 & 2033
- Table 40: China Micro Market Service Revenue (million) Forecast, by Application 2020 & 2033
- Table 41: India Micro Market Service Revenue (million) Forecast, by Application 2020 & 2033
- Table 42: Japan Micro Market Service Revenue (million) Forecast, by Application 2020 & 2033
- Table 43: South Korea Micro Market Service Revenue (million) Forecast, by Application 2020 & 2033
- Table 44: ASEAN Micro Market Service Revenue (million) Forecast, by Application 2020 & 2033
- Table 45: Oceania Micro Market Service Revenue (million) Forecast, by Application 2020 & 2033
- Table 46: Rest of Asia Pacific Micro Market Service Revenue (million) Forecast, by Application 2020 & 2033
Frequently Asked Questions
1. What is the projected Compound Annual Growth Rate (CAGR) of the Micro Market Service?
The projected CAGR is approximately 13.6%.
2. Which companies are prominent players in the Micro Market Service?
Key companies in the market include Cantaloupe, Bernick, Nayax, 365 Retail Markets, Avanti Markets, NVCS, Company Kitchen, Aramark Corporation, Breakroom Choices, Vending Sense, ECRS, C&S Vending, Five Star, Prestige, Canteen, USConnect, Florida Fresh Vending, Eurest, Culinary Ventures Vending, FreshUp, InReachers, Market 24-7.
3. What are the main segments of the Micro Market Service?
The market segments include Application, Type.
4. Can you provide details about the market size?
The market size is estimated to be USD 3308 million as of 2022.
5. What are some drivers contributing to market growth?
N/A
6. What are the notable trends driving market growth?
N/A
7. Are there any restraints impacting market growth?
N/A
8. Can you provide examples of recent developments in the market?
N/A
9. What pricing options are available for accessing the report?
Pricing options include single-user, multi-user, and enterprise licenses priced at USD 2900.00, USD 4350.00, and USD 5800.00 respectively.
10. Is the market size provided in terms of value or volume?
The market size is provided in terms of value, measured in million.
11. Are there any specific market keywords associated with the report?
Yes, the market keyword associated with the report is "Micro Market Service," which aids in identifying and referencing the specific market segment covered.
12. How do I determine which pricing option suits my needs best?
The pricing options vary based on user requirements and access needs. Individual users may opt for single-user licenses, while businesses requiring broader access may choose multi-user or enterprise licenses for cost-effective access to the report.
13. Are there any additional resources or data provided in the Micro Market Service report?
While the report offers comprehensive insights, it's advisable to review the specific contents or supplementary materials provided to ascertain if additional resources or data are available.
14. How can I stay updated on further developments or reports in the Micro Market Service?
To stay informed about further developments, trends, and reports in the Micro Market Service, consider subscribing to industry newsletters, following relevant companies and organizations, or regularly checking reputable industry news sources and publications.
Methodology
Step 1 - Identification of Relevant Samples Size from Population Database


Step 2 - Approaches for Defining Global Market Size (Value, Volume* & Price*)

Note*: In applicable scenarios
Step 3 - Data Sources
Primary Research
- Web Analytics
- Survey Reports
- Research Institute
- Latest Research Reports
- Opinion Leaders
Secondary Research
- Annual Reports
- White Paper
- Latest Press Release
- Industry Association
- Paid Database
- Investor Presentations

Step 4 - Data Triangulation
Involves using different sources of information in order to increase the validity of a study
These sources are likely to be stakeholders in a program - participants, other researchers, program staff, other community members, and so on.
Then we put all data in single framework & apply various statistical tools to find out the dynamic on the market.
During the analysis stage, feedback from the stakeholder groups would be compared to determine areas of agreement as well as areas of divergence