

Key Insights
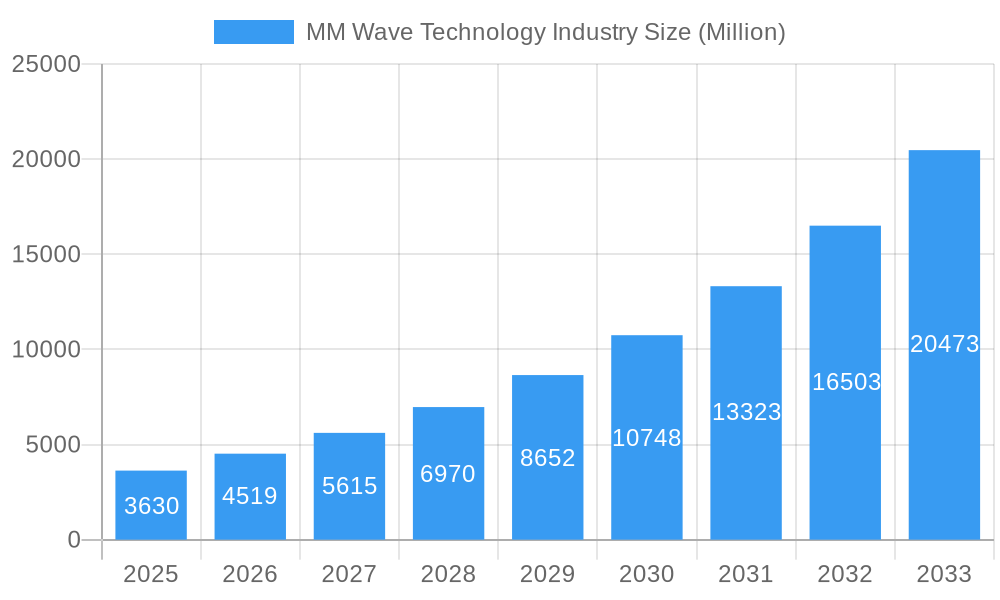
The millimeter-wave (mmWave) technology market is experiencing robust growth, driven by the increasing demand for high-bandwidth applications in 5G networks, automotive radar systems, and advanced imaging technologies. The market, valued at $3.63 billion in 2025, is projected to exhibit a Compound Annual Growth Rate (CAGR) of 24.60% from 2025 to 2033. This significant expansion is fueled by several key factors. Firstly, the proliferation of 5G infrastructure globally is a major catalyst, requiring high-frequency components capable of handling massive data transfer rates. Secondly, the automotive sector's increasing reliance on advanced driver-assistance systems (ADAS) and autonomous driving technologies necessitates the deployment of high-precision mmWave radar sensors. Thirdly, advancements in imaging technologies, particularly in medical and industrial sectors, are driving demand for mmWave components with improved resolution and accuracy. The market is segmented by component type (antennas, transceivers, communication/networking, interface, frequency-related, imaging, and others) and licensing model (fully/partly licensed and unlicensed). The fully/partly licensed segment is currently dominant due to its higher reliability and security, but the unlicensed segment is expected to witness significant growth driven by cost-effectiveness and ease of deployment. Competition is intense, with key players including L3Harris Technologies, E-band Communications, Millimeter Wave Products, NEC Corporation, and Siklu Communication actively developing and deploying advanced mmWave solutions.
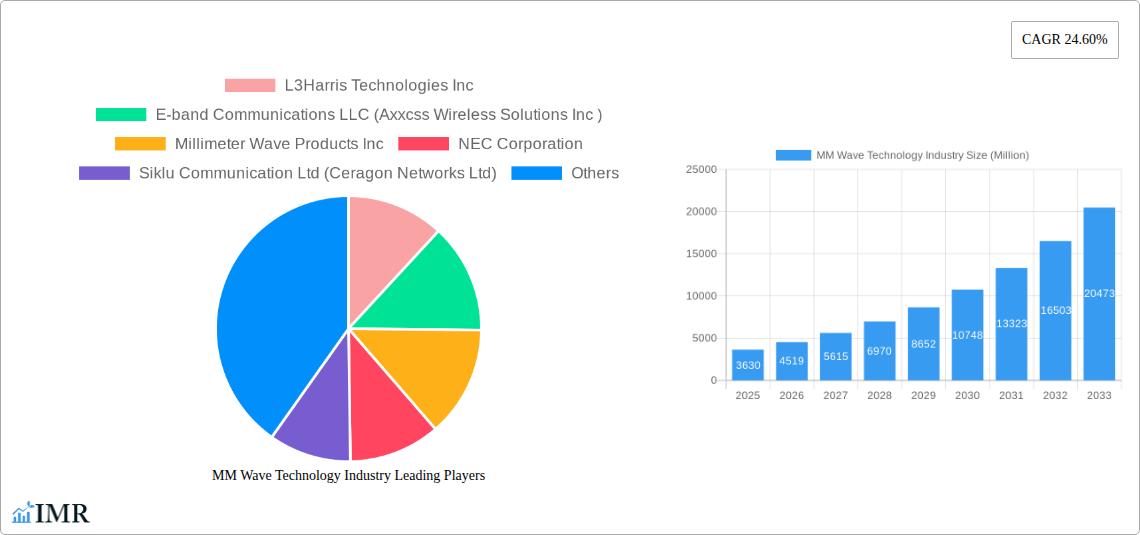
MM Wave Technology Industry Market Size (In Billion)
Geographical distribution reveals a strong presence in North America and Europe, driven by early adoption of 5G and advanced automotive technologies. However, the Asia-Pacific region, particularly China and India, is anticipated to exhibit substantial growth in the coming years, propelled by rapid technological advancements and expanding infrastructure development. The market faces certain challenges, including high component costs, signal attenuation, and regulatory hurdles related to frequency allocation. Nevertheless, ongoing technological innovations focusing on improved antenna designs, signal processing techniques, and cost-effective manufacturing are expected to mitigate these challenges and sustain the market's impressive growth trajectory. The forecast period of 2025-2033 promises substantial opportunities for market participants, particularly those focusing on innovation, strategic partnerships, and expansion into emerging markets.
MM Wave Technology Industry Company Market Share
MM Wave Technology Industry Market Report: 2019-2033
This comprehensive report provides an in-depth analysis of the MM Wave Technology industry, encompassing market dynamics, growth trends, regional segmentation, product landscape, key players, and future outlook. The study period covers 2019-2033, with 2025 as the base and estimated year. This report is crucial for industry professionals, investors, and strategists seeking to understand and capitalize on the opportunities within this rapidly evolving sector. The parent market is the wireless communication technology market, while the child market focuses specifically on millimeter-wave applications.
MM Wave Technology Industry Market Dynamics & Structure
The MM Wave technology market is characterized by moderate concentration, with several key players holding significant market share, but also room for new entrants. Technological innovation, driven by the demand for higher bandwidth and faster data speeds, is a primary growth driver. Regulatory frameworks governing spectrum allocation and deployment significantly influence market expansion. Competitive substitutes, such as traditional microwave technologies, pose a challenge, although the advantages of MM Wave in terms of capacity and speed are increasingly recognized. The end-user demographics span various sectors, including telecommunications, defense, and automotive, with M&A activity expected to remain steady at xx deals per year.
- Market Concentration: Moderately concentrated, with top 5 players holding approximately xx% of the market share in 2025.
- Technological Innovation: Key drivers include advancements in antenna design, chip technology, and signal processing.
- Regulatory Frameworks: Spectrum allocation policies and licensing regulations significantly impact deployment and market growth.
- Competitive Substitutes: Traditional microwave technologies and other wireless technologies present competitive pressure.
- End-User Demographics: Telecommunications, defense, automotive, and healthcare are key end-user segments.
- M&A Trends: A moderate level of M&A activity is anticipated throughout the forecast period, driven by consolidation and expansion efforts.
MM Wave Technology Industry Growth Trends & Insights
The MM Wave technology market is experiencing robust growth, driven by the increasing demand for high-bandwidth applications such as 5G networks, high-speed data transfer, and advanced imaging systems. The market size, valued at xx million units in 2025, is projected to reach xx million units by 2033, exhibiting a CAGR of xx%. This growth is fueled by rising adoption rates across various sectors and significant technological advancements. Market penetration is currently at xx% and is expected to increase steadily to xx% by 2033. Consumer behavior shifts towards greater demand for high-speed internet access and seamless connectivity are bolstering the adoption of MM Wave technologies. Disruptive technologies like advanced materials and AI-powered signal processing are further accelerating market expansion.
Dominant Regions, Countries, or Segments in MM Wave Technology Industry
North America currently dominates the MM Wave technology market, driven by strong infrastructure investments and early adoption of 5G technologies. However, Asia-Pacific is projected to witness significant growth during the forecast period, fueled by rapid urbanization, rising smartphone penetration, and government initiatives to promote 5G infrastructure. Within the component segments, Antennas and Transceivers hold the largest market share, followed by Communications and Networking. The Fully/Partly Licensed segment dominates the Licensing Model category.
- Key Drivers in North America: Strong 5G infrastructure development, supportive regulatory environment, high technological expertise.
- Key Drivers in Asia-Pacific: Rapid urbanization, rising smartphone penetration, government support for 5G infrastructure.
- Dominant Component Segment: Antennas and Transceivers (market share: xx% in 2025).
- Dominant Licensing Model: Fully/Partly Licensed (market share: xx% in 2025).
MM Wave Technology Industry Product Landscape
The MM Wave technology product landscape is characterized by a wide range of components, including antennas, transceivers, and integrated circuits, each offering distinct performance metrics and unique selling propositions. Key advancements involve improved beamforming capabilities, enhanced power efficiency, and miniaturization of components. New product innovations are continuously introduced, focusing on higher frequency bands and improved signal processing for better performance and broader applications.
Key Drivers, Barriers & Challenges in MM Wave Technology Industry
Key Drivers:
- Increased demand for high-bandwidth applications.
- Growing adoption of 5G and beyond 5G technologies.
- Technological advancements in chipsets, antenna design, and signal processing.
- Government support and funding for infrastructure development.
Key Challenges:
- High deployment costs and limited spectrum availability.
- Signal attenuation and atmospheric interference.
- Complex regulatory frameworks and licensing processes.
- Supply chain disruptions (impact: xx% reduction in production capacity in 2024).
Emerging Opportunities in MM Wave Technology Industry
- Expansion into untapped markets, particularly in developing economies.
- Innovative applications in automotive radar, high-resolution imaging, and industrial IoT.
- Development of low-cost and energy-efficient MM Wave components.
- Enhanced security features to address potential vulnerabilities in MM Wave networks.
Growth Accelerators in the MM Wave Technology Industry
Technological breakthroughs in integrated circuits and antenna technologies are significant growth accelerators. Strategic partnerships between telecom operators, equipment manufacturers, and technology providers will drive market expansion. Increased investments in research and development, coupled with governmental support for 5G deployments, will further propel market growth.
Key Players Shaping the MM Wave Technology Market
- L3Harris Technologies Inc
- E-band Communications LLC (Axxcss Wireless Solutions Inc)
- Millimeter Wave Products Inc
- NEC Corporation
- Siklu Communication Ltd (Ceragon Networks Ltd)
- Bridgewave Communications Inc (REMEC Broadband Wireless Networks LLC)
- Keysight Technologies Inc
- Smiths Interconnect Group Limited
- Ducommun Incorporated
- Farran Technology Ltd
- Eravant (SAGE Millimeter Inc)
Notable Milestones in MM Wave Technology Industry Sector
- November 2023: EUR 36 million (USD 38.95 million) allocated to establish ten 5G Innovation Regions (5GIRs) across the UK, boosting advanced wireless technology adoption.
- August 2023: Fujitsu unveils a new millimeter-wave chip for 5G with multibeam multiplexing capabilities, enhancing 5G base station performance.
In-Depth MM Wave Technology Industry Market Outlook
The MM Wave technology market is poised for continued strong growth, driven by the increasing demand for high-speed wireless connectivity and the expansion of 5G networks globally. Strategic partnerships, technological breakthroughs, and ongoing investments in infrastructure development will unlock significant opportunities for market players. The future of the MM Wave industry looks bright with a high potential for market expansion and technological advancements.
MM Wave Technology Industry Segmentation
-
1. Type of Component
- 1.1. Antennas and Transceiver
- 1.2. Communications and Networking
- 1.3. Interface
- 1.4. Frequency and Related Components
- 1.5. Imaging
- 1.6. Other Components
-
2. Licensing Model
- 2.1. Fully/Partly Licensed
- 2.2. Unlicensed
MM Wave Technology Industry Segmentation By Geography
-
1. North America
- 1.1. United States
- 1.2. Canada
-
2. Europe
- 2.1. United Kingdom
- 2.2. Germany
- 2.3. France
-
3. Asia
- 3.1. China
- 3.2. Japan
- 3.3. India
- 3.4. South Korea
- 4. Middle East and Africa
- 5. Latin America
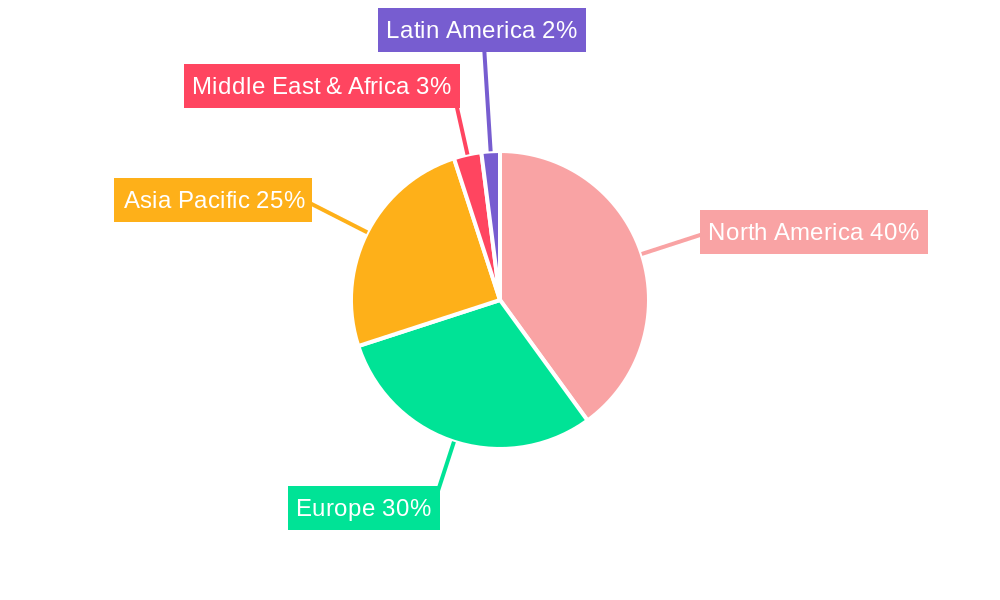
MM Wave Technology Industry Regional Market Share
Geographic Coverage of MM Wave Technology Industry
MM Wave Technology Industry REPORT HIGHLIGHTS
| Aspects | Details |
|---|---|
| Study Period | 2020-2034 |
| Base Year | 2025 |
| Estimated Year | 2026 |
| Forecast Period | 2026-2034 |
| Historical Period | 2020-2025 |
| Growth Rate | CAGR of 24.60% from 2020-2034 |
| Segmentation |
|
Table of Contents
- 1. Introduction
- 1.1. Research Scope
- 1.2. Market Segmentation
- 1.3. Research Objective
- 1.4. Definitions and Assumptions
- 2. Executive Summary
- 2.1. Market Snapshot
- 3. Market Dynamics
- 3.1. Market Drivers
- 3.2. Market Restrains
- 3.3. Market Trends
- 3.4. Market Opportunities
- 4. Market Factor Analysis
- 4.1. Porters Five Forces
- 4.1.1. Bargaining Power of Suppliers
- 4.1.2. Bargaining Power of Buyers
- 4.1.3. Threat of New Entrants
- 4.1.4. Threat of Substitutes
- 4.1.5. Competitive Rivalry
- 4.2. PESTEL analysis
- 4.3. BCG Analysis
- 4.3.1. Stars (High Growth, High Market Share)
- 4.3.2. Cash Cows (Low Growth, High Market Share)
- 4.3.3. Question Mark (High Growth, Low Market Share)
- 4.3.4. Dogs (Low Growth, Low Market Share)
- 4.4. Ansoff Matrix Analysis
- 4.5. Supply Chain Analysis
- 4.6. Regulatory Landscape
- 4.7. Current Market Potential and Opportunity Assessment (TAM–SAM–SOM Framework)
- 4.8. IMR Analyst Note
- 4.1. Porters Five Forces
- 5. Market Analysis, Insights and Forecast 2021-2033
- 5.1. Market Analysis, Insights and Forecast - by Type of Component
- 5.1.1. Antennas and Transceiver
- 5.1.2. Communications and Networking
- 5.1.3. Interface
- 5.1.4. Frequency and Related Components
- 5.1.5. Imaging
- 5.1.6. Other Components
- 5.2. Market Analysis, Insights and Forecast - by Licensing Model
- 5.2.1. Fully/Partly Licensed
- 5.2.2. Unlicensed
- 5.3. Market Analysis, Insights and Forecast - by Region
- 5.3.1. North America
- 5.3.2. Europe
- 5.3.3. Asia
- 5.3.4. Middle East and Africa
- 5.3.5. Latin America
- 5.1. Market Analysis, Insights and Forecast - by Type of Component
- 6. Global MM Wave Technology Industry Analysis, Insights and Forecast, 2021-2033
- 6.1. Market Analysis, Insights and Forecast - by Type of Component
- 6.1.1. Antennas and Transceiver
- 6.1.2. Communications and Networking
- 6.1.3. Interface
- 6.1.4. Frequency and Related Components
- 6.1.5. Imaging
- 6.1.6. Other Components
- 6.2. Market Analysis, Insights and Forecast - by Licensing Model
- 6.2.1. Fully/Partly Licensed
- 6.2.2. Unlicensed
- 6.1. Market Analysis, Insights and Forecast - by Type of Component
- 7. North America MM Wave Technology Industry Analysis, Insights and Forecast, 2020-2032
- 7.1. Market Analysis, Insights and Forecast - by Type of Component
- 7.1.1. Antennas and Transceiver
- 7.1.2. Communications and Networking
- 7.1.3. Interface
- 7.1.4. Frequency and Related Components
- 7.1.5. Imaging
- 7.1.6. Other Components
- 7.2. Market Analysis, Insights and Forecast - by Licensing Model
- 7.2.1. Fully/Partly Licensed
- 7.2.2. Unlicensed
- 7.1. Market Analysis, Insights and Forecast - by Type of Component
- 8. Europe MM Wave Technology Industry Analysis, Insights and Forecast, 2020-2032
- 8.1. Market Analysis, Insights and Forecast - by Type of Component
- 8.1.1. Antennas and Transceiver
- 8.1.2. Communications and Networking
- 8.1.3. Interface
- 8.1.4. Frequency and Related Components
- 8.1.5. Imaging
- 8.1.6. Other Components
- 8.2. Market Analysis, Insights and Forecast - by Licensing Model
- 8.2.1. Fully/Partly Licensed
- 8.2.2. Unlicensed
- 8.1. Market Analysis, Insights and Forecast - by Type of Component
- 9. Asia MM Wave Technology Industry Analysis, Insights and Forecast, 2020-2032
- 9.1. Market Analysis, Insights and Forecast - by Type of Component
- 9.1.1. Antennas and Transceiver
- 9.1.2. Communications and Networking
- 9.1.3. Interface
- 9.1.4. Frequency and Related Components
- 9.1.5. Imaging
- 9.1.6. Other Components
- 9.2. Market Analysis, Insights and Forecast - by Licensing Model
- 9.2.1. Fully/Partly Licensed
- 9.2.2. Unlicensed
- 9.1. Market Analysis, Insights and Forecast - by Type of Component
- 10. Middle East and Africa MM Wave Technology Industry Analysis, Insights and Forecast, 2020-2032
- 10.1. Market Analysis, Insights and Forecast - by Type of Component
- 10.1.1. Antennas and Transceiver
- 10.1.2. Communications and Networking
- 10.1.3. Interface
- 10.1.4. Frequency and Related Components
- 10.1.5. Imaging
- 10.1.6. Other Components
- 10.2. Market Analysis, Insights and Forecast - by Licensing Model
- 10.2.1. Fully/Partly Licensed
- 10.2.2. Unlicensed
- 10.1. Market Analysis, Insights and Forecast - by Type of Component
- 11. Latin America MM Wave Technology Industry Analysis, Insights and Forecast, 2020-2032
- 11.1. Market Analysis, Insights and Forecast - by Type of Component
- 11.1.1. Antennas and Transceiver
- 11.1.2. Communications and Networking
- 11.1.3. Interface
- 11.1.4. Frequency and Related Components
- 11.1.5. Imaging
- 11.1.6. Other Components
- 11.2. Market Analysis, Insights and Forecast - by Licensing Model
- 11.2.1. Fully/Partly Licensed
- 11.2.2. Unlicensed
- 11.1. Market Analysis, Insights and Forecast - by Type of Component
- 12. Competitive Analysis
- 12.1. Company Profiles
- 12.1.1 L3Harris Technologies Inc
- 12.1.1.1. Company Overview
- 12.1.1.2. Products
- 12.1.1.3. Company Financials
- 12.1.1.4. SWOT Analysis
- 12.1.2 E-band Communications LLC (Axxcss Wireless Solutions Inc )
- 12.1.2.1. Company Overview
- 12.1.2.2. Products
- 12.1.2.3. Company Financials
- 12.1.2.4. SWOT Analysis
- 12.1.3 Millimeter Wave Products Inc
- 12.1.3.1. Company Overview
- 12.1.3.2. Products
- 12.1.3.3. Company Financials
- 12.1.3.4. SWOT Analysis
- 12.1.4 NEC Corporation
- 12.1.4.1. Company Overview
- 12.1.4.2. Products
- 12.1.4.3. Company Financials
- 12.1.4.4. SWOT Analysis
- 12.1.5 Siklu Communication Ltd (Ceragon Networks Ltd)
- 12.1.5.1. Company Overview
- 12.1.5.2. Products
- 12.1.5.3. Company Financials
- 12.1.5.4. SWOT Analysis
- 12.1.6 Bridgewave Communications Inc (REMEC Broadband Wireless Networks LLC)
- 12.1.6.1. Company Overview
- 12.1.6.2. Products
- 12.1.6.3. Company Financials
- 12.1.6.4. SWOT Analysis
- 12.1.7 Keysight Technologies Inc
- 12.1.7.1. Company Overview
- 12.1.7.2. Products
- 12.1.7.3. Company Financials
- 12.1.7.4. SWOT Analysis
- 12.1.8 Smiths Interconnect Group Limited
- 12.1.8.1. Company Overview
- 12.1.8.2. Products
- 12.1.8.3. Company Financials
- 12.1.8.4. SWOT Analysis
- 12.1.9 Ducommun Incorporated
- 12.1.9.1. Company Overview
- 12.1.9.2. Products
- 12.1.9.3. Company Financials
- 12.1.9.4. SWOT Analysis
- 12.1.10 Farran Technology Ltd
- 12.1.10.1. Company Overview
- 12.1.10.2. Products
- 12.1.10.3. Company Financials
- 12.1.10.4. SWOT Analysis
- 12.1.11 Eravant (SAGE Millimeter Inc )
- 12.1.11.1. Company Overview
- 12.1.11.2. Products
- 12.1.11.3. Company Financials
- 12.1.11.4. SWOT Analysis
- 12.1.1 L3Harris Technologies Inc
- 12.2. Market Entropy
- 12.2.1 Company's Key Areas Served
- 12.2.2 Recent Developments
- 12.3. Company Market Share Analysis 2025
- 12.3.1 Top 5 Companies Market Share Analysis
- 12.3.2 Top 3 Companies Market Share Analysis
- 12.4. List of Potential Customers
- 13. Research Methodology
List of Figures
- Figure 1: Global MM Wave Technology Industry Revenue Breakdown (Million, %) by Region 2025 & 2033
- Figure 2: North America MM Wave Technology Industry Revenue (Million), by Type of Component 2025 & 2033
- Figure 3: North America MM Wave Technology Industry Revenue Share (%), by Type of Component 2025 & 2033
- Figure 4: North America MM Wave Technology Industry Revenue (Million), by Licensing Model 2025 & 2033
- Figure 5: North America MM Wave Technology Industry Revenue Share (%), by Licensing Model 2025 & 2033
- Figure 6: North America MM Wave Technology Industry Revenue (Million), by Country 2025 & 2033
- Figure 7: North America MM Wave Technology Industry Revenue Share (%), by Country 2025 & 2033
- Figure 8: Europe MM Wave Technology Industry Revenue (Million), by Type of Component 2025 & 2033
- Figure 9: Europe MM Wave Technology Industry Revenue Share (%), by Type of Component 2025 & 2033
- Figure 10: Europe MM Wave Technology Industry Revenue (Million), by Licensing Model 2025 & 2033
- Figure 11: Europe MM Wave Technology Industry Revenue Share (%), by Licensing Model 2025 & 2033
- Figure 12: Europe MM Wave Technology Industry Revenue (Million), by Country 2025 & 2033
- Figure 13: Europe MM Wave Technology Industry Revenue Share (%), by Country 2025 & 2033
- Figure 14: Asia MM Wave Technology Industry Revenue (Million), by Type of Component 2025 & 2033
- Figure 15: Asia MM Wave Technology Industry Revenue Share (%), by Type of Component 2025 & 2033
- Figure 16: Asia MM Wave Technology Industry Revenue (Million), by Licensing Model 2025 & 2033
- Figure 17: Asia MM Wave Technology Industry Revenue Share (%), by Licensing Model 2025 & 2033
- Figure 18: Asia MM Wave Technology Industry Revenue (Million), by Country 2025 & 2033
- Figure 19: Asia MM Wave Technology Industry Revenue Share (%), by Country 2025 & 2033
- Figure 20: Middle East and Africa MM Wave Technology Industry Revenue (Million), by Type of Component 2025 & 2033
- Figure 21: Middle East and Africa MM Wave Technology Industry Revenue Share (%), by Type of Component 2025 & 2033
- Figure 22: Middle East and Africa MM Wave Technology Industry Revenue (Million), by Licensing Model 2025 & 2033
- Figure 23: Middle East and Africa MM Wave Technology Industry Revenue Share (%), by Licensing Model 2025 & 2033
- Figure 24: Middle East and Africa MM Wave Technology Industry Revenue (Million), by Country 2025 & 2033
- Figure 25: Middle East and Africa MM Wave Technology Industry Revenue Share (%), by Country 2025 & 2033
- Figure 26: Latin America MM Wave Technology Industry Revenue (Million), by Type of Component 2025 & 2033
- Figure 27: Latin America MM Wave Technology Industry Revenue Share (%), by Type of Component 2025 & 2033
- Figure 28: Latin America MM Wave Technology Industry Revenue (Million), by Licensing Model 2025 & 2033
- Figure 29: Latin America MM Wave Technology Industry Revenue Share (%), by Licensing Model 2025 & 2033
- Figure 30: Latin America MM Wave Technology Industry Revenue (Million), by Country 2025 & 2033
- Figure 31: Latin America MM Wave Technology Industry Revenue Share (%), by Country 2025 & 2033
List of Tables
- Table 1: Global MM Wave Technology Industry Revenue Million Forecast, by Type of Component 2020 & 2033
- Table 2: Global MM Wave Technology Industry Revenue Million Forecast, by Licensing Model 2020 & 2033
- Table 3: Global MM Wave Technology Industry Revenue Million Forecast, by Region 2020 & 2033
- Table 4: Global MM Wave Technology Industry Revenue Million Forecast, by Type of Component 2020 & 2033
- Table 5: Global MM Wave Technology Industry Revenue Million Forecast, by Licensing Model 2020 & 2033
- Table 6: Global MM Wave Technology Industry Revenue Million Forecast, by Country 2020 & 2033
- Table 7: United States MM Wave Technology Industry Revenue (Million) Forecast, by Application 2020 & 2033
- Table 8: Canada MM Wave Technology Industry Revenue (Million) Forecast, by Application 2020 & 2033
- Table 9: Global MM Wave Technology Industry Revenue Million Forecast, by Type of Component 2020 & 2033
- Table 10: Global MM Wave Technology Industry Revenue Million Forecast, by Licensing Model 2020 & 2033
- Table 11: Global MM Wave Technology Industry Revenue Million Forecast, by Country 2020 & 2033
- Table 12: United Kingdom MM Wave Technology Industry Revenue (Million) Forecast, by Application 2020 & 2033
- Table 13: Germany MM Wave Technology Industry Revenue (Million) Forecast, by Application 2020 & 2033
- Table 14: France MM Wave Technology Industry Revenue (Million) Forecast, by Application 2020 & 2033
- Table 15: Global MM Wave Technology Industry Revenue Million Forecast, by Type of Component 2020 & 2033
- Table 16: Global MM Wave Technology Industry Revenue Million Forecast, by Licensing Model 2020 & 2033
- Table 17: Global MM Wave Technology Industry Revenue Million Forecast, by Country 2020 & 2033
- Table 18: China MM Wave Technology Industry Revenue (Million) Forecast, by Application 2020 & 2033
- Table 19: Japan MM Wave Technology Industry Revenue (Million) Forecast, by Application 2020 & 2033
- Table 20: India MM Wave Technology Industry Revenue (Million) Forecast, by Application 2020 & 2033
- Table 21: South Korea MM Wave Technology Industry Revenue (Million) Forecast, by Application 2020 & 2033
- Table 22: Global MM Wave Technology Industry Revenue Million Forecast, by Type of Component 2020 & 2033
- Table 23: Global MM Wave Technology Industry Revenue Million Forecast, by Licensing Model 2020 & 2033
- Table 24: Global MM Wave Technology Industry Revenue Million Forecast, by Country 2020 & 2033
- Table 25: Global MM Wave Technology Industry Revenue Million Forecast, by Type of Component 2020 & 2033
- Table 26: Global MM Wave Technology Industry Revenue Million Forecast, by Licensing Model 2020 & 2033
- Table 27: Global MM Wave Technology Industry Revenue Million Forecast, by Country 2020 & 2033
Frequently Asked Questions
1. What is the projected Compound Annual Growth Rate (CAGR) of the MM Wave Technology Industry?
The projected CAGR is approximately 24.60%.
2. Which companies are prominent players in the MM Wave Technology Industry?
Key companies in the market include L3Harris Technologies Inc, E-band Communications LLC (Axxcss Wireless Solutions Inc ), Millimeter Wave Products Inc, NEC Corporation, Siklu Communication Ltd (Ceragon Networks Ltd), Bridgewave Communications Inc (REMEC Broadband Wireless Networks LLC), Keysight Technologies Inc, Smiths Interconnect Group Limited, Ducommun Incorporated, Farran Technology Ltd, Eravant (SAGE Millimeter Inc ).
3. What are the main segments of the MM Wave Technology Industry?
The market segments include Type of Component, Licensing Model.
4. Can you provide details about the market size?
The market size is estimated to be USD 3.63 Million as of 2022.
5. What are some drivers contributing to market growth?
Proliferation of Wireless Backhaul of Base Stations; Evolution of 5G is Expected to Drive the Market.
6. What are the notable trends driving market growth?
Antennas and Transceivers Segment Holds Significant Market Share.
7. Are there any restraints impacting market growth?
Need for Manufacturing of Compatible Components and Rising Cost of Components; Technological Vulnerabilities Leading to Reduced Wave Strength.
8. Can you provide examples of recent developments in the market?
November 2023 - Throughout the UK, localities were aided in adopting advanced wireless technologies and enhancing their digital connectivity, including drones to monitor livestock and crops, smart systems to decrease congestion, and moveable 5G networks to allow super-fast live programs from remote locations. The ten multi-local authority zones across all four parts of the UK will obtain a share of EUR 36 million (USD 38.95 million) as they develop into 5G Innovation Regions (5GIRs). The capital will drive the adoption and development of advanced wireless technologies, including 5G, ensuring groups in cities, towns, and rural areas fully benefit from the benefits advanced digital technologies and wireless connectivity can provide and attract commercial investment to develop the economy.
9. What pricing options are available for accessing the report?
Pricing options include single-user, multi-user, and enterprise licenses priced at USD 4750, USD 5250, and USD 8750 respectively.
10. Is the market size provided in terms of value or volume?
The market size is provided in terms of value, measured in Million.
11. Are there any specific market keywords associated with the report?
Yes, the market keyword associated with the report is "MM Wave Technology Industry," which aids in identifying and referencing the specific market segment covered.
12. How do I determine which pricing option suits my needs best?
The pricing options vary based on user requirements and access needs. Individual users may opt for single-user licenses, while businesses requiring broader access may choose multi-user or enterprise licenses for cost-effective access to the report.
13. Are there any additional resources or data provided in the MM Wave Technology Industry report?
While the report offers comprehensive insights, it's advisable to review the specific contents or supplementary materials provided to ascertain if additional resources or data are available.
14. How can I stay updated on further developments or reports in the MM Wave Technology Industry?
To stay informed about further developments, trends, and reports in the MM Wave Technology Industry, consider subscribing to industry newsletters, following relevant companies and organizations, or regularly checking reputable industry news sources and publications.
Methodology
Step 1 - Identification of Relevant Samples Size from Population Database


Step 2 - Approaches for Defining Global Market Size (Value, Volume* & Price*)

Note*: In applicable scenarios
Step 3 - Data Sources
Primary Research
- Web Analytics
- Survey Reports
- Research Institute
- Latest Research Reports
- Opinion Leaders
Secondary Research
- Annual Reports
- White Paper
- Latest Press Release
- Industry Association
- Paid Database
- Investor Presentations

Step 4 - Data Triangulation
Involves using different sources of information in order to increase the validity of a study
These sources are likely to be stakeholders in a program - participants, other researchers, program staff, other community members, and so on.
Then we put all data in single framework & apply various statistical tools to find out the dynamic on the market.
During the analysis stage, feedback from the stakeholder groups would be compared to determine areas of agreement as well as areas of divergence