

Key Insights
The Non-Destructive Testing (NDT) market in the power generation sector is poised for significant expansion, fueled by the critical need for reliable power infrastructure, stringent safety regulations, and ongoing equipment maintenance mandates. This market is projected to grow at a Compound Annual Growth Rate (CAGR) of 6.24%, reaching a market size of $4.18 billion by the base year 2025. Key growth catalysts include the aging global power infrastructure, demanding frequent inspections and maintenance, coupled with the increasing adoption of advanced NDT technologies such as ultrasonic and radiography testing for superior defect detection. The growing emphasis on predictive maintenance strategies to minimize operational downtime further supports market expansion. The services segment holds a substantial market share, underscoring the consistent demand for skilled NDT professionals and specialized inspection solutions. Radiography and ultrasonic testing remain the leading technologies due to their proven efficacy in identifying diverse flaws in power generation equipment.
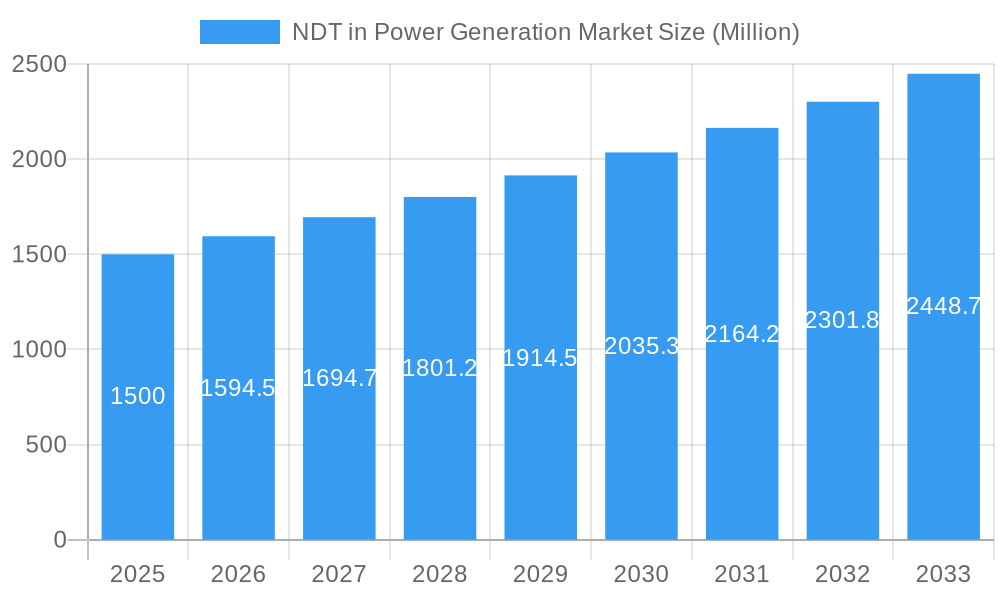
NDT in Power Generation Market Market Size (In Billion)
Technological advancements, including the development of automated and remote inspection systems, enhanced data analytics, and the integration of artificial intelligence, are accelerating market growth. Geographically, North America and Europe currently lead the market due to their mature power infrastructure and rigorous safety standards. However, the Asia-Pacific region is emerging as a high-growth market, driven by rapid industrialization and substantial investments in power generation capacity.
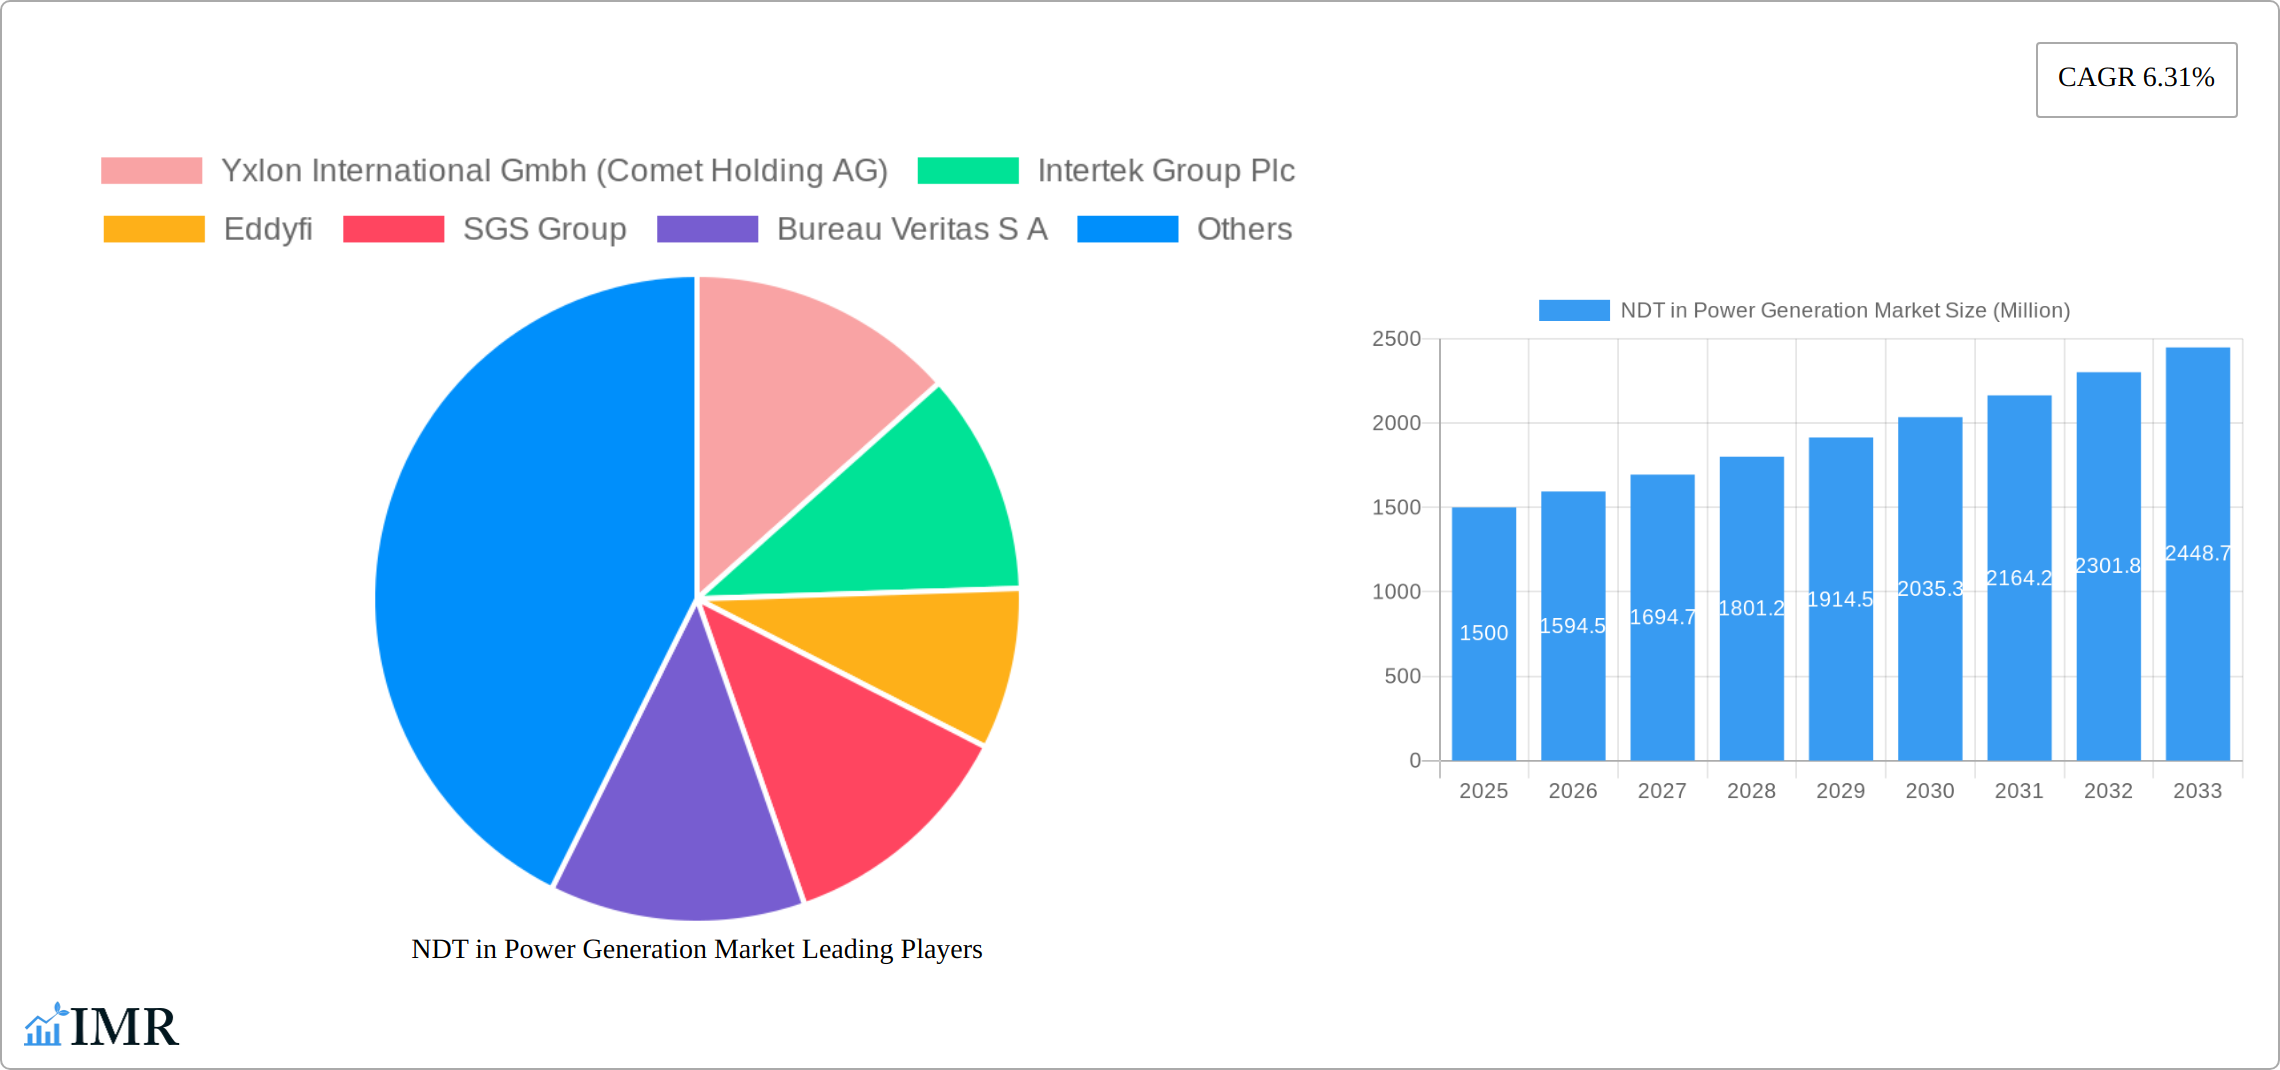
NDT in Power Generation Market Company Market Share
While the market outlook is robust, challenges such as the high cost of advanced NDT equipment and specialized labor, the potential for human error in visual inspections, and the need for continuous adaptation to evolving industry standards and regulations persist. These challenges are anticipated to be addressed through ongoing technological innovation, increased investment in training and education, and industry-wide standardization initiatives. Key market participants, including Yxlon, Intertek, Eddyfi, and SGS, are strategically positioned to meet the escalating demand for NDT services and equipment.
This comprehensive market research report analyzes the Non-Destructive Testing (NDT) market in power generation for the period 2019-2033. It provides in-depth insights into market dynamics, growth trajectories, regional performance, product segmentation, key challenges, emerging opportunities, and profiles of leading industry players. The report is an essential resource for industry professionals, investors, and strategic decision-makers seeking a thorough understanding of this vital sector. The market is segmented by type (Services, Equipment) and testing technology (Radiography Testing, Ultrasonic Testing, Visual Inspection Testing, Eddy Current Testing, Other Testing Technologies).
NDT in Power Generation Market Dynamics & Structure
The NDT market in power generation is characterized by moderate concentration, with key players like Yxlon International GmbH (Comet Holding AG), Intertek Group Plc, Eddyfi, SGS Group, Bureau Veritas S.A., Fujifilm Corporation, Mistras Group Inc, Zetec Inc, Applus+ Services Technologies S.L., Baker Hughes Company, Team Inc, and Olympus Corporation holding significant market share. However, the market also features a substantial number of smaller, specialized companies. The market is witnessing considerable technological innovation driven by the need for enhanced inspection efficiency and accuracy, particularly in challenging environments such as nuclear power plants.
- Market Concentration: Moderately concentrated, with a few dominant players and many smaller firms. The top 5 players hold approximately xx% of the market share in 2025.
- Technological Innovation: Significant focus on AI-powered inspection tools, automation, and improved data analysis capabilities. Barriers to innovation include high R&D costs and regulatory approval processes.
- Regulatory Frameworks: Stringent safety regulations and compliance requirements in power generation drive demand for NDT services and equipment. Variations in regulations across regions create complexities.
- Competitive Product Substitutes: Limited direct substitutes exist, but advancements in other inspection technologies (e.g., advanced imaging techniques) pose indirect competition.
- End-User Demographics: Primarily comprised of power generation companies (nuclear, thermal, renewable), EPC contractors, and independent inspection firms.
- M&A Trends: The market has seen a moderate level of mergers and acquisitions, primarily focused on expanding service offerings, geographical reach, and technological capabilities. An estimated xx M&A deals were closed between 2019 and 2024.
NDT in Power Generation Market Growth Trends & Insights
The Non-Destructive Testing (NDT) market within the power generation sector has demonstrated robust growth historically, driven by the imperative to maintain aging infrastructure, meet escalating global energy demands, and adhere to increasingly stringent safety and environmental regulations. This sustained demand is projected to fuel continued expansion throughout the forecast period (2025-2033), albeit with a potentially moderated Compound Annual Growth Rate (CAGR) compared to the 2019-2024 timeframe. A significant catalyst for this growth is the burgeoning adoption of renewable energy sources, including solar and wind power, which necessitates specialized NDT solutions for the inspection and ongoing maintenance of these complex assets. Furthermore, the strategic shift towards predictive maintenance methodologies, leveraging advanced data analytics and AI, is substantially amplifying the demand for sophisticated NDT services. Technological innovations, particularly the integration of Artificial Intelligence (AI) and sophisticated data analytics platforms, are revolutionizing NDT by enhancing inspection efficiency, accuracy, and the predictive capabilities of maintenance programs. This technological advancement, coupled with a growing global consumer preference for sustainable and reliable energy, underscores the critical need for comprehensive and effective infrastructure integrity management.
- Market Size Evolution: The market size is estimated to have grown from an initial XX Million units in 2019 to XX Million units by 2024. Projections indicate a further expansion to XX Million units by 2033, reflecting sustained market vitality.
- CAGR (2019-2024): XX%
- CAGR (2025-2033): XX%
- Market Penetration: The market penetration was recorded at XX% in 2024 and is anticipated to ascend to XX% by 2033, signifying increasing adoption and importance of NDT solutions.
Dominant Regions, Countries, or Segments in NDT in Power Generation Market
North America and Europe currently dominate the NDT market in power generation, driven by a mature power infrastructure, stringent regulatory environments, and a high concentration of power generation companies. However, Asia-Pacific is expected to witness significant growth in the coming years due to rapid industrialization and expanding power generation capacity. Within the segments, Services currently hold a larger market share than Equipment, reflecting the outsourcing of NDT activities by many power generation companies. Among testing technologies, Ultrasonic Testing and Eddy Current Testing are the most widely adopted methods, although the use of Radiography Testing remains significant in certain applications.
- Leading Region: North America
- Key Drivers (North America): Stringent safety regulations, high concentration of power generation assets, and advanced technological capabilities.
- Key Drivers (Europe): Similar to North America, with a strong focus on nuclear power plant safety.
- Key Drivers (Asia-Pacific): Rapid industrialization, expanding power generation capacity, and increasing investments in renewable energy.
- Dominant Segment (Type): Services (xx% market share in 2025)
- Dominant Segment (Technology): Ultrasonic Testing (xx% market share in 2025)
NDT in Power Generation Market Product Landscape
The NDT product and service landscape for the power generation industry is characterized by its breadth and depth, encompassing a comprehensive array of solutions. This includes highly portable and advanced stationary testing equipment, sophisticated software platforms engineered for intricate data analysis, and a full spectrum of specialized NDT services. Recent technological advancements have been predominantly focused on enhancing the portability and user-friendliness of testing devices, while simultaneously improving their accuracy and the speed of inspections. Concurrently, there's a strong emphasis on augmenting data analysis capabilities through the integration of cutting-edge AI and machine learning algorithms, enabling more insightful interpretations and predictive outcomes. Key differentiators and unique selling propositions within this market often revolve around achieving superior image resolution, intuitive ease of operation, advanced data processing functionalities, and a significant reduction in overall inspection durations. Core performance metrics that define success include a high defect detection rate, rapid inspection turnaround times, and demonstrable overall cost-effectiveness for power generation operators.
Key Drivers, Barriers & Challenges in NDT in Power Generation Market
Key Drivers: The sustained growth of the NDT in power generation market is primarily propelled by a confluence of factors: the imperative adherence to stringent safety and regulatory standards across all energy sectors, the ongoing need to manage and maintain aging power infrastructure, the fundamental requirement for reliable and uninterrupted power supply, the increasing adoption of predictive maintenance strategies to minimize downtime and optimize asset life, and the transformative impact of technological advancements, including the integration of AI and advanced data analytics, which enhance inspection efficiency and predictive capabilities.
Key Barriers & Challenges: Despite the strong growth potential, the market faces several significant hurdles. The substantial initial investment required for acquiring state-of-the-art NDT equipment can be a considerable barrier for some organizations. A persistent shortage of highly skilled and certified NDT technicians poses a challenge in meeting the growing demand for services. The complexity of integrating novel NDT technologies into established operational workflows requires careful planning and execution. Moreover, global supply chain disruptions can significantly impact the availability and cost of critical NDT equipment and specialized materials, potentially leading to a projected market growth reduction of up to XX% in affected periods.
Emerging Opportunities in NDT in Power Generation Market
Emerging opportunities lie in the increasing adoption of AI and machine learning in NDT, the growth of renewable energy sources (requiring specialized NDT techniques), and the expansion into untapped markets in developing countries. Advanced robotic inspection systems and drone-based NDT are also gaining traction, creating new market segments.
Growth Accelerators in the NDT in Power Generation Market Industry
Long-term growth will be driven by continuous technological advancements, strategic partnerships between NDT providers and power generation companies, and the expansion of NDT services to encompass emerging areas like offshore wind energy and green hydrogen production. Government initiatives promoting infrastructure upgrades and renewable energy adoption will also play a crucial role.
Key Players Shaping the NDT in Power Generation Market Market
Notable Milestones in NDT in Power Generation Market Sector
- June 2022: The launch of the AUTEND project marked a significant step towards leveraging AI for accelerating inspection processes in nuclear power plants, highlighting a commitment to advanced technological integration.
- April 2021: The strategic partnership between IR Supplies and Services and Creative Electron significantly enhanced inspection capabilities for Canadian power generation organizations, demonstrating collaborative innovation in the sector.
- March 2021: Applus+'s strategic acquisitions of Inecosa and Adícora broadened its operational footprint and service offerings within the vital power generation sector, indicating market consolidation and expansion efforts.
In-Depth NDT in Power Generation Market Market Outlook
The future of the NDT market in power generation is bright, with sustained growth projected across all segments. Strategic opportunities exist in developing innovative solutions for renewable energy infrastructure inspection, leveraging AI for advanced data analysis, and expanding into emerging markets. The ongoing need for reliable and safe power generation coupled with technological advancements will ensure the continued growth of this vital sector.
NDT in Power Generation Market Segmentation
-
1. Type
- 1.1. Services
- 1.2. Equipment
-
2. Testing Technology
- 2.1. Radiography Testing
- 2.2. Ultrasonic Testing
- 2.3. Visual Inspection Testing
- 2.4. Eddy Current Testing
- 2.5. Other Testing Technologies
NDT in Power Generation Market Segmentation By Geography
-
1. North America
- 1.1. United States
- 1.2. Canada
-
2. Europe
- 2.1. United Kingdom
- 2.2. Germany
- 2.3. France
- 2.4. Rest of Europe
-
3. Asia Pacific
- 3.1. China
- 3.2. Japan
- 3.3. India
- 3.4. Rest of Asia Pacific
- 4. Latin America
- 5. Middle East and Africa
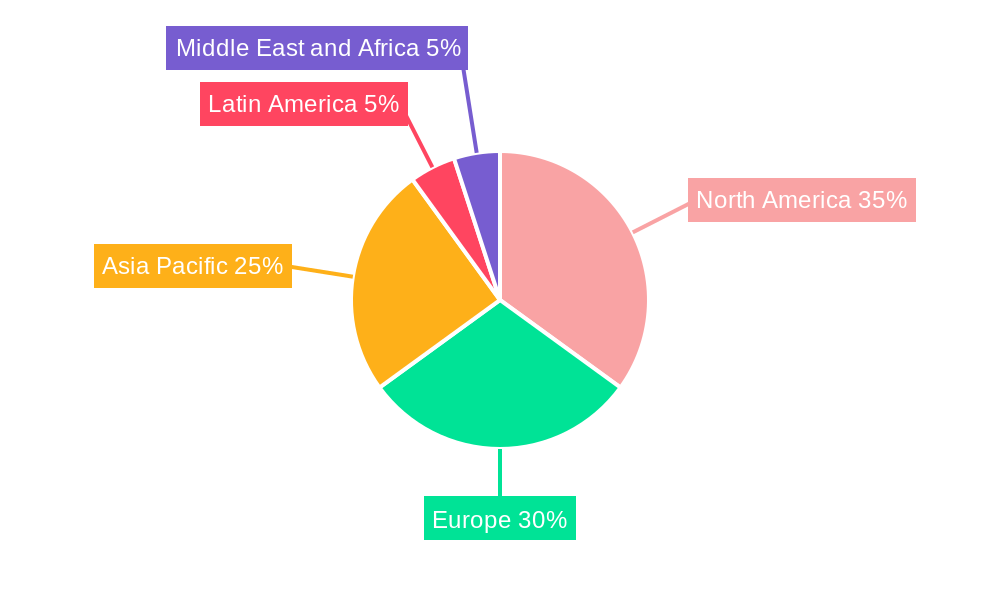
NDT in Power Generation Market Regional Market Share
Geographic Coverage of NDT in Power Generation Market
NDT in Power Generation Market REPORT HIGHLIGHTS
| Aspects | Details |
|---|---|
| Study Period | 2020-2034 |
| Base Year | 2025 |
| Estimated Year | 2026 |
| Forecast Period | 2026-2034 |
| Historical Period | 2020-2025 |
| Growth Rate | CAGR of 6.24% from 2020-2034 |
| Segmentation |
|
Table of Contents
- 1. Introduction
- 1.1. Research Scope
- 1.2. Market Segmentation
- 1.3. Research Objective
- 1.4. Definitions and Assumptions
- 2. Executive Summary
- 2.1. Market Snapshot
- 3. Market Dynamics
- 3.1. Market Drivers
- 3.2. Market Restrains
- 3.3. Market Trends
- 3.4. Market Opportunities
- 4. Market Factor Analysis
- 4.1. Porters Five Forces
- 4.1.1. Bargaining Power of Suppliers
- 4.1.2. Bargaining Power of Buyers
- 4.1.3. Threat of New Entrants
- 4.1.4. Threat of Substitutes
- 4.1.5. Competitive Rivalry
- 4.2. PESTEL analysis
- 4.3. BCG Analysis
- 4.3.1. Stars (High Growth, High Market Share)
- 4.3.2. Cash Cows (Low Growth, High Market Share)
- 4.3.3. Question Mark (High Growth, Low Market Share)
- 4.3.4. Dogs (Low Growth, Low Market Share)
- 4.4. Ansoff Matrix Analysis
- 4.5. Supply Chain Analysis
- 4.6. Regulatory Landscape
- 4.7. Current Market Potential and Opportunity Assessment (TAM–SAM–SOM Framework)
- 4.8. IMR Analyst Note
- 4.1. Porters Five Forces
- 5. Market Analysis, Insights and Forecast 2021-2033
- 5.1. Market Analysis, Insights and Forecast - by Type
- 5.1.1. Services
- 5.1.2. Equipment
- 5.2. Market Analysis, Insights and Forecast - by Testing Technology
- 5.2.1. Radiography Testing
- 5.2.2. Ultrasonic Testing
- 5.2.3. Visual Inspection Testing
- 5.2.4. Eddy Current Testing
- 5.2.5. Other Testing Technologies
- 5.3. Market Analysis, Insights and Forecast - by Region
- 5.3.1. North America
- 5.3.2. Europe
- 5.3.3. Asia Pacific
- 5.3.4. Latin America
- 5.3.5. Middle East and Africa
- 5.1. Market Analysis, Insights and Forecast - by Type
- 6. Global NDT in Power Generation Market Analysis, Insights and Forecast, 2021-2033
- 6.1. Market Analysis, Insights and Forecast - by Type
- 6.1.1. Services
- 6.1.2. Equipment
- 6.2. Market Analysis, Insights and Forecast - by Testing Technology
- 6.2.1. Radiography Testing
- 6.2.2. Ultrasonic Testing
- 6.2.3. Visual Inspection Testing
- 6.2.4. Eddy Current Testing
- 6.2.5. Other Testing Technologies
- 6.1. Market Analysis, Insights and Forecast - by Type
- 7. North America NDT in Power Generation Market Analysis, Insights and Forecast, 2020-2032
- 7.1. Market Analysis, Insights and Forecast - by Type
- 7.1.1. Services
- 7.1.2. Equipment
- 7.2. Market Analysis, Insights and Forecast - by Testing Technology
- 7.2.1. Radiography Testing
- 7.2.2. Ultrasonic Testing
- 7.2.3. Visual Inspection Testing
- 7.2.4. Eddy Current Testing
- 7.2.5. Other Testing Technologies
- 7.1. Market Analysis, Insights and Forecast - by Type
- 8. Europe NDT in Power Generation Market Analysis, Insights and Forecast, 2020-2032
- 8.1. Market Analysis, Insights and Forecast - by Type
- 8.1.1. Services
- 8.1.2. Equipment
- 8.2. Market Analysis, Insights and Forecast - by Testing Technology
- 8.2.1. Radiography Testing
- 8.2.2. Ultrasonic Testing
- 8.2.3. Visual Inspection Testing
- 8.2.4. Eddy Current Testing
- 8.2.5. Other Testing Technologies
- 8.1. Market Analysis, Insights and Forecast - by Type
- 9. Asia Pacific NDT in Power Generation Market Analysis, Insights and Forecast, 2020-2032
- 9.1. Market Analysis, Insights and Forecast - by Type
- 9.1.1. Services
- 9.1.2. Equipment
- 9.2. Market Analysis, Insights and Forecast - by Testing Technology
- 9.2.1. Radiography Testing
- 9.2.2. Ultrasonic Testing
- 9.2.3. Visual Inspection Testing
- 9.2.4. Eddy Current Testing
- 9.2.5. Other Testing Technologies
- 9.1. Market Analysis, Insights and Forecast - by Type
- 10. Latin America NDT in Power Generation Market Analysis, Insights and Forecast, 2020-2032
- 10.1. Market Analysis, Insights and Forecast - by Type
- 10.1.1. Services
- 10.1.2. Equipment
- 10.2. Market Analysis, Insights and Forecast - by Testing Technology
- 10.2.1. Radiography Testing
- 10.2.2. Ultrasonic Testing
- 10.2.3. Visual Inspection Testing
- 10.2.4. Eddy Current Testing
- 10.2.5. Other Testing Technologies
- 10.1. Market Analysis, Insights and Forecast - by Type
- 11. Middle East and Africa NDT in Power Generation Market Analysis, Insights and Forecast, 2020-2032
- 11.1. Market Analysis, Insights and Forecast - by Type
- 11.1.1. Services
- 11.1.2. Equipment
- 11.2. Market Analysis, Insights and Forecast - by Testing Technology
- 11.2.1. Radiography Testing
- 11.2.2. Ultrasonic Testing
- 11.2.3. Visual Inspection Testing
- 11.2.4. Eddy Current Testing
- 11.2.5. Other Testing Technologies
- 11.1. Market Analysis, Insights and Forecast - by Type
- 12. Competitive Analysis
- 12.1. Company Profiles
- 12.1.1 Yxlon International Gmbh (Comet Holding AG)
- 12.1.1.1. Company Overview
- 12.1.1.2. Products
- 12.1.1.3. Company Financials
- 12.1.1.4. SWOT Analysis
- 12.1.2 Intertek Group Plc
- 12.1.2.1. Company Overview
- 12.1.2.2. Products
- 12.1.2.3. Company Financials
- 12.1.2.4. SWOT Analysis
- 12.1.3 Eddyfi
- 12.1.3.1. Company Overview
- 12.1.3.2. Products
- 12.1.3.3. Company Financials
- 12.1.3.4. SWOT Analysis
- 12.1.4 SGS Group
- 12.1.4.1. Company Overview
- 12.1.4.2. Products
- 12.1.4.3. Company Financials
- 12.1.4.4. SWOT Analysis
- 12.1.5 Bureau Veritas S A
- 12.1.5.1. Company Overview
- 12.1.5.2. Products
- 12.1.5.3. Company Financials
- 12.1.5.4. SWOT Analysis
- 12.1.6 Fujifilm Corporation
- 12.1.6.1. Company Overview
- 12.1.6.2. Products
- 12.1.6.3. Company Financials
- 12.1.6.4. SWOT Analysis
- 12.1.7 Mistras Group Inc
- 12.1.7.1. Company Overview
- 12.1.7.2. Products
- 12.1.7.3. Company Financials
- 12.1.7.4. SWOT Analysis
- 12.1.8 Zetec Inc
- 12.1.8.1. Company Overview
- 12.1.8.2. Products
- 12.1.8.3. Company Financials
- 12.1.8.4. SWOT Analysis
- 12.1.9 Applus+ Services Technologies S L
- 12.1.9.1. Company Overview
- 12.1.9.2. Products
- 12.1.9.3. Company Financials
- 12.1.9.4. SWOT Analysis
- 12.1.10 Baker Hughes Company
- 12.1.10.1. Company Overview
- 12.1.10.2. Products
- 12.1.10.3. Company Financials
- 12.1.10.4. SWOT Analysis
- 12.1.11 Team Inc *List Not Exhaustive
- 12.1.11.1. Company Overview
- 12.1.11.2. Products
- 12.1.11.3. Company Financials
- 12.1.11.4. SWOT Analysis
- 12.1.12 Olympus Corporation
- 12.1.12.1. Company Overview
- 12.1.12.2. Products
- 12.1.12.3. Company Financials
- 12.1.12.4. SWOT Analysis
- 12.1.1 Yxlon International Gmbh (Comet Holding AG)
- 12.2. Market Entropy
- 12.2.1 Company's Key Areas Served
- 12.2.2 Recent Developments
- 12.3. Company Market Share Analysis 2025
- 12.3.1 Top 5 Companies Market Share Analysis
- 12.3.2 Top 3 Companies Market Share Analysis
- 12.4. List of Potential Customers
- 13. Research Methodology
List of Figures
- Figure 1: Global NDT in Power Generation Market Revenue Breakdown (billion, %) by Region 2025 & 2033
- Figure 2: North America NDT in Power Generation Market Revenue (billion), by Type 2025 & 2033
- Figure 3: North America NDT in Power Generation Market Revenue Share (%), by Type 2025 & 2033
- Figure 4: North America NDT in Power Generation Market Revenue (billion), by Testing Technology 2025 & 2033
- Figure 5: North America NDT in Power Generation Market Revenue Share (%), by Testing Technology 2025 & 2033
- Figure 6: North America NDT in Power Generation Market Revenue (billion), by Country 2025 & 2033
- Figure 7: North America NDT in Power Generation Market Revenue Share (%), by Country 2025 & 2033
- Figure 8: Europe NDT in Power Generation Market Revenue (billion), by Type 2025 & 2033
- Figure 9: Europe NDT in Power Generation Market Revenue Share (%), by Type 2025 & 2033
- Figure 10: Europe NDT in Power Generation Market Revenue (billion), by Testing Technology 2025 & 2033
- Figure 11: Europe NDT in Power Generation Market Revenue Share (%), by Testing Technology 2025 & 2033
- Figure 12: Europe NDT in Power Generation Market Revenue (billion), by Country 2025 & 2033
- Figure 13: Europe NDT in Power Generation Market Revenue Share (%), by Country 2025 & 2033
- Figure 14: Asia Pacific NDT in Power Generation Market Revenue (billion), by Type 2025 & 2033
- Figure 15: Asia Pacific NDT in Power Generation Market Revenue Share (%), by Type 2025 & 2033
- Figure 16: Asia Pacific NDT in Power Generation Market Revenue (billion), by Testing Technology 2025 & 2033
- Figure 17: Asia Pacific NDT in Power Generation Market Revenue Share (%), by Testing Technology 2025 & 2033
- Figure 18: Asia Pacific NDT in Power Generation Market Revenue (billion), by Country 2025 & 2033
- Figure 19: Asia Pacific NDT in Power Generation Market Revenue Share (%), by Country 2025 & 2033
- Figure 20: Latin America NDT in Power Generation Market Revenue (billion), by Type 2025 & 2033
- Figure 21: Latin America NDT in Power Generation Market Revenue Share (%), by Type 2025 & 2033
- Figure 22: Latin America NDT in Power Generation Market Revenue (billion), by Testing Technology 2025 & 2033
- Figure 23: Latin America NDT in Power Generation Market Revenue Share (%), by Testing Technology 2025 & 2033
- Figure 24: Latin America NDT in Power Generation Market Revenue (billion), by Country 2025 & 2033
- Figure 25: Latin America NDT in Power Generation Market Revenue Share (%), by Country 2025 & 2033
- Figure 26: Middle East and Africa NDT in Power Generation Market Revenue (billion), by Type 2025 & 2033
- Figure 27: Middle East and Africa NDT in Power Generation Market Revenue Share (%), by Type 2025 & 2033
- Figure 28: Middle East and Africa NDT in Power Generation Market Revenue (billion), by Testing Technology 2025 & 2033
- Figure 29: Middle East and Africa NDT in Power Generation Market Revenue Share (%), by Testing Technology 2025 & 2033
- Figure 30: Middle East and Africa NDT in Power Generation Market Revenue (billion), by Country 2025 & 2033
- Figure 31: Middle East and Africa NDT in Power Generation Market Revenue Share (%), by Country 2025 & 2033
List of Tables
- Table 1: Global NDT in Power Generation Market Revenue billion Forecast, by Type 2020 & 2033
- Table 2: Global NDT in Power Generation Market Revenue billion Forecast, by Testing Technology 2020 & 2033
- Table 3: Global NDT in Power Generation Market Revenue billion Forecast, by Region 2020 & 2033
- Table 4: Global NDT in Power Generation Market Revenue billion Forecast, by Type 2020 & 2033
- Table 5: Global NDT in Power Generation Market Revenue billion Forecast, by Testing Technology 2020 & 2033
- Table 6: Global NDT in Power Generation Market Revenue billion Forecast, by Country 2020 & 2033
- Table 7: United States NDT in Power Generation Market Revenue (billion) Forecast, by Application 2020 & 2033
- Table 8: Canada NDT in Power Generation Market Revenue (billion) Forecast, by Application 2020 & 2033
- Table 9: Global NDT in Power Generation Market Revenue billion Forecast, by Type 2020 & 2033
- Table 10: Global NDT in Power Generation Market Revenue billion Forecast, by Testing Technology 2020 & 2033
- Table 11: Global NDT in Power Generation Market Revenue billion Forecast, by Country 2020 & 2033
- Table 12: United Kingdom NDT in Power Generation Market Revenue (billion) Forecast, by Application 2020 & 2033
- Table 13: Germany NDT in Power Generation Market Revenue (billion) Forecast, by Application 2020 & 2033
- Table 14: France NDT in Power Generation Market Revenue (billion) Forecast, by Application 2020 & 2033
- Table 15: Rest of Europe NDT in Power Generation Market Revenue (billion) Forecast, by Application 2020 & 2033
- Table 16: Global NDT in Power Generation Market Revenue billion Forecast, by Type 2020 & 2033
- Table 17: Global NDT in Power Generation Market Revenue billion Forecast, by Testing Technology 2020 & 2033
- Table 18: Global NDT in Power Generation Market Revenue billion Forecast, by Country 2020 & 2033
- Table 19: China NDT in Power Generation Market Revenue (billion) Forecast, by Application 2020 & 2033
- Table 20: Japan NDT in Power Generation Market Revenue (billion) Forecast, by Application 2020 & 2033
- Table 21: India NDT in Power Generation Market Revenue (billion) Forecast, by Application 2020 & 2033
- Table 22: Rest of Asia Pacific NDT in Power Generation Market Revenue (billion) Forecast, by Application 2020 & 2033
- Table 23: Global NDT in Power Generation Market Revenue billion Forecast, by Type 2020 & 2033
- Table 24: Global NDT in Power Generation Market Revenue billion Forecast, by Testing Technology 2020 & 2033
- Table 25: Global NDT in Power Generation Market Revenue billion Forecast, by Country 2020 & 2033
- Table 26: Global NDT in Power Generation Market Revenue billion Forecast, by Type 2020 & 2033
- Table 27: Global NDT in Power Generation Market Revenue billion Forecast, by Testing Technology 2020 & 2033
- Table 28: Global NDT in Power Generation Market Revenue billion Forecast, by Country 2020 & 2033
Frequently Asked Questions
1. What is the projected Compound Annual Growth Rate (CAGR) of the NDT in Power Generation Market?
The projected CAGR is approximately 6.24%.
2. Which companies are prominent players in the NDT in Power Generation Market?
Key companies in the market include Yxlon International Gmbh (Comet Holding AG), Intertek Group Plc, Eddyfi, SGS Group, Bureau Veritas S A, Fujifilm Corporation, Mistras Group Inc, Zetec Inc, Applus+ Services Technologies S L, Baker Hughes Company, Team Inc *List Not Exhaustive, Olympus Corporation.
3. What are the main segments of the NDT in Power Generation Market?
The market segments include Type, Testing Technology.
4. Can you provide details about the market size?
The market size is estimated to be USD 4.18 billion as of 2022.
5. What are some drivers contributing to market growth?
Stringent Regulations Mandating Safety Standards; Increase in Demand for Flaw Detection to Reduce Repair Cost; Aging Infrastructure and Increasing Need for Maintenance.
6. What are the notable trends driving market growth?
Visual Inspection Testing is Expected to Witness a Significant Growth.
7. Are there any restraints impacting market growth?
Lack of Skilled Workforce and Training Regulations.
8. Can you provide examples of recent developments in the market?
June 2022 - ALEIA, a startup specializing in AI, and Omexom NDT Engineering & Services, in collaboration with the Laboratoire d'Acoustique de l'Université du Mans (LAUM) UMR CNRS, have announced the deployment of the AUTEND project. The project is aimed to accelerate the inspection of nuclear power plants through AI. Moreover, the project is presently focusing on Non-Destructive Testing, which is an inspection process for nuclear infrastructures using eddy current or ultrasonic testing methods.
9. What pricing options are available for accessing the report?
Pricing options include single-user, multi-user, and enterprise licenses priced at USD 4750, USD 5250, and USD 8750 respectively.
10. Is the market size provided in terms of value or volume?
The market size is provided in terms of value, measured in billion.
11. Are there any specific market keywords associated with the report?
Yes, the market keyword associated with the report is "NDT in Power Generation Market," which aids in identifying and referencing the specific market segment covered.
12. How do I determine which pricing option suits my needs best?
The pricing options vary based on user requirements and access needs. Individual users may opt for single-user licenses, while businesses requiring broader access may choose multi-user or enterprise licenses for cost-effective access to the report.
13. Are there any additional resources or data provided in the NDT in Power Generation Market report?
While the report offers comprehensive insights, it's advisable to review the specific contents or supplementary materials provided to ascertain if additional resources or data are available.
14. How can I stay updated on further developments or reports in the NDT in Power Generation Market?
To stay informed about further developments, trends, and reports in the NDT in Power Generation Market, consider subscribing to industry newsletters, following relevant companies and organizations, or regularly checking reputable industry news sources and publications.
Methodology
Step 1 - Identification of Relevant Samples Size from Population Database


Step 2 - Approaches for Defining Global Market Size (Value, Volume* & Price*)

Note*: In applicable scenarios
Step 3 - Data Sources
Primary Research
- Web Analytics
- Survey Reports
- Research Institute
- Latest Research Reports
- Opinion Leaders
Secondary Research
- Annual Reports
- White Paper
- Latest Press Release
- Industry Association
- Paid Database
- Investor Presentations

Step 4 - Data Triangulation
Involves using different sources of information in order to increase the validity of a study
These sources are likely to be stakeholders in a program - participants, other researchers, program staff, other community members, and so on.
Then we put all data in single framework & apply various statistical tools to find out the dynamic on the market.
During the analysis stage, feedback from the stakeholder groups would be compared to determine areas of agreement as well as areas of divergence