

Key Insights
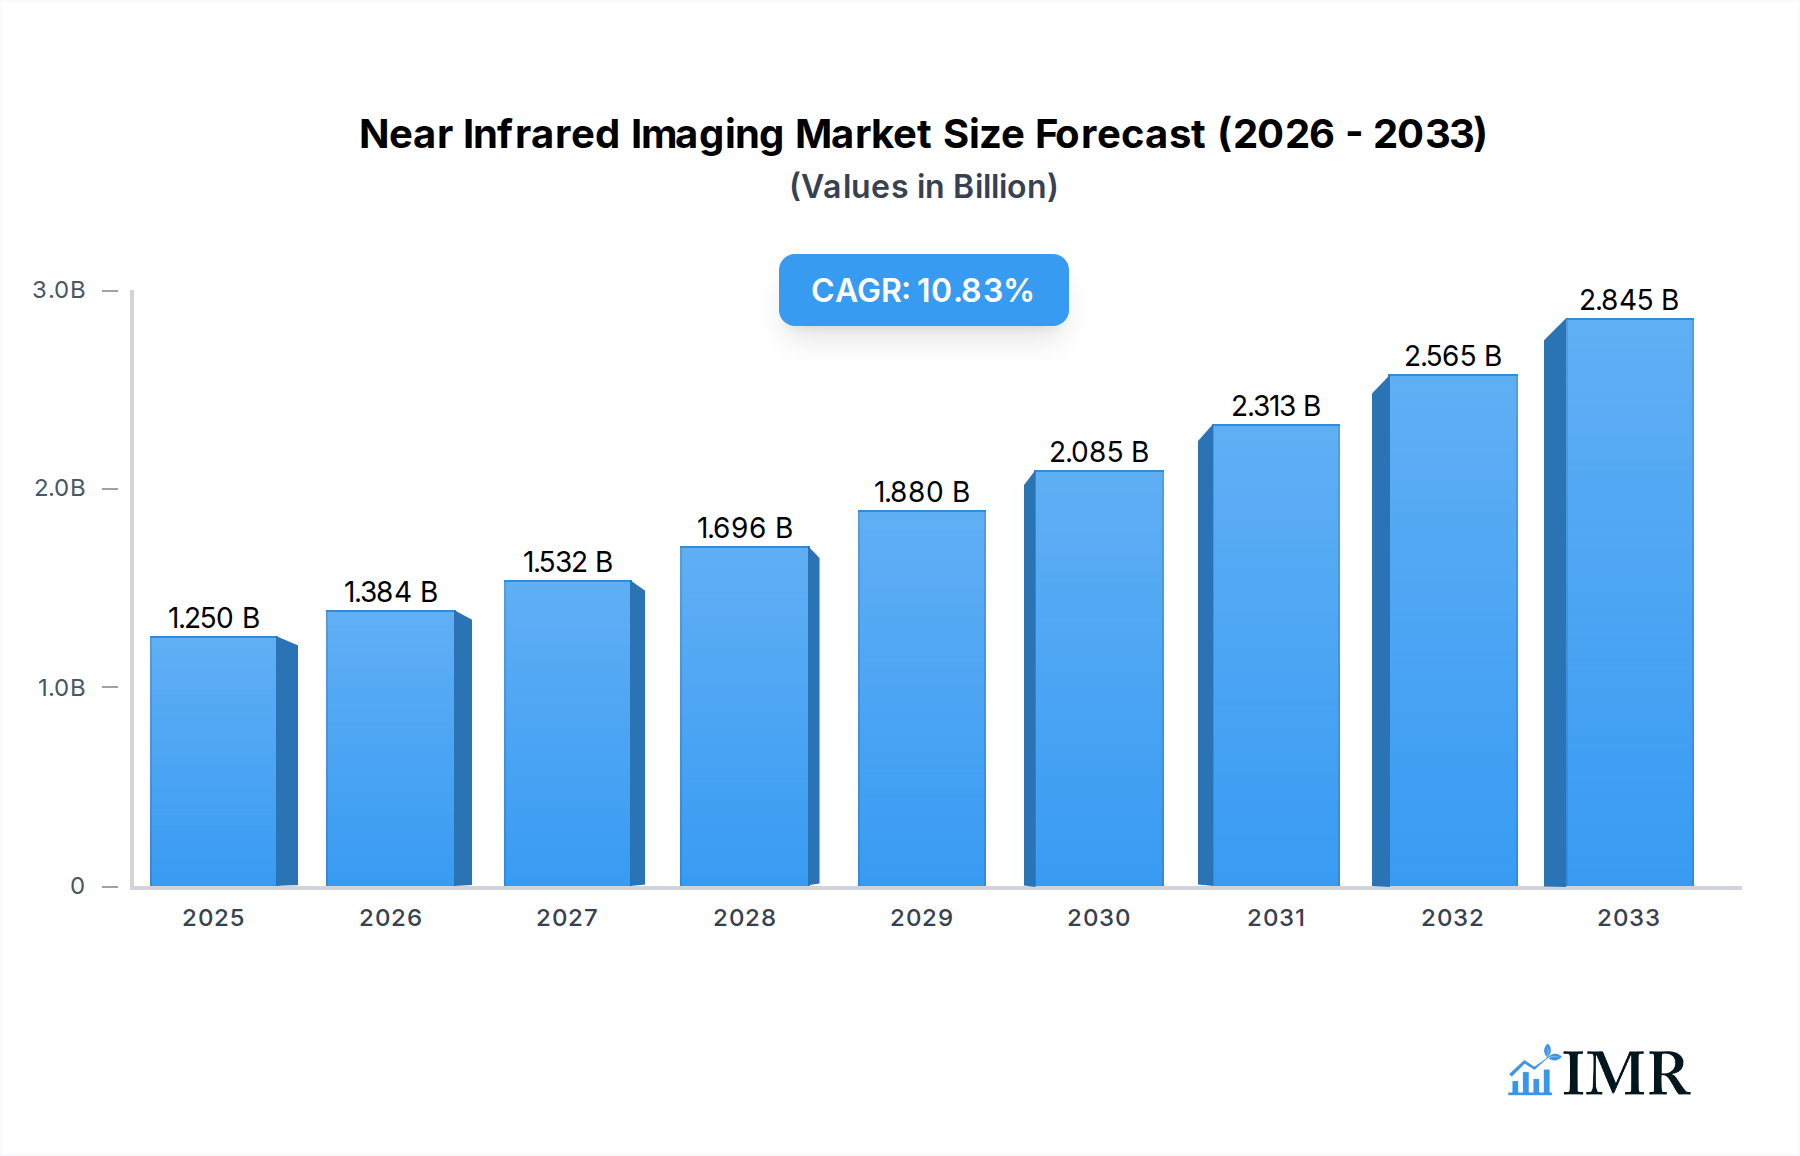
The global Near Infrared Imaging market is poised for substantial expansion, projected to reach $1.25 billion in 2025 and grow at a robust CAGR of 10.6% through 2033. This dynamic growth is fueled by the increasing adoption of near-infrared (NIR) imaging technologies across diverse sectors, most notably in medical diagnostics and treatment. Advancements in NIR fluorescence imaging devices are enabling more precise and less invasive diagnostic procedures, leading to earlier disease detection and improved patient outcomes. The chemical industry also plays a significant role, leveraging NIR spectroscopy for quality control and material analysis, while the food and beverage sector utilizes it for product authentication and nutritional analysis. Furthermore, ongoing research in fuel development is exploring NIR's potential for optimizing energy sources. The market is characterized by continuous innovation in imaging devices and fluorescent probes, enhancing sensitivity and specificity.

Near Infrared Imaging Market Size (In Billion)
The growth trajectory of the Near Infrared Imaging market is further supported by key trends such as the rising prevalence of chronic diseases, driving demand for advanced diagnostic tools, and the increasing investment in R&D for novel applications of NIR technology. The development of portable and cost-effective NIR devices is also democratizing access to this technology, particularly in developing regions. While the market enjoys strong growth, potential restraints include the high initial cost of sophisticated imaging systems and the need for specialized training for effective utilization. However, the relentless pursuit of improved imaging resolution, faster acquisition times, and expanded spectral ranges by leading companies like Bruker, Hamamatsu Photonics, and Thermo Fisher Scientific are expected to mitigate these challenges and propel the market forward. The Asia Pacific region, with its burgeoning healthcare infrastructure and a growing focus on technological adoption, is expected to emerge as a significant growth engine alongside established markets in North America and Europe.
Near Infrared Imaging Company Market Share
Near Infrared Imaging Market: Comprehensive Report and Forecast (2019–2033)
This report provides an in-depth analysis of the global Near Infrared Imaging market, examining its current dynamics, growth trajectories, and future potential. With a focus on driving innovation and market expansion, this study leverages extensive data and expert insights to equip stakeholders with actionable intelligence. The market is segmented by application and type, with key players and regional insights comprehensively detailed.
Near Infrared Imaging Market Dynamics & Structure
The Near Infrared Imaging market is characterized by a moderate to high concentration, with a few key players holding significant market share. Technological innovation remains a primary driver, fueled by advancements in detector sensitivity, illumination technologies, and image processing algorithms. Regulatory frameworks, particularly in the medical treatment sector, play a crucial role in dictating product development and market access, with stringent approval processes in place. Competitive product substitutes, while present in some niche applications, are often outmatched by the unique diagnostic and analytical capabilities of NIR imaging. End-user demographics are shifting, with increasing demand from the healthcare sector for minimally invasive diagnostic tools and from the chemical and food industries for quality control and process monitoring. Mergers and acquisitions (M&A) trends are indicative of strategic consolidation and expansion, with companies seeking to broaden their product portfolios and geographic reach. The estimated value of M&A deals in the historical period was approximately $1.5 billion.
- Market Concentration: Moderate to high, with key players focusing on specialized segments.
- Technological Innovation Drivers: Enhanced detector sensitivity, advanced illumination, AI-powered image analysis.
- Regulatory Frameworks: Strict approvals for medical applications, evolving standards for industrial use.
- Competitive Product Substitutes: Spectrophotometry, Raman spectroscopy, traditional imaging modalities in select applications.
- End-User Demographics: Growing demand from healthcare professionals, researchers, and industrial quality control managers.
- M&A Trends: Strategic acquisitions to consolidate market share and expand technological capabilities.
Near Infrared Imaging Growth Trends & Insights
The global Near Infrared Imaging market is projected to experience robust growth, driven by increasing adoption across diverse industries. The market size is estimated to reach approximately $7.8 billion by 2025, with a projected Compound Annual Growth Rate (CAGR) of 8.9% during the forecast period (2025–2033). This growth is underpinned by a rising awareness of the benefits of NIR imaging, including its non-ionizing nature, deep tissue penetration capabilities, and ability to provide functional and molecular information. Technological disruptions, such as the development of portable and handheld NIR devices and the integration of artificial intelligence for enhanced data interpretation, are further accelerating adoption rates. Consumer behavior shifts, particularly in the medical field, are favoring less invasive diagnostic techniques, making NIR imaging an increasingly attractive option for oncological, neurological, and surgical applications. In the chemical and food industries, the demand for rapid, accurate, and non-destructive quality assessment is propelling the adoption of NIR spectroscopy and imaging for ingredient analysis, contamination detection, and process optimization. Market penetration is steadily increasing, particularly in developed economies where research and development investments are high.
Dominant Regions, Countries, or Segments in Near Infrared Imaging
The Medical Treatment application segment is poised to dominate the Near Infrared Imaging market, accounting for an estimated 45% of the global market share in 2025. This dominance is fueled by significant investments in healthcare infrastructure, a growing prevalence of chronic diseases requiring advanced diagnostic tools, and continuous research into novel therapeutic applications. North America, particularly the United States, is expected to be a leading country within this segment due to its advanced healthcare system, substantial R&D expenditure, and early adoption of cutting-edge medical technologies. The region's robust regulatory framework, while stringent, also fosters innovation and ensures the safety and efficacy of medical NIR devices.
In terms of product types, Near Infrared Fluorescence Imaging Devices are expected to witness the highest growth, driven by their precision in visualizing molecular processes and cellular activities. This is particularly relevant for surgical guidance, disease diagnosis at the molecular level, and drug development research. Europe and Asia-Pacific are also significant growth regions, with increasing healthcare spending and a burgeoning medical device manufacturing industry. Key drivers in these regions include government initiatives to improve healthcare accessibility, a rising demand for advanced diagnostic solutions, and increasing collaborations between research institutions and industry players.
- Dominant Application Segment: Medical Treatment, driven by advancements in diagnostics and therapeutics.
- Leading Region (Medical Treatment): North America, with a strong focus on R&D and advanced healthcare infrastructure.
- Dominant Product Type: Near Infrared Fluorescence Imaging Devices, enabling precise molecular visualization.
- Key Drivers in Leading Regions: Healthcare investment, technological adoption, R&D initiatives.
- Market Share (Medical Treatment, 2025): Approximately 45% of the global market.
- Growth Potential: High for fluorescence imaging due to its specialized diagnostic capabilities.
Near Infrared Imaging Product Landscape
The Near Infrared Imaging product landscape is characterized by a dynamic evolution of sophisticated imaging devices and analytical systems. Innovations are focused on enhancing spatial resolution, spectral sensitivity, and miniaturization. Manufacturers are developing integrated solutions that combine hardware and advanced software for real-time data acquisition and analysis. Unique selling propositions often lie in the ability to provide non-invasive, label-free imaging for molecular and functional insights. Technological advancements are enabling deeper tissue penetration and improved signal-to-noise ratios, expanding applications in areas like surgical navigation, burn wound assessment, and brain activity monitoring. The market is seeing the introduction of specialized NIR probes and contrast agents for targeted molecular imaging, further enhancing diagnostic specificity.
Key Drivers, Barriers & Challenges in Near Infrared Imaging
Key Drivers:
- Technological Advancements: Development of higher resolution, more sensitive NIR detectors and imaging systems.
- Growing Demand in Healthcare: Increasing need for non-invasive diagnostics, surgical guidance, and molecular imaging.
- Industrial Applications: Expanding use in food quality control, chemical analysis, and pharmaceutical research.
- Government Initiatives: Funding for R&D and favorable policies for advanced imaging technologies.
Key Barriers & Challenges:
- High Cost of Advanced Systems: Initial investment in sophisticated NIR imaging equipment can be substantial.
- Regulatory Hurdles: Stringent approval processes, especially for medical devices, can delay market entry.
- Lack of Standardization: Variability in imaging protocols and data interpretation can impact comparability.
- Skilled Workforce Requirement: Operation and data analysis often require specialized training.
- Supply Chain Disruptions: Potential for disruptions in the availability of key components, impacting production timelines. The impact of supply chain issues is estimated to cause delays of up to 15% in product delivery.
Emerging Opportunities in Near Infrared Imaging
Emerging opportunities in the Near Infrared Imaging sector lie in the burgeoning field of personalized medicine, where NIR imaging can play a pivotal role in tailoring treatments based on individual patient molecular profiles. The development of low-cost, portable NIR devices for point-of-care diagnostics in remote or underserved areas presents a significant untapped market. Furthermore, the integration of advanced machine learning algorithms for predictive diagnostics and treatment outcome analysis is a rapidly evolving area. The application of NIR imaging in the agri-food sector for detecting pathogens and assessing the nutritional value of produce in real-time also offers substantial growth potential. The exploration of novel NIR fluorophores with enhanced photostability and excitation properties will further unlock new diagnostic and research applications.
Growth Accelerators in the Near Infrared Imaging Industry
Growth in the Near Infrared Imaging industry is being significantly accelerated by continuous technological breakthroughs, particularly in detector technology and computational imaging. The strategic partnerships between research institutions and leading industry players are fostering innovation and expediting the translation of scientific discoveries into marketable products. Market expansion strategies, including penetration into emerging economies and the development of tailored solutions for specific industry needs, are also playing a crucial role. The increasing awareness of the cost-effectiveness of NIR imaging in certain applications, when compared to more invasive or time-consuming alternatives, is further driving its adoption.
Key Players Shaping the Near Infrared Imaging Market
- Bruker
- Hamamatsu Photonics
- Karl Storz Gmbh & Co
- Li-Cor
- Miltenyi Biotec
- MIZUHO
- PerkinElmer
- NOVADAQ Technologies
- Thermo Fisher Scientific
Notable Milestones in Near Infrared Imaging Sector
- 2020: Launch of advanced, high-sensitivity NIR detectors by Hamamatsu Photonics, improving signal detection for low-light applications.
- 2021: PerkinElmer introduces a new line of NIR spectroscopy solutions for enhanced chemical analysis in the pharmaceutical industry.
- 2022: Bruker acquires a specialized NIR imaging company, expanding its portfolio in molecular imaging and diagnostics.
- 2023 (Q2): Karl Storz Gmbh & Co. releases an innovative NIR fluorescence imaging system for minimally invasive surgery, enhancing visualization of tumor margins.
- 2023 (Q4): Miltenyi Biotec launches a novel NIR-based cell sorting technology, revolutionizing cell analysis for research and therapeutic development.
- 2024 (Q1): Li-Cor introduces a new generation of NIR imaging systems with improved speed and resolution for preclinical research.
In-Depth Near Infrared Imaging Market Outlook
The future outlook for the Near Infrared Imaging market is exceptionally promising, driven by a convergence of technological innovation, expanding applications, and increasing market demand. Growth accelerators such as AI integration, development of novel probes, and the expansion into emerging markets will continue to fuel market expansion. Strategic investments in research and development by key players, coupled with a growing understanding of the economic and clinical benefits of NIR imaging, position the market for sustained high growth. The projected market size is expected to reach approximately $16.5 billion by 2033, indicating significant potential for stakeholders.
Near Infrared Imaging Segmentation
-
1. Application
- 1.1. Medical Treatment
- 1.2. Chemical Industry
- 1.3. Food and Drinks
- 1.4. Fuel Research
- 1.5. Other
-
2. Types
- 2.1. Near Infrared Fluorescence Imaging Devices
- 2.2. Near Infrared Fluorescence
Near Infrared Imaging Segmentation By Geography
-
1. North America
- 1.1. United States
- 1.2. Canada
- 1.3. Mexico
-
2. South America
- 2.1. Brazil
- 2.2. Argentina
- 2.3. Rest of South America
-
3. Europe
- 3.1. United Kingdom
- 3.2. Germany
- 3.3. France
- 3.4. Italy
- 3.5. Spain
- 3.6. Russia
- 3.7. Benelux
- 3.8. Nordics
- 3.9. Rest of Europe
-
4. Middle East & Africa
- 4.1. Turkey
- 4.2. Israel
- 4.3. GCC
- 4.4. North Africa
- 4.5. South Africa
- 4.6. Rest of Middle East & Africa
-
5. Asia Pacific
- 5.1. China
- 5.2. India
- 5.3. Japan
- 5.4. South Korea
- 5.5. ASEAN
- 5.6. Oceania
- 5.7. Rest of Asia Pacific
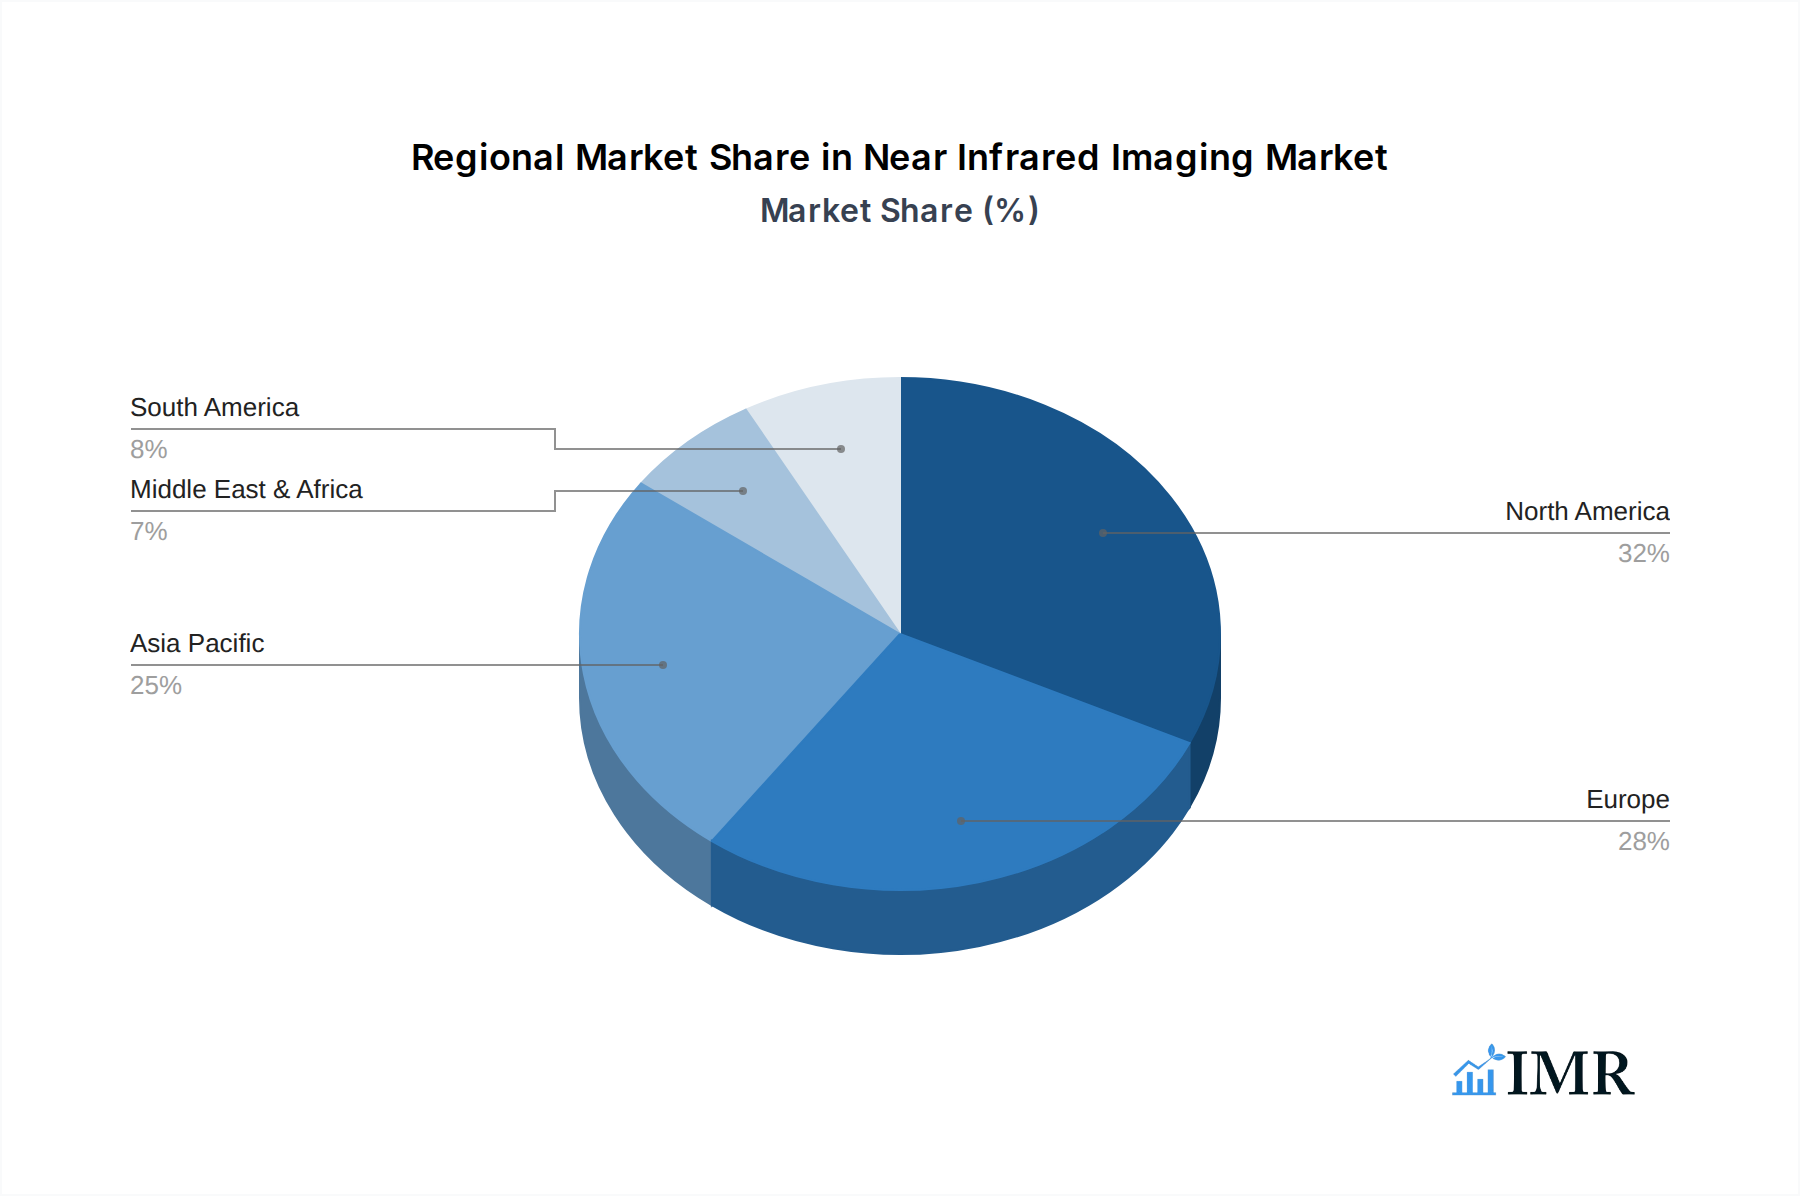
Near Infrared Imaging Regional Market Share
Geographic Coverage of Near Infrared Imaging
Near Infrared Imaging REPORT HIGHLIGHTS
| Aspects | Details |
|---|---|
| Study Period | 2020-2034 |
| Base Year | 2025 |
| Estimated Year | 2026 |
| Forecast Period | 2026-2034 |
| Historical Period | 2020-2025 |
| Growth Rate | CAGR of 10.6% from 2020-2034 |
| Segmentation |
|
Table of Contents
- 1. Introduction
- 1.1. Research Scope
- 1.2. Market Segmentation
- 1.3. Research Objective
- 1.4. Definitions and Assumptions
- 2. Executive Summary
- 2.1. Market Snapshot
- 3. Market Dynamics
- 3.1. Market Drivers
- 3.2. Market Restrains
- 3.3. Market Trends
- 3.4. Market Opportunities
- 4. Market Factor Analysis
- 4.1. Porters Five Forces
- 4.1.1. Bargaining Power of Suppliers
- 4.1.2. Bargaining Power of Buyers
- 4.1.3. Threat of New Entrants
- 4.1.4. Threat of Substitutes
- 4.1.5. Competitive Rivalry
- 4.2. PESTEL analysis
- 4.3. BCG Analysis
- 4.3.1. Stars (High Growth, High Market Share)
- 4.3.2. Cash Cows (Low Growth, High Market Share)
- 4.3.3. Question Mark (High Growth, Low Market Share)
- 4.3.4. Dogs (Low Growth, Low Market Share)
- 4.4. Ansoff Matrix Analysis
- 4.5. Supply Chain Analysis
- 4.6. Regulatory Landscape
- 4.7. Current Market Potential and Opportunity Assessment (TAM–SAM–SOM Framework)
- 4.8. IMR Analyst Note
- 4.1. Porters Five Forces
- 5. Market Analysis, Insights and Forecast 2021-2033
- 5.1. Market Analysis, Insights and Forecast - by Application
- 5.1.1. Medical Treatment
- 5.1.2. Chemical Industry
- 5.1.3. Food and Drinks
- 5.1.4. Fuel Research
- 5.1.5. Other
- 5.2. Market Analysis, Insights and Forecast - by Types
- 5.2.1. Near Infrared Fluorescence Imaging Devices
- 5.2.2. Near Infrared Fluorescence
- 5.3. Market Analysis, Insights and Forecast - by Region
- 5.3.1. North America
- 5.3.2. South America
- 5.3.3. Europe
- 5.3.4. Middle East & Africa
- 5.3.5. Asia Pacific
- 5.1. Market Analysis, Insights and Forecast - by Application
- 6. Global Near Infrared Imaging Analysis, Insights and Forecast, 2021-2033
- 6.1. Market Analysis, Insights and Forecast - by Application
- 6.1.1. Medical Treatment
- 6.1.2. Chemical Industry
- 6.1.3. Food and Drinks
- 6.1.4. Fuel Research
- 6.1.5. Other
- 6.2. Market Analysis, Insights and Forecast - by Types
- 6.2.1. Near Infrared Fluorescence Imaging Devices
- 6.2.2. Near Infrared Fluorescence
- 6.1. Market Analysis, Insights and Forecast - by Application
- 7. North America Near Infrared Imaging Analysis, Insights and Forecast, 2020-2032
- 7.1. Market Analysis, Insights and Forecast - by Application
- 7.1.1. Medical Treatment
- 7.1.2. Chemical Industry
- 7.1.3. Food and Drinks
- 7.1.4. Fuel Research
- 7.1.5. Other
- 7.2. Market Analysis, Insights and Forecast - by Types
- 7.2.1. Near Infrared Fluorescence Imaging Devices
- 7.2.2. Near Infrared Fluorescence
- 7.1. Market Analysis, Insights and Forecast - by Application
- 8. South America Near Infrared Imaging Analysis, Insights and Forecast, 2020-2032
- 8.1. Market Analysis, Insights and Forecast - by Application
- 8.1.1. Medical Treatment
- 8.1.2. Chemical Industry
- 8.1.3. Food and Drinks
- 8.1.4. Fuel Research
- 8.1.5. Other
- 8.2. Market Analysis, Insights and Forecast - by Types
- 8.2.1. Near Infrared Fluorescence Imaging Devices
- 8.2.2. Near Infrared Fluorescence
- 8.1. Market Analysis, Insights and Forecast - by Application
- 9. Europe Near Infrared Imaging Analysis, Insights and Forecast, 2020-2032
- 9.1. Market Analysis, Insights and Forecast - by Application
- 9.1.1. Medical Treatment
- 9.1.2. Chemical Industry
- 9.1.3. Food and Drinks
- 9.1.4. Fuel Research
- 9.1.5. Other
- 9.2. Market Analysis, Insights and Forecast - by Types
- 9.2.1. Near Infrared Fluorescence Imaging Devices
- 9.2.2. Near Infrared Fluorescence
- 9.1. Market Analysis, Insights and Forecast - by Application
- 10. Middle East & Africa Near Infrared Imaging Analysis, Insights and Forecast, 2020-2032
- 10.1. Market Analysis, Insights and Forecast - by Application
- 10.1.1. Medical Treatment
- 10.1.2. Chemical Industry
- 10.1.3. Food and Drinks
- 10.1.4. Fuel Research
- 10.1.5. Other
- 10.2. Market Analysis, Insights and Forecast - by Types
- 10.2.1. Near Infrared Fluorescence Imaging Devices
- 10.2.2. Near Infrared Fluorescence
- 10.1. Market Analysis, Insights and Forecast - by Application
- 11. Asia Pacific Near Infrared Imaging Analysis, Insights and Forecast, 2020-2032
- 11.1. Market Analysis, Insights and Forecast - by Application
- 11.1.1. Medical Treatment
- 11.1.2. Chemical Industry
- 11.1.3. Food and Drinks
- 11.1.4. Fuel Research
- 11.1.5. Other
- 11.2. Market Analysis, Insights and Forecast - by Types
- 11.2.1. Near Infrared Fluorescence Imaging Devices
- 11.2.2. Near Infrared Fluorescence
- 11.1. Market Analysis, Insights and Forecast - by Application
- 12. Competitive Analysis
- 12.1. Company Profiles
- 12.1.1 Bruker
- 12.1.1.1. Company Overview
- 12.1.1.2. Products
- 12.1.1.3. Company Financials
- 12.1.1.4. SWOT Analysis
- 12.1.2 Hamamatsu Photonics
- 12.1.2.1. Company Overview
- 12.1.2.2. Products
- 12.1.2.3. Company Financials
- 12.1.2.4. SWOT Analysis
- 12.1.3 Karl Storz Gmbh & Co
- 12.1.3.1. Company Overview
- 12.1.3.2. Products
- 12.1.3.3. Company Financials
- 12.1.3.4. SWOT Analysis
- 12.1.4 Li-Cor
- 12.1.4.1. Company Overview
- 12.1.4.2. Products
- 12.1.4.3. Company Financials
- 12.1.4.4. SWOT Analysis
- 12.1.5 Miltenyi Biotec
- 12.1.5.1. Company Overview
- 12.1.5.2. Products
- 12.1.5.3. Company Financials
- 12.1.5.4. SWOT Analysis
- 12.1.6 MIZUHO
- 12.1.6.1. Company Overview
- 12.1.6.2. Products
- 12.1.6.3. Company Financials
- 12.1.6.4. SWOT Analysis
- 12.1.7 PerkinElmer
- 12.1.7.1. Company Overview
- 12.1.7.2. Products
- 12.1.7.3. Company Financials
- 12.1.7.4. SWOT Analysis
- 12.1.8 NOVADAQ Technologies
- 12.1.8.1. Company Overview
- 12.1.8.2. Products
- 12.1.8.3. Company Financials
- 12.1.8.4. SWOT Analysis
- 12.1.9 Thermo Fisher Scientific
- 12.1.9.1. Company Overview
- 12.1.9.2. Products
- 12.1.9.3. Company Financials
- 12.1.9.4. SWOT Analysis
- 12.1.1 Bruker
- 12.2. Market Entropy
- 12.2.1 Company's Key Areas Served
- 12.2.2 Recent Developments
- 12.3. Company Market Share Analysis 2025
- 12.3.1 Top 5 Companies Market Share Analysis
- 12.3.2 Top 3 Companies Market Share Analysis
- 12.4. List of Potential Customers
- 13. Research Methodology
List of Figures
- Figure 1: Global Near Infrared Imaging Revenue Breakdown (billion, %) by Region 2025 & 2033
- Figure 2: North America Near Infrared Imaging Revenue (billion), by Application 2025 & 2033
- Figure 3: North America Near Infrared Imaging Revenue Share (%), by Application 2025 & 2033
- Figure 4: North America Near Infrared Imaging Revenue (billion), by Types 2025 & 2033
- Figure 5: North America Near Infrared Imaging Revenue Share (%), by Types 2025 & 2033
- Figure 6: North America Near Infrared Imaging Revenue (billion), by Country 2025 & 2033
- Figure 7: North America Near Infrared Imaging Revenue Share (%), by Country 2025 & 2033
- Figure 8: South America Near Infrared Imaging Revenue (billion), by Application 2025 & 2033
- Figure 9: South America Near Infrared Imaging Revenue Share (%), by Application 2025 & 2033
- Figure 10: South America Near Infrared Imaging Revenue (billion), by Types 2025 & 2033
- Figure 11: South America Near Infrared Imaging Revenue Share (%), by Types 2025 & 2033
- Figure 12: South America Near Infrared Imaging Revenue (billion), by Country 2025 & 2033
- Figure 13: South America Near Infrared Imaging Revenue Share (%), by Country 2025 & 2033
- Figure 14: Europe Near Infrared Imaging Revenue (billion), by Application 2025 & 2033
- Figure 15: Europe Near Infrared Imaging Revenue Share (%), by Application 2025 & 2033
- Figure 16: Europe Near Infrared Imaging Revenue (billion), by Types 2025 & 2033
- Figure 17: Europe Near Infrared Imaging Revenue Share (%), by Types 2025 & 2033
- Figure 18: Europe Near Infrared Imaging Revenue (billion), by Country 2025 & 2033
- Figure 19: Europe Near Infrared Imaging Revenue Share (%), by Country 2025 & 2033
- Figure 20: Middle East & Africa Near Infrared Imaging Revenue (billion), by Application 2025 & 2033
- Figure 21: Middle East & Africa Near Infrared Imaging Revenue Share (%), by Application 2025 & 2033
- Figure 22: Middle East & Africa Near Infrared Imaging Revenue (billion), by Types 2025 & 2033
- Figure 23: Middle East & Africa Near Infrared Imaging Revenue Share (%), by Types 2025 & 2033
- Figure 24: Middle East & Africa Near Infrared Imaging Revenue (billion), by Country 2025 & 2033
- Figure 25: Middle East & Africa Near Infrared Imaging Revenue Share (%), by Country 2025 & 2033
- Figure 26: Asia Pacific Near Infrared Imaging Revenue (billion), by Application 2025 & 2033
- Figure 27: Asia Pacific Near Infrared Imaging Revenue Share (%), by Application 2025 & 2033
- Figure 28: Asia Pacific Near Infrared Imaging Revenue (billion), by Types 2025 & 2033
- Figure 29: Asia Pacific Near Infrared Imaging Revenue Share (%), by Types 2025 & 2033
- Figure 30: Asia Pacific Near Infrared Imaging Revenue (billion), by Country 2025 & 2033
- Figure 31: Asia Pacific Near Infrared Imaging Revenue Share (%), by Country 2025 & 2033
List of Tables
- Table 1: Global Near Infrared Imaging Revenue billion Forecast, by Application 2020 & 2033
- Table 2: Global Near Infrared Imaging Revenue billion Forecast, by Types 2020 & 2033
- Table 3: Global Near Infrared Imaging Revenue billion Forecast, by Region 2020 & 2033
- Table 4: Global Near Infrared Imaging Revenue billion Forecast, by Application 2020 & 2033
- Table 5: Global Near Infrared Imaging Revenue billion Forecast, by Types 2020 & 2033
- Table 6: Global Near Infrared Imaging Revenue billion Forecast, by Country 2020 & 2033
- Table 7: United States Near Infrared Imaging Revenue (billion) Forecast, by Application 2020 & 2033
- Table 8: Canada Near Infrared Imaging Revenue (billion) Forecast, by Application 2020 & 2033
- Table 9: Mexico Near Infrared Imaging Revenue (billion) Forecast, by Application 2020 & 2033
- Table 10: Global Near Infrared Imaging Revenue billion Forecast, by Application 2020 & 2033
- Table 11: Global Near Infrared Imaging Revenue billion Forecast, by Types 2020 & 2033
- Table 12: Global Near Infrared Imaging Revenue billion Forecast, by Country 2020 & 2033
- Table 13: Brazil Near Infrared Imaging Revenue (billion) Forecast, by Application 2020 & 2033
- Table 14: Argentina Near Infrared Imaging Revenue (billion) Forecast, by Application 2020 & 2033
- Table 15: Rest of South America Near Infrared Imaging Revenue (billion) Forecast, by Application 2020 & 2033
- Table 16: Global Near Infrared Imaging Revenue billion Forecast, by Application 2020 & 2033
- Table 17: Global Near Infrared Imaging Revenue billion Forecast, by Types 2020 & 2033
- Table 18: Global Near Infrared Imaging Revenue billion Forecast, by Country 2020 & 2033
- Table 19: United Kingdom Near Infrared Imaging Revenue (billion) Forecast, by Application 2020 & 2033
- Table 20: Germany Near Infrared Imaging Revenue (billion) Forecast, by Application 2020 & 2033
- Table 21: France Near Infrared Imaging Revenue (billion) Forecast, by Application 2020 & 2033
- Table 22: Italy Near Infrared Imaging Revenue (billion) Forecast, by Application 2020 & 2033
- Table 23: Spain Near Infrared Imaging Revenue (billion) Forecast, by Application 2020 & 2033
- Table 24: Russia Near Infrared Imaging Revenue (billion) Forecast, by Application 2020 & 2033
- Table 25: Benelux Near Infrared Imaging Revenue (billion) Forecast, by Application 2020 & 2033
- Table 26: Nordics Near Infrared Imaging Revenue (billion) Forecast, by Application 2020 & 2033
- Table 27: Rest of Europe Near Infrared Imaging Revenue (billion) Forecast, by Application 2020 & 2033
- Table 28: Global Near Infrared Imaging Revenue billion Forecast, by Application 2020 & 2033
- Table 29: Global Near Infrared Imaging Revenue billion Forecast, by Types 2020 & 2033
- Table 30: Global Near Infrared Imaging Revenue billion Forecast, by Country 2020 & 2033
- Table 31: Turkey Near Infrared Imaging Revenue (billion) Forecast, by Application 2020 & 2033
- Table 32: Israel Near Infrared Imaging Revenue (billion) Forecast, by Application 2020 & 2033
- Table 33: GCC Near Infrared Imaging Revenue (billion) Forecast, by Application 2020 & 2033
- Table 34: North Africa Near Infrared Imaging Revenue (billion) Forecast, by Application 2020 & 2033
- Table 35: South Africa Near Infrared Imaging Revenue (billion) Forecast, by Application 2020 & 2033
- Table 36: Rest of Middle East & Africa Near Infrared Imaging Revenue (billion) Forecast, by Application 2020 & 2033
- Table 37: Global Near Infrared Imaging Revenue billion Forecast, by Application 2020 & 2033
- Table 38: Global Near Infrared Imaging Revenue billion Forecast, by Types 2020 & 2033
- Table 39: Global Near Infrared Imaging Revenue billion Forecast, by Country 2020 & 2033
- Table 40: China Near Infrared Imaging Revenue (billion) Forecast, by Application 2020 & 2033
- Table 41: India Near Infrared Imaging Revenue (billion) Forecast, by Application 2020 & 2033
- Table 42: Japan Near Infrared Imaging Revenue (billion) Forecast, by Application 2020 & 2033
- Table 43: South Korea Near Infrared Imaging Revenue (billion) Forecast, by Application 2020 & 2033
- Table 44: ASEAN Near Infrared Imaging Revenue (billion) Forecast, by Application 2020 & 2033
- Table 45: Oceania Near Infrared Imaging Revenue (billion) Forecast, by Application 2020 & 2033
- Table 46: Rest of Asia Pacific Near Infrared Imaging Revenue (billion) Forecast, by Application 2020 & 2033
Frequently Asked Questions
1. What is the projected Compound Annual Growth Rate (CAGR) of the Near Infrared Imaging?
The projected CAGR is approximately 10.6%.
2. Which companies are prominent players in the Near Infrared Imaging?
Key companies in the market include Bruker, Hamamatsu Photonics, Karl Storz Gmbh & Co, Li-Cor, Miltenyi Biotec, MIZUHO, PerkinElmer, NOVADAQ Technologies, Thermo Fisher Scientific.
3. What are the main segments of the Near Infrared Imaging?
The market segments include Application, Types.
4. Can you provide details about the market size?
The market size is estimated to be USD 1.25 billion as of 2022.
5. What are some drivers contributing to market growth?
N/A
6. What are the notable trends driving market growth?
N/A
7. Are there any restraints impacting market growth?
N/A
8. Can you provide examples of recent developments in the market?
N/A
9. What pricing options are available for accessing the report?
Pricing options include single-user, multi-user, and enterprise licenses priced at USD 2900.00, USD 4350.00, and USD 5800.00 respectively.
10. Is the market size provided in terms of value or volume?
The market size is provided in terms of value, measured in billion.
11. Are there any specific market keywords associated with the report?
Yes, the market keyword associated with the report is "Near Infrared Imaging," which aids in identifying and referencing the specific market segment covered.
12. How do I determine which pricing option suits my needs best?
The pricing options vary based on user requirements and access needs. Individual users may opt for single-user licenses, while businesses requiring broader access may choose multi-user or enterprise licenses for cost-effective access to the report.
13. Are there any additional resources or data provided in the Near Infrared Imaging report?
While the report offers comprehensive insights, it's advisable to review the specific contents or supplementary materials provided to ascertain if additional resources or data are available.
14. How can I stay updated on further developments or reports in the Near Infrared Imaging?
To stay informed about further developments, trends, and reports in the Near Infrared Imaging, consider subscribing to industry newsletters, following relevant companies and organizations, or regularly checking reputable industry news sources and publications.
Methodology
Step 1 - Identification of Relevant Samples Size from Population Database


Step 2 - Approaches for Defining Global Market Size (Value, Volume* & Price*)

Note*: In applicable scenarios
Step 3 - Data Sources
Primary Research
- Web Analytics
- Survey Reports
- Research Institute
- Latest Research Reports
- Opinion Leaders
Secondary Research
- Annual Reports
- White Paper
- Latest Press Release
- Industry Association
- Paid Database
- Investor Presentations

Step 4 - Data Triangulation
Involves using different sources of information in order to increase the validity of a study
These sources are likely to be stakeholders in a program - participants, other researchers, program staff, other community members, and so on.
Then we put all data in single framework & apply various statistical tools to find out the dynamic on the market.
During the analysis stage, feedback from the stakeholder groups would be compared to determine areas of agreement as well as areas of divergence