

Key Insights
The Netherlands payments market is projected to exhibit a robust Compound Annual Growth Rate (CAGR) of 5.09% between 2025 and 2033. The market size was estimated at €1.47 billion in the base year 2025. This growth is propelled by the escalating adoption of e-commerce and digital wallets, alongside significant innovation in payment technologies such as contactless and mobile payments. A strong financial infrastructure and high digital literacy further bolster this expansion. Key contributing sectors include retail, entertainment, and healthcare. Emerging challenges involve regulatory shifts and digital transaction security concerns. The competitive landscape is dynamic, featuring global leaders like Visa and Mastercard alongside local innovators.
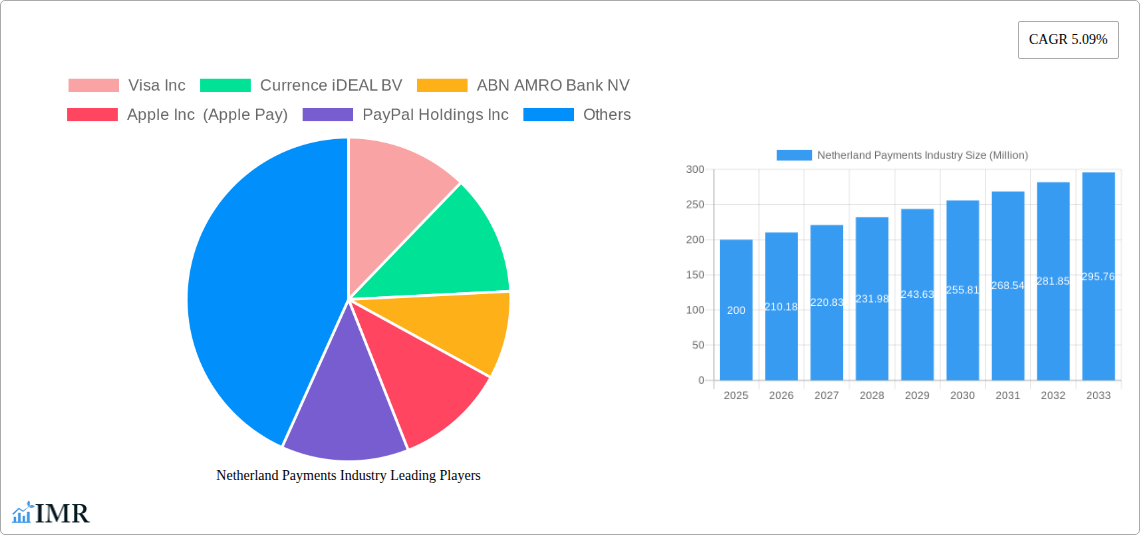
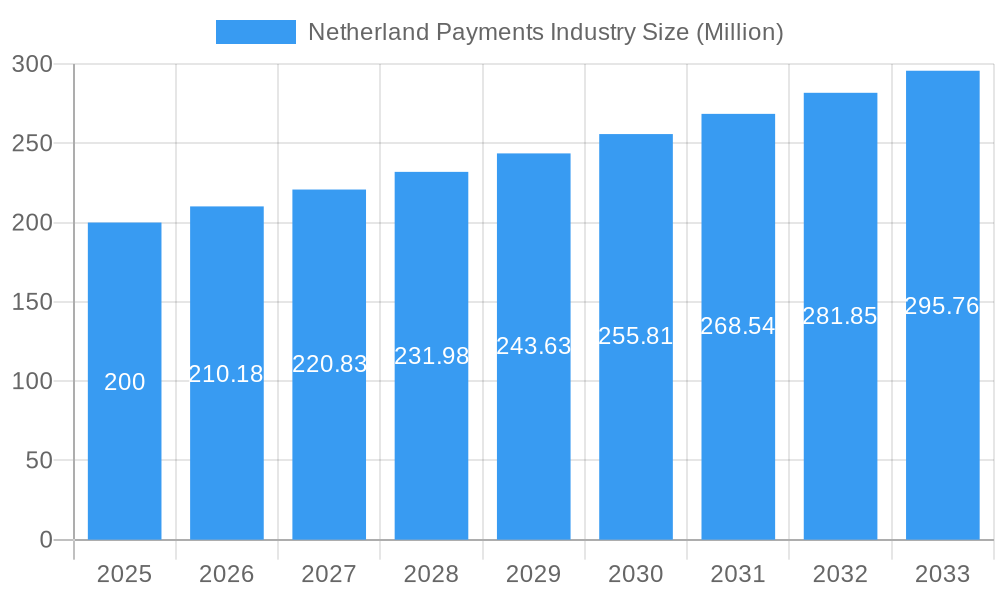
Netherland Payments Industry Market Size (In Billion)
Market segmentation reveals a shift towards online sales, complementing established Point-of-Sale (POS) transactions. Retail continues to be a dominant sector, with entertainment and healthcare experiencing accelerated digitalization. Intense competition from established payment networks, fintech startups, and mobile payment providers drives continuous innovation, enhancing consumer payment solutions. Future market trajectory will be significantly shaped by evolving financial regulations.
Netherland Payments Industry Company Market Share
Netherland Payments Industry: Market Report 2019-2033
This comprehensive report provides an in-depth analysis of the Netherland payments industry, covering market dynamics, growth trends, key players, and future outlook. With a focus on the period 2019-2033 (Base Year: 2025), this report is essential for industry professionals, investors, and strategic planners seeking to understand and capitalize on opportunities within this dynamic market. The report segments the market by Mode of Payment (Point of Sale, Online Sale) and End-user Industry (Retail, Entertainment, Healthcare, Hospitality, Others), offering granular insights into each segment's performance and potential. Key players like Visa Inc, Currence iDEAL BV, ABN AMRO Bank NV, and Adyen are analyzed, providing a competitive landscape assessment.
Netherland Payments Industry Market Dynamics & Structure
The Netherland payments industry is characterized by a moderately concentrated market with significant competition among established players and emerging fintechs. Technological innovation, particularly in mobile payments and open banking, is a key driver. The regulatory framework, while evolving, generally supports innovation. However, data privacy regulations and security concerns pose challenges. The rise of digital wallets and online payments is steadily replacing traditional methods, impacting the Point of Sale segment's growth.
- Market Concentration: The market is moderately concentrated, with a few major players holding significant market share (estimated at xx%). However, the emergence of fintech companies is increasing competition.
- Technological Innovation: Mobile payments (Apple Pay, Google Pay) and open banking are key innovation drivers, enhancing customer experience and operational efficiency. The adoption of real-time payments is also accelerating.
- Regulatory Framework: The Netherlands maintains a relatively favorable regulatory environment encouraging innovation while ensuring consumer protection and financial stability. However, compliance costs remain a factor.
- Competitive Product Substitutes: The primary substitutes are alternative payment methods such as cryptocurrencies, which are gaining limited traction. Competition is primarily between established players and emerging fintechs.
- End-User Demographics: The Netherlands has a high level of digital literacy and smartphone penetration, driving the adoption of digital payment methods across all age groups. Specific age group adoption rates are to be further investigated.
- M&A Trends: The industry has witnessed several mergers and acquisitions (M&A) activities in recent years, primarily driven by the need for expansion and technological advancements. An estimated xx M&A deals were concluded in the past 5 years.
Netherland Payments Industry Growth Trends & Insights
The Netherland payments market experienced significant growth during the historical period (2019-2024). The market size in 2024 is estimated at xx Million, exhibiting a CAGR of xx% during this period. Driven by increased e-commerce adoption, mobile payment penetration, and the shift towards cashless transactions, this trend is projected to continue. The forecast period (2025-2033) anticipates a CAGR of xx%, with the market size reaching xx Million by 2033. The growing adoption of digital payment technologies is further enhanced by the increasing use of mobile wallets and the expansion of online shopping. Consumer behavior is shifting towards convenience and security, favoring contactless and mobile payment options. Technological disruptions, such as the rise of open banking and embedded finance solutions, further accelerate this shift.
Dominant Regions, Countries, or Segments in Netherland Payments Industry
The Netherlands' payments market is relatively homogenous with no significant regional variations in growth. However, the Online Sale segment (within "By Mode of Payment") is the fastest-growing, fueled by the rapid expansion of e-commerce. Within "By End-user Industry," the Retail segment dominates due to its substantial contribution to overall transactions.
- By Mode of Payment:
- Online Sale: This segment exhibits the highest growth rate due to the increasing popularity of online shopping.
- Point of Sale: This segment maintains a large market share but is experiencing slower growth compared to online sales.
- By End-user Industry:
- Retail: This sector accounts for the largest share of transactions due to high consumer spending and widespread adoption of digital payments.
- Other End-user Industries: Growth in these sectors is driven by expanding digitalization in diverse industries.
Netherland Payments Industry Product Landscape
The Netherland payments landscape is characterized by a diverse range of products, including traditional cards (Visa, Mastercard, American Express), digital wallets (Apple Pay, Google Pay), online payment gateways (PayPal, Adyen), and innovative solutions like open banking platforms. These products cater to various user needs and preferences, driving competition and innovation. Key features driving adoption are security, convenience, and ease of use. Technological advancements are focused on enhancing security (biometrics, fraud detection), improving user experience, and integrating with other financial services.
Key Drivers, Barriers & Challenges in Netherland Payments Industry
Key Drivers: The increasing adoption of e-commerce, government initiatives promoting digitalization, and growing consumer preference for contactless and mobile payments are key drivers. Technological advancements like open banking and improved security features further boost market growth.
Key Challenges: Competition from emerging fintechs, regulatory uncertainty, concerns about data security and fraud, and the need for continuous investment in technology are major challenges. The high cost of compliance with regulations can also hinder growth. The potential impact of these challenges is estimated to negatively affect the industry's growth by xx% in the next 5 years.
Emerging Opportunities in Netherland Payments Industry
Untapped opportunities lie in expanding the reach of financial inclusion by providing access to digital payment services to underserved populations, focusing on innovative solutions like Buy Now, Pay Later (BNPL) services, and leveraging open banking to offer personalized financial products and services. The increasing popularity of embedded finance is also a significant opportunity.
Growth Accelerators in the Netherland Payments Industry
Technological breakthroughs in areas such as artificial intelligence (AI) and blockchain technology can significantly enhance security and efficiency. Strategic partnerships between banks, fintech companies, and retailers can further drive market expansion. Government initiatives promoting a cashless society will also boost growth.
Key Players Shaping the Netherland Payments Industry Market
- Visa Inc
- Currence iDEAL BV
- ABN AMRO Bank NV
- Apple Inc (Apple Pay)
- PayPal Holdings Inc
- Google LLC (Google Pay)
- American Express Company
- Mastercard Inc
- De Volksbank
- Adyen
Notable Milestones in Netherland Payments Industry Sector
- March 2022: Visa announced the acquisition of Tink, strengthening its open banking capabilities.
- May 2022: Klarna launched its Virtual Shopping offering, enhancing the online shopping experience.
- May 2022: DECTA partnered with Zimpler, enabling A2A payments across Europe, including the Netherlands.
- May 2022: BigCommerce named Mollie as its Preferred Technology Partner, boosting Mollie's presence in the Netherlands.
In-Depth Netherland Payments Industry Market Outlook
The future of the Netherland payments industry is bright, driven by continuous technological innovation, increasing digital adoption, and supportive regulatory frameworks. Strategic partnerships and investments in cybersecurity will be crucial for long-term growth. The market's potential for expansion lies in untapped segments, such as the further adoption of BNPL services and embedded finance, as well as the optimization of existing technologies to better cater to various needs. This market outlook predicts significant growth in the coming years, offering substantial opportunities for existing and new market entrants.
Netherland Payments Industry Segmentation
-
1. Mode of Payment
-
1.1. Point of Sale
- 1.1.1. Card Pay
- 1.1.2. Digital Wallet (includes Mobile Wallets)
- 1.1.3. Cash
- 1.1.4. Other Points of Sale
-
1.2. Online Sale
- 1.2.1. Other
-
1.1. Point of Sale
-
2. End-user Industry
- 2.1. Retail
- 2.2. Entertainment
- 2.3. Healthcare
- 2.4. Hospitality
- 2.5. Other End-user Industries
Netherland Payments Industry Segmentation By Geography
-
1. North America
- 1.1. United States
- 1.2. Canada
- 1.3. Mexico
-
2. South America
- 2.1. Brazil
- 2.2. Argentina
- 2.3. Rest of South America
-
3. Europe
- 3.1. United Kingdom
- 3.2. Germany
- 3.3. France
- 3.4. Italy
- 3.5. Spain
- 3.6. Russia
- 3.7. Benelux
- 3.8. Nordics
- 3.9. Rest of Europe
-
4. Middle East & Africa
- 4.1. Turkey
- 4.2. Israel
- 4.3. GCC
- 4.4. North Africa
- 4.5. South Africa
- 4.6. Rest of Middle East & Africa
-
5. Asia Pacific
- 5.1. China
- 5.2. India
- 5.3. Japan
- 5.4. South Korea
- 5.5. ASEAN
- 5.6. Oceania
- 5.7. Rest of Asia Pacific
Netherland Payments Industry Regional Market Share
Geographic Coverage of Netherland Payments Industry
Netherland Payments Industry REPORT HIGHLIGHTS
| Aspects | Details |
|---|---|
| Study Period | 2020-2034 |
| Base Year | 2025 |
| Estimated Year | 2026 |
| Forecast Period | 2026-2034 |
| Historical Period | 2020-2025 |
| Growth Rate | CAGR of 5.09% from 2020-2034 |
| Segmentation |
|
Table of Contents
- 1. Introduction
- 1.1. Research Scope
- 1.2. Market Segmentation
- 1.3. Research Objective
- 1.4. Definitions and Assumptions
- 2. Executive Summary
- 2.1. Market Snapshot
- 3. Market Dynamics
- 3.1. Market Drivers
- 3.2. Market Restrains
- 3.3. Market Trends
- 3.4. Market Opportunities
- 4. Market Factor Analysis
- 4.1. Porters Five Forces
- 4.1.1. Bargaining Power of Suppliers
- 4.1.2. Bargaining Power of Buyers
- 4.1.3. Threat of New Entrants
- 4.1.4. Threat of Substitutes
- 4.1.5. Competitive Rivalry
- 4.2. PESTEL analysis
- 4.3. BCG Analysis
- 4.3.1. Stars (High Growth, High Market Share)
- 4.3.2. Cash Cows (Low Growth, High Market Share)
- 4.3.3. Question Mark (High Growth, Low Market Share)
- 4.3.4. Dogs (Low Growth, Low Market Share)
- 4.4. Ansoff Matrix Analysis
- 4.5. Supply Chain Analysis
- 4.6. Regulatory Landscape
- 4.7. Current Market Potential and Opportunity Assessment (TAM–SAM–SOM Framework)
- 4.8. IMR Analyst Note
- 4.1. Porters Five Forces
- 5. Market Analysis, Insights and Forecast 2021-2033
- 5.1. Market Analysis, Insights and Forecast - by Mode of Payment
- 5.1.1. Point of Sale
- 5.1.1.1. Card Pay
- 5.1.1.2. Digital Wallet (includes Mobile Wallets)
- 5.1.1.3. Cash
- 5.1.1.4. Other Points of Sale
- 5.1.2. Online Sale
- 5.1.2.1. Other
- 5.1.1. Point of Sale
- 5.2. Market Analysis, Insights and Forecast - by End-user Industry
- 5.2.1. Retail
- 5.2.2. Entertainment
- 5.2.3. Healthcare
- 5.2.4. Hospitality
- 5.2.5. Other End-user Industries
- 5.3. Market Analysis, Insights and Forecast - by Region
- 5.3.1. North America
- 5.3.2. South America
- 5.3.3. Europe
- 5.3.4. Middle East & Africa
- 5.3.5. Asia Pacific
- 5.1. Market Analysis, Insights and Forecast - by Mode of Payment
- 6. Global Netherland Payments Industry Analysis, Insights and Forecast, 2021-2033
- 6.1. Market Analysis, Insights and Forecast - by Mode of Payment
- 6.1.1. Point of Sale
- 6.1.1.1. Card Pay
- 6.1.1.2. Digital Wallet (includes Mobile Wallets)
- 6.1.1.3. Cash
- 6.1.1.4. Other Points of Sale
- 6.1.2. Online Sale
- 6.1.2.1. Other
- 6.1.1. Point of Sale
- 6.2. Market Analysis, Insights and Forecast - by End-user Industry
- 6.2.1. Retail
- 6.2.2. Entertainment
- 6.2.3. Healthcare
- 6.2.4. Hospitality
- 6.2.5. Other End-user Industries
- 6.1. Market Analysis, Insights and Forecast - by Mode of Payment
- 7. North America Netherland Payments Industry Analysis, Insights and Forecast, 2020-2032
- 7.1. Market Analysis, Insights and Forecast - by Mode of Payment
- 7.1.1. Point of Sale
- 7.1.1.1. Card Pay
- 7.1.1.2. Digital Wallet (includes Mobile Wallets)
- 7.1.1.3. Cash
- 7.1.1.4. Other Points of Sale
- 7.1.2. Online Sale
- 7.1.2.1. Other
- 7.1.1. Point of Sale
- 7.2. Market Analysis, Insights and Forecast - by End-user Industry
- 7.2.1. Retail
- 7.2.2. Entertainment
- 7.2.3. Healthcare
- 7.2.4. Hospitality
- 7.2.5. Other End-user Industries
- 7.1. Market Analysis, Insights and Forecast - by Mode of Payment
- 8. South America Netherland Payments Industry Analysis, Insights and Forecast, 2020-2032
- 8.1. Market Analysis, Insights and Forecast - by Mode of Payment
- 8.1.1. Point of Sale
- 8.1.1.1. Card Pay
- 8.1.1.2. Digital Wallet (includes Mobile Wallets)
- 8.1.1.3. Cash
- 8.1.1.4. Other Points of Sale
- 8.1.2. Online Sale
- 8.1.2.1. Other
- 8.1.1. Point of Sale
- 8.2. Market Analysis, Insights and Forecast - by End-user Industry
- 8.2.1. Retail
- 8.2.2. Entertainment
- 8.2.3. Healthcare
- 8.2.4. Hospitality
- 8.2.5. Other End-user Industries
- 8.1. Market Analysis, Insights and Forecast - by Mode of Payment
- 9. Europe Netherland Payments Industry Analysis, Insights and Forecast, 2020-2032
- 9.1. Market Analysis, Insights and Forecast - by Mode of Payment
- 9.1.1. Point of Sale
- 9.1.1.1. Card Pay
- 9.1.1.2. Digital Wallet (includes Mobile Wallets)
- 9.1.1.3. Cash
- 9.1.1.4. Other Points of Sale
- 9.1.2. Online Sale
- 9.1.2.1. Other
- 9.1.1. Point of Sale
- 9.2. Market Analysis, Insights and Forecast - by End-user Industry
- 9.2.1. Retail
- 9.2.2. Entertainment
- 9.2.3. Healthcare
- 9.2.4. Hospitality
- 9.2.5. Other End-user Industries
- 9.1. Market Analysis, Insights and Forecast - by Mode of Payment
- 10. Middle East & Africa Netherland Payments Industry Analysis, Insights and Forecast, 2020-2032
- 10.1. Market Analysis, Insights and Forecast - by Mode of Payment
- 10.1.1. Point of Sale
- 10.1.1.1. Card Pay
- 10.1.1.2. Digital Wallet (includes Mobile Wallets)
- 10.1.1.3. Cash
- 10.1.1.4. Other Points of Sale
- 10.1.2. Online Sale
- 10.1.2.1. Other
- 10.1.1. Point of Sale
- 10.2. Market Analysis, Insights and Forecast - by End-user Industry
- 10.2.1. Retail
- 10.2.2. Entertainment
- 10.2.3. Healthcare
- 10.2.4. Hospitality
- 10.2.5. Other End-user Industries
- 10.1. Market Analysis, Insights and Forecast - by Mode of Payment
- 11. Asia Pacific Netherland Payments Industry Analysis, Insights and Forecast, 2020-2032
- 11.1. Market Analysis, Insights and Forecast - by Mode of Payment
- 11.1.1. Point of Sale
- 11.1.1.1. Card Pay
- 11.1.1.2. Digital Wallet (includes Mobile Wallets)
- 11.1.1.3. Cash
- 11.1.1.4. Other Points of Sale
- 11.1.2. Online Sale
- 11.1.2.1. Other
- 11.1.1. Point of Sale
- 11.2. Market Analysis, Insights and Forecast - by End-user Industry
- 11.2.1. Retail
- 11.2.2. Entertainment
- 11.2.3. Healthcare
- 11.2.4. Hospitality
- 11.2.5. Other End-user Industries
- 11.1. Market Analysis, Insights and Forecast - by Mode of Payment
- 12. Competitive Analysis
- 12.1. Company Profiles
- 12.1.1 Visa Inc
- 12.1.1.1. Company Overview
- 12.1.1.2. Products
- 12.1.1.3. Company Financials
- 12.1.1.4. SWOT Analysis
- 12.1.2 Currence iDEAL BV
- 12.1.2.1. Company Overview
- 12.1.2.2. Products
- 12.1.2.3. Company Financials
- 12.1.2.4. SWOT Analysis
- 12.1.3 ABN AMRO Bank NV
- 12.1.3.1. Company Overview
- 12.1.3.2. Products
- 12.1.3.3. Company Financials
- 12.1.3.4. SWOT Analysis
- 12.1.4 Apple Inc (Apple Pay)
- 12.1.4.1. Company Overview
- 12.1.4.2. Products
- 12.1.4.3. Company Financials
- 12.1.4.4. SWOT Analysis
- 12.1.5 PayPal Holdings Inc
- 12.1.5.1. Company Overview
- 12.1.5.2. Products
- 12.1.5.3. Company Financials
- 12.1.5.4. SWOT Analysis
- 12.1.6 Google LLC (Google Pay)
- 12.1.6.1. Company Overview
- 12.1.6.2. Products
- 12.1.6.3. Company Financials
- 12.1.6.4. SWOT Analysis
- 12.1.7 American Express Company
- 12.1.7.1. Company Overview
- 12.1.7.2. Products
- 12.1.7.3. Company Financials
- 12.1.7.4. SWOT Analysis
- 12.1.8 Mastercard Inc
- 12.1.8.1. Company Overview
- 12.1.8.2. Products
- 12.1.8.3. Company Financials
- 12.1.8.4. SWOT Analysis
- 12.1.9 De Volksbank
- 12.1.9.1. Company Overview
- 12.1.9.2. Products
- 12.1.9.3. Company Financials
- 12.1.9.4. SWOT Analysis
- 12.1.10 Adyen
- 12.1.10.1. Company Overview
- 12.1.10.2. Products
- 12.1.10.3. Company Financials
- 12.1.10.4. SWOT Analysis
- 12.1.1 Visa Inc
- 12.2. Market Entropy
- 12.2.1 Company's Key Areas Served
- 12.2.2 Recent Developments
- 12.3. Company Market Share Analysis 2025
- 12.3.1 Top 5 Companies Market Share Analysis
- 12.3.2 Top 3 Companies Market Share Analysis
- 12.4. List of Potential Customers
- 13. Research Methodology
List of Figures
- Figure 1: Global Netherland Payments Industry Revenue Breakdown (billion, %) by Region 2025 & 2033
- Figure 2: North America Netherland Payments Industry Revenue (billion), by Mode of Payment 2025 & 2033
- Figure 3: North America Netherland Payments Industry Revenue Share (%), by Mode of Payment 2025 & 2033
- Figure 4: North America Netherland Payments Industry Revenue (billion), by End-user Industry 2025 & 2033
- Figure 5: North America Netherland Payments Industry Revenue Share (%), by End-user Industry 2025 & 2033
- Figure 6: North America Netherland Payments Industry Revenue (billion), by Country 2025 & 2033
- Figure 7: North America Netherland Payments Industry Revenue Share (%), by Country 2025 & 2033
- Figure 8: South America Netherland Payments Industry Revenue (billion), by Mode of Payment 2025 & 2033
- Figure 9: South America Netherland Payments Industry Revenue Share (%), by Mode of Payment 2025 & 2033
- Figure 10: South America Netherland Payments Industry Revenue (billion), by End-user Industry 2025 & 2033
- Figure 11: South America Netherland Payments Industry Revenue Share (%), by End-user Industry 2025 & 2033
- Figure 12: South America Netherland Payments Industry Revenue (billion), by Country 2025 & 2033
- Figure 13: South America Netherland Payments Industry Revenue Share (%), by Country 2025 & 2033
- Figure 14: Europe Netherland Payments Industry Revenue (billion), by Mode of Payment 2025 & 2033
- Figure 15: Europe Netherland Payments Industry Revenue Share (%), by Mode of Payment 2025 & 2033
- Figure 16: Europe Netherland Payments Industry Revenue (billion), by End-user Industry 2025 & 2033
- Figure 17: Europe Netherland Payments Industry Revenue Share (%), by End-user Industry 2025 & 2033
- Figure 18: Europe Netherland Payments Industry Revenue (billion), by Country 2025 & 2033
- Figure 19: Europe Netherland Payments Industry Revenue Share (%), by Country 2025 & 2033
- Figure 20: Middle East & Africa Netherland Payments Industry Revenue (billion), by Mode of Payment 2025 & 2033
- Figure 21: Middle East & Africa Netherland Payments Industry Revenue Share (%), by Mode of Payment 2025 & 2033
- Figure 22: Middle East & Africa Netherland Payments Industry Revenue (billion), by End-user Industry 2025 & 2033
- Figure 23: Middle East & Africa Netherland Payments Industry Revenue Share (%), by End-user Industry 2025 & 2033
- Figure 24: Middle East & Africa Netherland Payments Industry Revenue (billion), by Country 2025 & 2033
- Figure 25: Middle East & Africa Netherland Payments Industry Revenue Share (%), by Country 2025 & 2033
- Figure 26: Asia Pacific Netherland Payments Industry Revenue (billion), by Mode of Payment 2025 & 2033
- Figure 27: Asia Pacific Netherland Payments Industry Revenue Share (%), by Mode of Payment 2025 & 2033
- Figure 28: Asia Pacific Netherland Payments Industry Revenue (billion), by End-user Industry 2025 & 2033
- Figure 29: Asia Pacific Netherland Payments Industry Revenue Share (%), by End-user Industry 2025 & 2033
- Figure 30: Asia Pacific Netherland Payments Industry Revenue (billion), by Country 2025 & 2033
- Figure 31: Asia Pacific Netherland Payments Industry Revenue Share (%), by Country 2025 & 2033
List of Tables
- Table 1: Global Netherland Payments Industry Revenue billion Forecast, by Mode of Payment 2020 & 2033
- Table 2: Global Netherland Payments Industry Revenue billion Forecast, by End-user Industry 2020 & 2033
- Table 3: Global Netherland Payments Industry Revenue billion Forecast, by Region 2020 & 2033
- Table 4: Global Netherland Payments Industry Revenue billion Forecast, by Mode of Payment 2020 & 2033
- Table 5: Global Netherland Payments Industry Revenue billion Forecast, by End-user Industry 2020 & 2033
- Table 6: Global Netherland Payments Industry Revenue billion Forecast, by Country 2020 & 2033
- Table 7: United States Netherland Payments Industry Revenue (billion) Forecast, by Application 2020 & 2033
- Table 8: Canada Netherland Payments Industry Revenue (billion) Forecast, by Application 2020 & 2033
- Table 9: Mexico Netherland Payments Industry Revenue (billion) Forecast, by Application 2020 & 2033
- Table 10: Global Netherland Payments Industry Revenue billion Forecast, by Mode of Payment 2020 & 2033
- Table 11: Global Netherland Payments Industry Revenue billion Forecast, by End-user Industry 2020 & 2033
- Table 12: Global Netherland Payments Industry Revenue billion Forecast, by Country 2020 & 2033
- Table 13: Brazil Netherland Payments Industry Revenue (billion) Forecast, by Application 2020 & 2033
- Table 14: Argentina Netherland Payments Industry Revenue (billion) Forecast, by Application 2020 & 2033
- Table 15: Rest of South America Netherland Payments Industry Revenue (billion) Forecast, by Application 2020 & 2033
- Table 16: Global Netherland Payments Industry Revenue billion Forecast, by Mode of Payment 2020 & 2033
- Table 17: Global Netherland Payments Industry Revenue billion Forecast, by End-user Industry 2020 & 2033
- Table 18: Global Netherland Payments Industry Revenue billion Forecast, by Country 2020 & 2033
- Table 19: United Kingdom Netherland Payments Industry Revenue (billion) Forecast, by Application 2020 & 2033
- Table 20: Germany Netherland Payments Industry Revenue (billion) Forecast, by Application 2020 & 2033
- Table 21: France Netherland Payments Industry Revenue (billion) Forecast, by Application 2020 & 2033
- Table 22: Italy Netherland Payments Industry Revenue (billion) Forecast, by Application 2020 & 2033
- Table 23: Spain Netherland Payments Industry Revenue (billion) Forecast, by Application 2020 & 2033
- Table 24: Russia Netherland Payments Industry Revenue (billion) Forecast, by Application 2020 & 2033
- Table 25: Benelux Netherland Payments Industry Revenue (billion) Forecast, by Application 2020 & 2033
- Table 26: Nordics Netherland Payments Industry Revenue (billion) Forecast, by Application 2020 & 2033
- Table 27: Rest of Europe Netherland Payments Industry Revenue (billion) Forecast, by Application 2020 & 2033
- Table 28: Global Netherland Payments Industry Revenue billion Forecast, by Mode of Payment 2020 & 2033
- Table 29: Global Netherland Payments Industry Revenue billion Forecast, by End-user Industry 2020 & 2033
- Table 30: Global Netherland Payments Industry Revenue billion Forecast, by Country 2020 & 2033
- Table 31: Turkey Netherland Payments Industry Revenue (billion) Forecast, by Application 2020 & 2033
- Table 32: Israel Netherland Payments Industry Revenue (billion) Forecast, by Application 2020 & 2033
- Table 33: GCC Netherland Payments Industry Revenue (billion) Forecast, by Application 2020 & 2033
- Table 34: North Africa Netherland Payments Industry Revenue (billion) Forecast, by Application 2020 & 2033
- Table 35: South Africa Netherland Payments Industry Revenue (billion) Forecast, by Application 2020 & 2033
- Table 36: Rest of Middle East & Africa Netherland Payments Industry Revenue (billion) Forecast, by Application 2020 & 2033
- Table 37: Global Netherland Payments Industry Revenue billion Forecast, by Mode of Payment 2020 & 2033
- Table 38: Global Netherland Payments Industry Revenue billion Forecast, by End-user Industry 2020 & 2033
- Table 39: Global Netherland Payments Industry Revenue billion Forecast, by Country 2020 & 2033
- Table 40: China Netherland Payments Industry Revenue (billion) Forecast, by Application 2020 & 2033
- Table 41: India Netherland Payments Industry Revenue (billion) Forecast, by Application 2020 & 2033
- Table 42: Japan Netherland Payments Industry Revenue (billion) Forecast, by Application 2020 & 2033
- Table 43: South Korea Netherland Payments Industry Revenue (billion) Forecast, by Application 2020 & 2033
- Table 44: ASEAN Netherland Payments Industry Revenue (billion) Forecast, by Application 2020 & 2033
- Table 45: Oceania Netherland Payments Industry Revenue (billion) Forecast, by Application 2020 & 2033
- Table 46: Rest of Asia Pacific Netherland Payments Industry Revenue (billion) Forecast, by Application 2020 & 2033
Frequently Asked Questions
1. What is the projected Compound Annual Growth Rate (CAGR) of the Netherland Payments Industry?
The projected CAGR is approximately 5.09%.
2. Which companies are prominent players in the Netherland Payments Industry?
Key companies in the market include Visa Inc, Currence iDEAL BV, ABN AMRO Bank NV, Apple Inc (Apple Pay), PayPal Holdings Inc, Google LLC (Google Pay), American Express Company, Mastercard Inc, De Volksbank, Adyen.
3. What are the main segments of the Netherland Payments Industry?
The market segments include Mode of Payment, End-user Industry.
4. Can you provide details about the market size?
The market size is estimated to be USD 1.47 billion as of 2022.
5. What are some drivers contributing to market growth?
Adoption of digital payments; Increasing need to eliminate physical money transactions in order to reduce money-related fraud; Increased use of Smartphones with High-Speed Network Connectivity and Different Digital Payment Platforms.
6. What are the notable trends driving market growth?
Rising users of Digital Payments in Online Sale.
7. Are there any restraints impacting market growth?
High Initial Setup Costs.
8. Can you provide examples of recent developments in the market?
May 2022: Klarna, a leading global retail bank, payments provider, and shopping service provider, announced the launch of its Virtual Shopping offering, which brings the best of in-store shopping to the online experience. Klarna's Virtual Shopping lets customers browse and buy online with confidence by connecting them directly with in-store experts via live chats and video calls to receive product advice and inspiration.
9. What pricing options are available for accessing the report?
Pricing options include single-user, multi-user, and enterprise licenses priced at USD 3800, USD 4500, and USD 5800 respectively.
10. Is the market size provided in terms of value or volume?
The market size is provided in terms of value, measured in billion.
11. Are there any specific market keywords associated with the report?
Yes, the market keyword associated with the report is "Netherland Payments Industry," which aids in identifying and referencing the specific market segment covered.
12. How do I determine which pricing option suits my needs best?
The pricing options vary based on user requirements and access needs. Individual users may opt for single-user licenses, while businesses requiring broader access may choose multi-user or enterprise licenses for cost-effective access to the report.
13. Are there any additional resources or data provided in the Netherland Payments Industry report?
While the report offers comprehensive insights, it's advisable to review the specific contents or supplementary materials provided to ascertain if additional resources or data are available.
14. How can I stay updated on further developments or reports in the Netherland Payments Industry?
To stay informed about further developments, trends, and reports in the Netherland Payments Industry, consider subscribing to industry newsletters, following relevant companies and organizations, or regularly checking reputable industry news sources and publications.
Methodology
Step 1 - Identification of Relevant Samples Size from Population Database


Step 2 - Approaches for Defining Global Market Size (Value, Volume* & Price*)

Note*: In applicable scenarios
Step 3 - Data Sources
Primary Research
- Web Analytics
- Survey Reports
- Research Institute
- Latest Research Reports
- Opinion Leaders
Secondary Research
- Annual Reports
- White Paper
- Latest Press Release
- Industry Association
- Paid Database
- Investor Presentations

Step 4 - Data Triangulation
Involves using different sources of information in order to increase the validity of a study
These sources are likely to be stakeholders in a program - participants, other researchers, program staff, other community members, and so on.
Then we put all data in single framework & apply various statistical tools to find out the dynamic on the market.
During the analysis stage, feedback from the stakeholder groups would be compared to determine areas of agreement as well as areas of divergence