

Key Insights
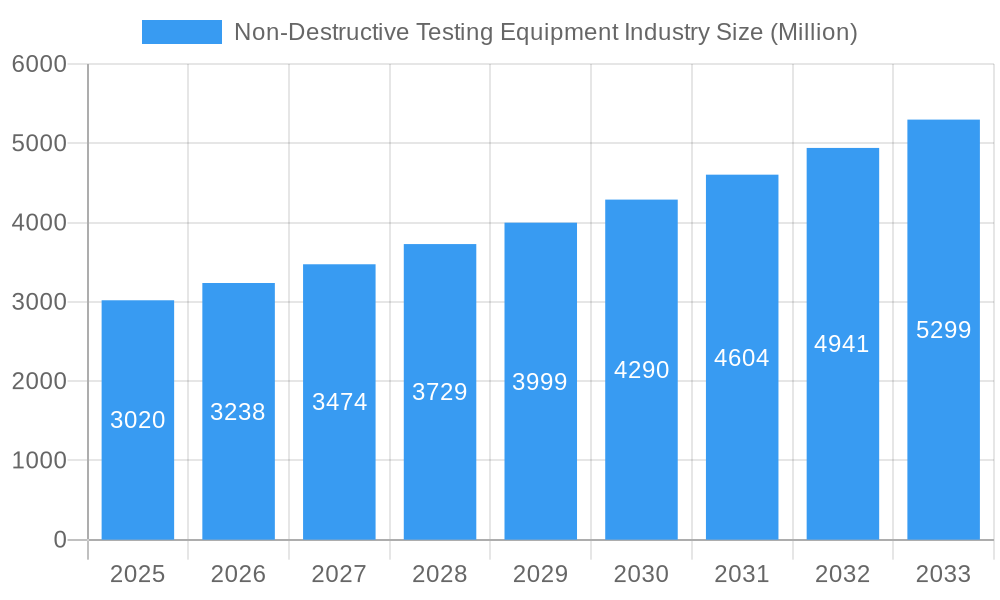
The Non-Destructive Testing (NDT) equipment market, valued at $3.02 billion in 2025, is projected to experience robust growth, driven by the increasing demand for quality control and safety across diverse industries. A compound annual growth rate (CAGR) of 7.20% from 2025 to 2033 indicates a significant expansion, reaching an estimated value exceeding $5 billion by 2033. Key growth drivers include stringent safety regulations across sectors like aerospace and energy, the rising adoption of advanced NDT technologies such as automated ultrasonic testing and digital radiography, and a growing focus on infrastructure development and maintenance globally. The market is segmented by technology (radiography, ultrasonic, magnetic particle, liquid penetrant, visual inspection, eddy current, and others) and end-user industry (oil and gas, power and energy, aerospace and defense, automotive, construction, and others). The oil and gas sector, owing to its inherent safety-critical operations and regulatory mandates, is currently a major market segment, while the growth of renewable energy and electric vehicles is expected to fuel demand in the power and energy, and automotive sectors, respectively.
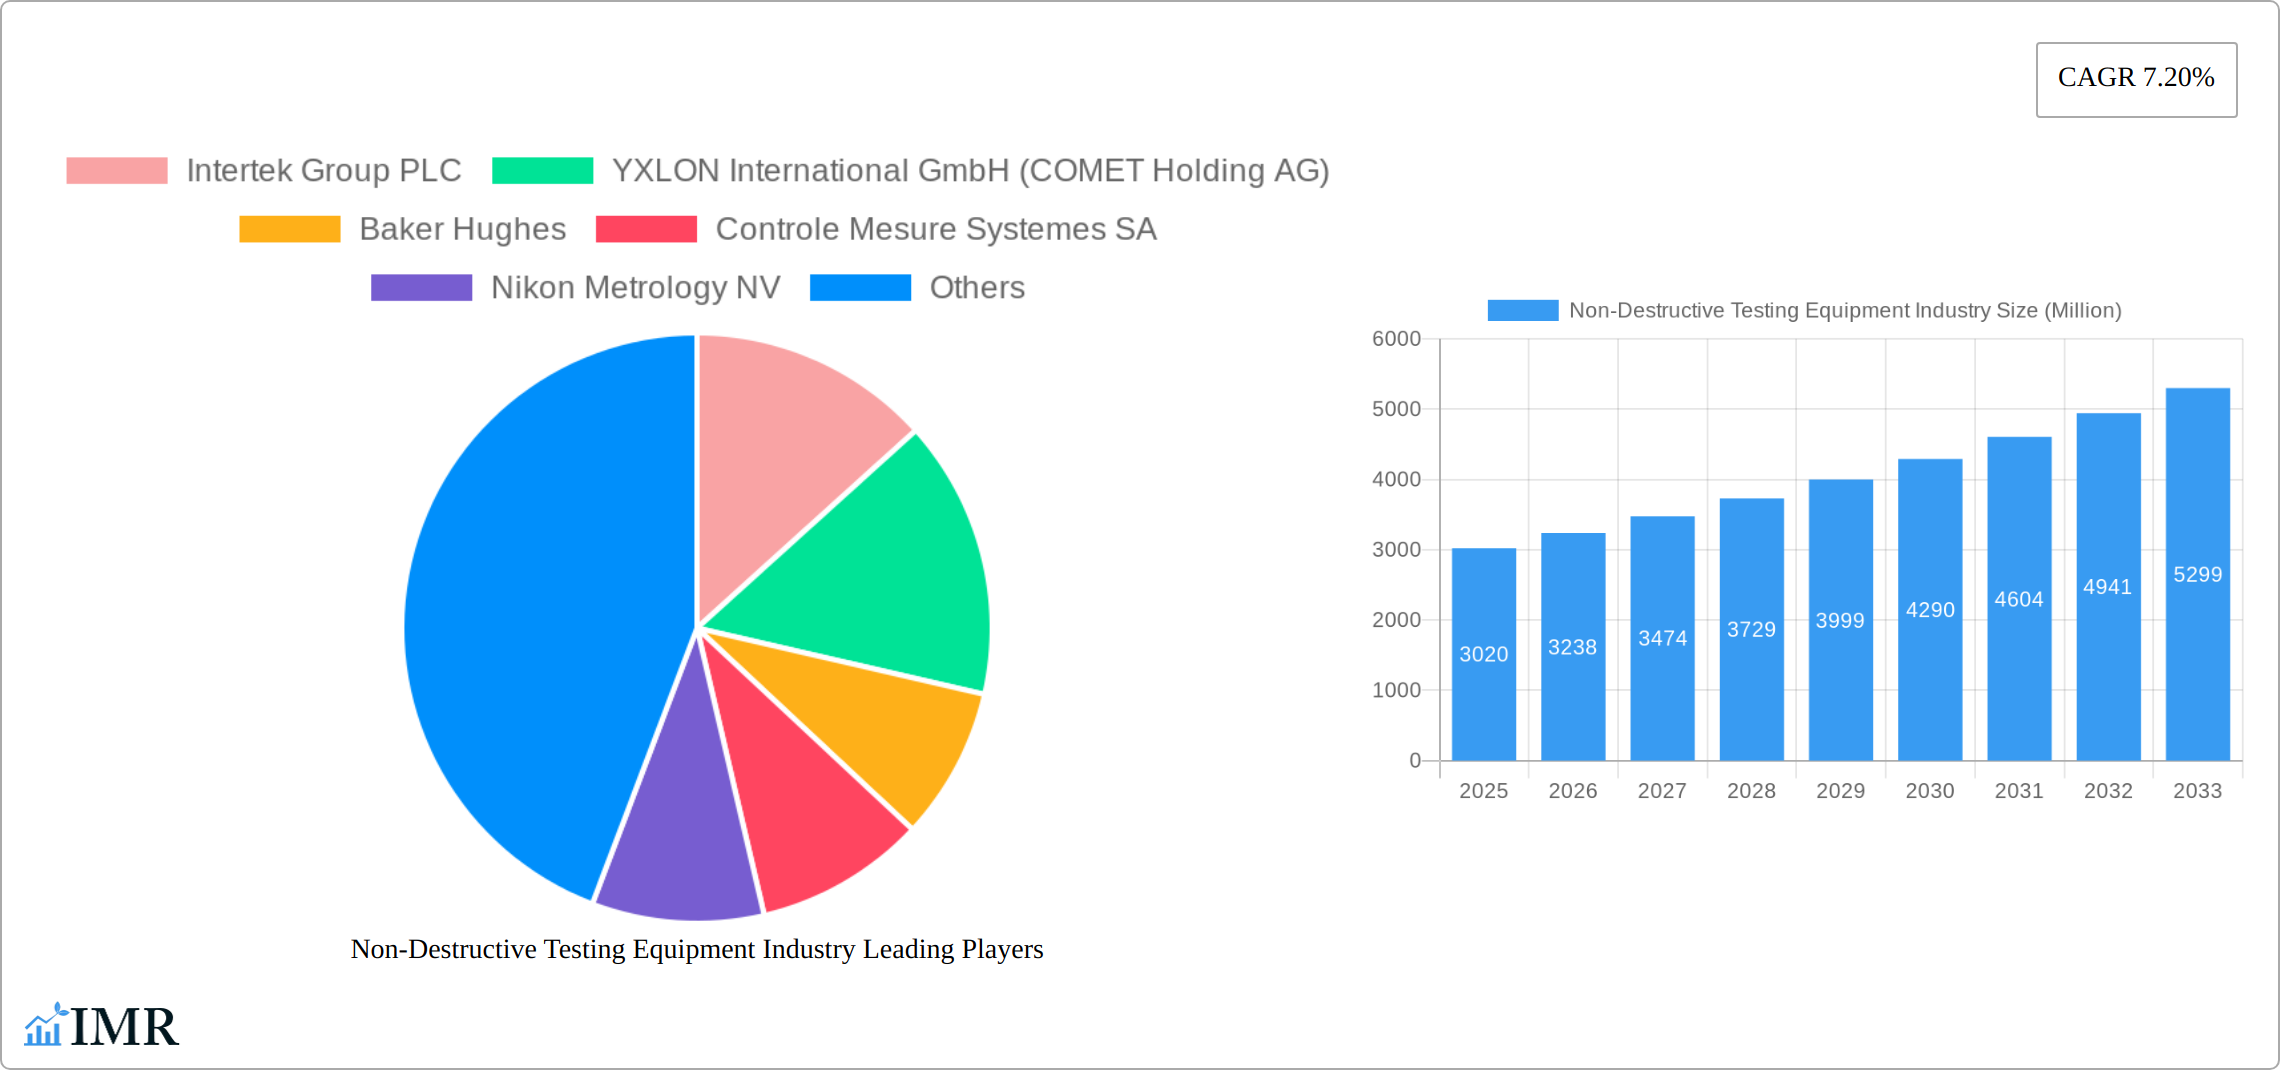
Non-Destructive Testing Equipment Industry Market Size (In Billion)
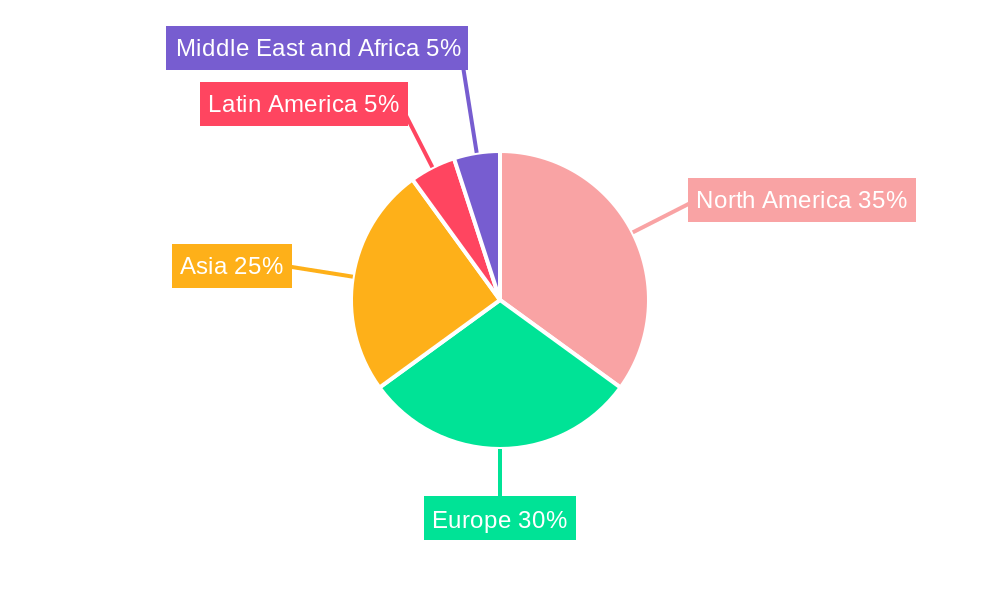
Competition within the NDT equipment market is intense, with established players like Intertek, Baker Hughes, and Fujifilm competing with specialized companies like Magnaflux and OkoNDT. The market landscape is characterized by continuous innovation, with companies focusing on developing more efficient, portable, and user-friendly equipment. The increasing adoption of digitalization and data analytics within NDT processes further contributes to market growth. While some regional markets such as North America and Europe are mature, rapid industrialization and infrastructure development in Asia and the Middle East and Africa present significant growth opportunities. However, high initial investment costs for advanced equipment and the need for skilled technicians can pose challenges to market expansion.
Non-Destructive Testing Equipment Industry Company Market Share
Non-Destructive Testing (NDT) Equipment Market Report: 2019-2033
This comprehensive report provides a detailed analysis of the Non-Destructive Testing (NDT) Equipment market, encompassing market size, growth trends, competitive landscape, and future outlook. The report covers the period from 2019 to 2033, with a focus on the forecast period 2025-2033 and a base year of 2025. This in-depth analysis is crucial for industry professionals, investors, and stakeholders seeking to understand this dynamic market. The market is segmented by technology (Radiography, Ultrasonic, Magnetic Particle, Liquid Penetrant, Visual Inspection, Eddy Current, and Others) and end-user industry (Oil & Gas, Power & Energy, Aerospace & Defense, Automotive & Transportation, Construction, and Others).
Non-Destructive Testing Equipment Industry Market Dynamics & Structure
The Non-Destructive Testing (NDT) equipment market is characterized by a dynamic and moderately concentrated landscape, featuring several key players that collectively hold a substantial market share. At its core, technological innovation serves as a pivotal market driver, propelled by the incessant pursuit of enhanced accuracy, accelerated testing speeds, and greater equipment portability. Furthermore, the industry's trajectory is significantly shaped by robust regulatory frameworks mandated across various end-user sectors to ensure paramount safety and quality standards. The market is in a perpetual state of evolution, witnessing the continuous emergence of novel testing methodologies and advanced technologies. While a competitive environment exists, particularly with the advent of sophisticated product substitutes in specialized applications, the underlying demand remains strong.
End-user demographics play a crucial role in dictating market demand, with industrial growth and ongoing infrastructure development acting as primary catalysts. Mergers and Acquisitions (M&A) activities have been a notable, albeit moderate, feature of the industry in recent years. Between 2019 and 2024, approximately xx deals were recorded, primarily strategized to broaden geographic reach and bolster technological capabilities.
- Market Concentration: The NDT equipment market exhibits moderate concentration, with the top 5 players commanding an estimated xx% market share in 2024.
- Technological Innovation: This remains a primary growth engine, with a strong emphasis on automation, the integration of Artificial Intelligence (AI), and sophisticated data analytics for enhanced inspection outcomes.
- Regulatory Frameworks: Stringent safety and quality regulations, particularly within critical industries like aerospace and oil & gas, significantly influence and drive demand for NDT equipment.
- Competitive Substitutes: The emergence of advanced alternative inspection techniques and innovative technologies presents an ongoing competitive landscape.
- M&A Activity: A total of xx M&A deals were observed between 2019 and 2024, with strategic objectives centered on market expansion and the integration of cutting-edge technologies.
- Innovation Barriers: High research and development (R&D) expenditures and the rigorous demands of certification processes represent significant barriers to entry for new market participants.
Non-Destructive Testing Equipment Industry Growth Trends & Insights
The NDT equipment market has demonstrated robust growth, registering a Compound Annual Growth Rate (CAGR) of xx% between 2019 and 2024, culminating in a market size valued at xx million units in 2024. This upward trajectory is largely attributable to accelerated global infrastructure development initiatives, the escalating adoption of stringent quality control standards across diverse industrial sectors, and the increasing embrace of sophisticated NDT techniques. Technological disruptions, most notably the integration of AI and machine learning into NDT systems, are significantly accelerating market adoption rates.
Evolving consumer behaviors, characterized by a clear shift towards automation and data-driven decision-making, are further augmenting market demand. The projected forecast period (2025-2033) anticipates a continued CAGR of xx%. This sustained growth is expected to be fueled by rising demand from emerging economies, coupled with persistent innovation in NDT technologies. Market penetration is anticipated to expand substantially, particularly in developing nations experiencing burgeoning industrial sectors.
Dominant Regions, Countries, or Segments in Non-Destructive Testing Equipment Industry
Currently, North America and Europe stand as the dominant forces in the NDT equipment market, largely owing to their well-established industrial sectors and stringent regulatory mandates. However, the Asia-Pacific region is exhibiting remarkable growth, driven by substantial infrastructure investments and vigorous industrial expansion, particularly in key economies like China and India. Within the technology segments, Ultrasonic Testing Equipment and Radiography Testing Equipment consistently command the largest market shares, closely followed by Magnetic Particle Testing Equipment.
The Oil and Gas sector and the Aerospace & Defense industries represent major contributors to market demand, primarily due to their unyielding commitment to safety and uncompromising quality standards.
- Leading Regions: North America and Europe together accounted for an impressive xx% market share in 2024.
- Fastest-Growing Region: Asia-Pacific is emerging as the fastest-growing region, propelled by significant infrastructure development and rapid industrialization.
- Dominant Technology Segments: Ultrasonic and Radiography testing equipment continue to lead the market in terms of adoption and demand.
- Key End-User Industries: The Oil & Gas and Aerospace & Defense sectors are the primary drivers of demand for NDT equipment.
- Growth Drivers: The market's expansion is underpinned by stringent safety regulations, extensive infrastructure development projects, and rising industrial output globally.
Non-Destructive Testing Equipment Industry Product Landscape
The NDT equipment market offers a diverse range of products, from basic portable devices to sophisticated automated systems. Recent innovations include improved image processing capabilities, enhanced portability, and integration of advanced data analytics. Products are differentiated based on their technology, portability, ease of use, accuracy, and data analysis features. Key selling propositions include improved efficiency, reduced inspection time, and enhanced data reliability. Technological advancements focus on automation, AI integration, and the development of more user-friendly interfaces.
Key Drivers, Barriers & Challenges in Non-Destructive Testing Equipment Industry
Key Drivers: Increasing demand for quality control across various industries, stringent safety regulations, technological advancements, and growing infrastructure projects. The increasing adoption of advanced materials in various sectors, demanding more sophisticated inspection methods is another driver.
Key Challenges: High initial investment costs, complexity of operation for some advanced systems, skilled labor shortages for equipment operation and interpretation, and the impact of economic fluctuations on investment decisions. Supply chain disruptions, particularly in the procurement of critical components, also represent a significant challenge.
Emerging Opportunities in Non-Destructive Testing Equipment Industry
The NDT equipment industry is poised to capitalize on several emerging opportunities. The development of specialized NDT solutions tailored for niche applications, such as the meticulous inspection of advanced composite materials and components fabricated through 3D printing, presents a significant avenue for growth. The integration of the Internet of Things (IoT) and cloud computing technologies to facilitate remote monitoring, real-time data analysis, and enhanced decision-making capabilities offers immense potential. Furthermore, strategic market expansion into emerging economies, characterized by burgeoning infrastructure projects and accelerating industrialization, represents considerable growth prospects.
Growth Accelerators in the Non-Destructive Testing Equipment Industry Industry
Long-term growth will be driven by technological breakthroughs such as advanced sensor technology and improved data analytics. Strategic partnerships between equipment manufacturers and end-user industries can accelerate market penetration and adoption. Expansion into new geographic markets and the development of specialized solutions for niche industries will play a crucial role in sustained growth.
Key Players Shaping the Non-Destructive Testing Equipment Industry Market
- Intertek Group PLC
- YXLON International GmbH (COMET Holding AG)
- Baker Hughes
- Controle Mesure Systemes SA
- Nikon Metrology NV
- Fujifilm Corporation
- Mistras Group Inc
- OkoNDT Group
- Innospection Limited
- Applus+ Laboratories
- Bureau Veritas SA
- Olympus Corporation
- Magnaflux Corp
Notable Milestones in Non-Destructive Testing Equipment Industry Sector
- May 2023: MP Machinery and Testing announced the release of proprietary material testing equipment for non-destructive determination of material properties. This expands the NDT product offerings and caters to various industries.
- May 2023: The American Petroleum Institute (API) signed MoUs with ASNT and NDTMA, promoting high-quality NDT and improving safety in the oil and gas sector. This strengthens industry standards and boosts demand for reliable NDT equipment.
In-Depth Non-Destructive Testing Equipment Industry Market Outlook
The outlook for the NDT equipment market is exceptionally promising, propelled by continuous technological advancements and an escalating global demand for reliable and efficient inspection methodologies across a vast spectrum of industries. Strategic partnerships, proactive market expansions into high-growth emerging economies, and the pioneering development of specialized NDT solutions will be instrumental in unlocking substantial growth potential. The market is strongly positioned for sustained expansion, driven by the imperative for enhanced safety protocols, stringent quality control measures, and the ever-present need for efficient infrastructure development on a global scale.
Non-Destructive Testing Equipment Industry Segmentation
-
1. Technology
- 1.1. Radiography Testing Equipment
- 1.2. Ultrasonic Testing Equipment
- 1.3. Magnetic Particle Testing Equipment
- 1.4. Liquid Penetrant Testing Equipment
- 1.5. Visual Inspection Equipment
- 1.6. Eddy Current Equipment
- 1.7. Other Technologies Equipment
-
2. End-user Industry
- 2.1. Oil and Gas
- 2.2. Power and Energy
- 2.3. Aerospace and Defense
- 2.4. Automotive and Transportation
- 2.5. Construction
- 2.6. Other End-user Industries
Non-Destructive Testing Equipment Industry Segmentation By Geography
-
1. North America
- 1.1. United States
- 1.2. Canada
-
2. Europe
- 2.1. United Kingdom
- 2.2. Germany
- 2.3. France
- 2.4. Russia
- 2.5. Italy
-
3. Asia
- 3.1. China
- 3.2. India
- 3.3. South Korea
- 4. Australia and New Zealand
-
5. Latin America
- 5.1. Mexico
- 5.2. Brazil
- 5.3. Argentina
-
6. Middle East and Africa
- 6.1. Saudi Arabia
- 6.2. United Arab Emirates
- 6.3. Qatar
Non-Destructive Testing Equipment Industry Regional Market Share
Geographic Coverage of Non-Destructive Testing Equipment Industry
Non-Destructive Testing Equipment Industry REPORT HIGHLIGHTS
| Aspects | Details |
|---|---|
| Study Period | 2020-2034 |
| Base Year | 2025 |
| Estimated Year | 2026 |
| Forecast Period | 2026-2034 |
| Historical Period | 2020-2025 |
| Growth Rate | CAGR of 7.20% from 2020-2034 |
| Segmentation |
|
Table of Contents
- 1. Introduction
- 1.1. Research Scope
- 1.2. Market Segmentation
- 1.3. Research Objective
- 1.4. Definitions and Assumptions
- 2. Executive Summary
- 2.1. Market Snapshot
- 3. Market Dynamics
- 3.1. Market Drivers
- 3.2. Market Restrains
- 3.3. Market Trends
- 3.4. Market Opportunities
- 4. Market Factor Analysis
- 4.1. Porters Five Forces
- 4.1.1. Bargaining Power of Suppliers
- 4.1.2. Bargaining Power of Buyers
- 4.1.3. Threat of New Entrants
- 4.1.4. Threat of Substitutes
- 4.1.5. Competitive Rivalry
- 4.2. PESTEL analysis
- 4.3. BCG Analysis
- 4.3.1. Stars (High Growth, High Market Share)
- 4.3.2. Cash Cows (Low Growth, High Market Share)
- 4.3.3. Question Mark (High Growth, Low Market Share)
- 4.3.4. Dogs (Low Growth, Low Market Share)
- 4.4. Ansoff Matrix Analysis
- 4.5. Supply Chain Analysis
- 4.6. Regulatory Landscape
- 4.7. Current Market Potential and Opportunity Assessment (TAM–SAM–SOM Framework)
- 4.8. IMR Analyst Note
- 4.1. Porters Five Forces
- 5. Market Analysis, Insights and Forecast 2021-2033
- 5.1. Market Analysis, Insights and Forecast - by Technology
- 5.1.1. Radiography Testing Equipment
- 5.1.2. Ultrasonic Testing Equipment
- 5.1.3. Magnetic Particle Testing Equipment
- 5.1.4. Liquid Penetrant Testing Equipment
- 5.1.5. Visual Inspection Equipment
- 5.1.6. Eddy Current Equipment
- 5.1.7. Other Technologies Equipment
- 5.2. Market Analysis, Insights and Forecast - by End-user Industry
- 5.2.1. Oil and Gas
- 5.2.2. Power and Energy
- 5.2.3. Aerospace and Defense
- 5.2.4. Automotive and Transportation
- 5.2.5. Construction
- 5.2.6. Other End-user Industries
- 5.3. Market Analysis, Insights and Forecast - by Region
- 5.3.1. North America
- 5.3.2. Europe
- 5.3.3. Asia
- 5.3.4. Australia and New Zealand
- 5.3.5. Latin America
- 5.3.6. Middle East and Africa
- 5.1. Market Analysis, Insights and Forecast - by Technology
- 6. Global Non-Destructive Testing Equipment Industry Analysis, Insights and Forecast, 2021-2033
- 6.1. Market Analysis, Insights and Forecast - by Technology
- 6.1.1. Radiography Testing Equipment
- 6.1.2. Ultrasonic Testing Equipment
- 6.1.3. Magnetic Particle Testing Equipment
- 6.1.4. Liquid Penetrant Testing Equipment
- 6.1.5. Visual Inspection Equipment
- 6.1.6. Eddy Current Equipment
- 6.1.7. Other Technologies Equipment
- 6.2. Market Analysis, Insights and Forecast - by End-user Industry
- 6.2.1. Oil and Gas
- 6.2.2. Power and Energy
- 6.2.3. Aerospace and Defense
- 6.2.4. Automotive and Transportation
- 6.2.5. Construction
- 6.2.6. Other End-user Industries
- 6.1. Market Analysis, Insights and Forecast - by Technology
- 7. North America Non-Destructive Testing Equipment Industry Analysis, Insights and Forecast, 2020-2032
- 7.1. Market Analysis, Insights and Forecast - by Technology
- 7.1.1. Radiography Testing Equipment
- 7.1.2. Ultrasonic Testing Equipment
- 7.1.3. Magnetic Particle Testing Equipment
- 7.1.4. Liquid Penetrant Testing Equipment
- 7.1.5. Visual Inspection Equipment
- 7.1.6. Eddy Current Equipment
- 7.1.7. Other Technologies Equipment
- 7.2. Market Analysis, Insights and Forecast - by End-user Industry
- 7.2.1. Oil and Gas
- 7.2.2. Power and Energy
- 7.2.3. Aerospace and Defense
- 7.2.4. Automotive and Transportation
- 7.2.5. Construction
- 7.2.6. Other End-user Industries
- 7.1. Market Analysis, Insights and Forecast - by Technology
- 8. Europe Non-Destructive Testing Equipment Industry Analysis, Insights and Forecast, 2020-2032
- 8.1. Market Analysis, Insights and Forecast - by Technology
- 8.1.1. Radiography Testing Equipment
- 8.1.2. Ultrasonic Testing Equipment
- 8.1.3. Magnetic Particle Testing Equipment
- 8.1.4. Liquid Penetrant Testing Equipment
- 8.1.5. Visual Inspection Equipment
- 8.1.6. Eddy Current Equipment
- 8.1.7. Other Technologies Equipment
- 8.2. Market Analysis, Insights and Forecast - by End-user Industry
- 8.2.1. Oil and Gas
- 8.2.2. Power and Energy
- 8.2.3. Aerospace and Defense
- 8.2.4. Automotive and Transportation
- 8.2.5. Construction
- 8.2.6. Other End-user Industries
- 8.1. Market Analysis, Insights and Forecast - by Technology
- 9. Asia Non-Destructive Testing Equipment Industry Analysis, Insights and Forecast, 2020-2032
- 9.1. Market Analysis, Insights and Forecast - by Technology
- 9.1.1. Radiography Testing Equipment
- 9.1.2. Ultrasonic Testing Equipment
- 9.1.3. Magnetic Particle Testing Equipment
- 9.1.4. Liquid Penetrant Testing Equipment
- 9.1.5. Visual Inspection Equipment
- 9.1.6. Eddy Current Equipment
- 9.1.7. Other Technologies Equipment
- 9.2. Market Analysis, Insights and Forecast - by End-user Industry
- 9.2.1. Oil and Gas
- 9.2.2. Power and Energy
- 9.2.3. Aerospace and Defense
- 9.2.4. Automotive and Transportation
- 9.2.5. Construction
- 9.2.6. Other End-user Industries
- 9.1. Market Analysis, Insights and Forecast - by Technology
- 10. Australia and New Zealand Non-Destructive Testing Equipment Industry Analysis, Insights and Forecast, 2020-2032
- 10.1. Market Analysis, Insights and Forecast - by Technology
- 10.1.1. Radiography Testing Equipment
- 10.1.2. Ultrasonic Testing Equipment
- 10.1.3. Magnetic Particle Testing Equipment
- 10.1.4. Liquid Penetrant Testing Equipment
- 10.1.5. Visual Inspection Equipment
- 10.1.6. Eddy Current Equipment
- 10.1.7. Other Technologies Equipment
- 10.2. Market Analysis, Insights and Forecast - by End-user Industry
- 10.2.1. Oil and Gas
- 10.2.2. Power and Energy
- 10.2.3. Aerospace and Defense
- 10.2.4. Automotive and Transportation
- 10.2.5. Construction
- 10.2.6. Other End-user Industries
- 10.1. Market Analysis, Insights and Forecast - by Technology
- 11. Latin America Non-Destructive Testing Equipment Industry Analysis, Insights and Forecast, 2020-2032
- 11.1. Market Analysis, Insights and Forecast - by Technology
- 11.1.1. Radiography Testing Equipment
- 11.1.2. Ultrasonic Testing Equipment
- 11.1.3. Magnetic Particle Testing Equipment
- 11.1.4. Liquid Penetrant Testing Equipment
- 11.1.5. Visual Inspection Equipment
- 11.1.6. Eddy Current Equipment
- 11.1.7. Other Technologies Equipment
- 11.2. Market Analysis, Insights and Forecast - by End-user Industry
- 11.2.1. Oil and Gas
- 11.2.2. Power and Energy
- 11.2.3. Aerospace and Defense
- 11.2.4. Automotive and Transportation
- 11.2.5. Construction
- 11.2.6. Other End-user Industries
- 11.1. Market Analysis, Insights and Forecast - by Technology
- 12. Middle East and Africa Non-Destructive Testing Equipment Industry Analysis, Insights and Forecast, 2020-2032
- 12.1. Market Analysis, Insights and Forecast - by Technology
- 12.1.1. Radiography Testing Equipment
- 12.1.2. Ultrasonic Testing Equipment
- 12.1.3. Magnetic Particle Testing Equipment
- 12.1.4. Liquid Penetrant Testing Equipment
- 12.1.5. Visual Inspection Equipment
- 12.1.6. Eddy Current Equipment
- 12.1.7. Other Technologies Equipment
- 12.2. Market Analysis, Insights and Forecast - by End-user Industry
- 12.2.1. Oil and Gas
- 12.2.2. Power and Energy
- 12.2.3. Aerospace and Defense
- 12.2.4. Automotive and Transportation
- 12.2.5. Construction
- 12.2.6. Other End-user Industries
- 12.1. Market Analysis, Insights and Forecast - by Technology
- 13. Competitive Analysis
- 13.1. Company Profiles
- 13.1.1 Intertek Group PLC
- 13.1.1.1. Company Overview
- 13.1.1.2. Products
- 13.1.1.3. Company Financials
- 13.1.1.4. SWOT Analysis
- 13.1.2 YXLON International GmbH (COMET Holding AG)
- 13.1.2.1. Company Overview
- 13.1.2.2. Products
- 13.1.2.3. Company Financials
- 13.1.2.4. SWOT Analysis
- 13.1.3 Baker Hughes
- 13.1.3.1. Company Overview
- 13.1.3.2. Products
- 13.1.3.3. Company Financials
- 13.1.3.4. SWOT Analysis
- 13.1.4 Controle Mesure Systemes SA
- 13.1.4.1. Company Overview
- 13.1.4.2. Products
- 13.1.4.3. Company Financials
- 13.1.4.4. SWOT Analysis
- 13.1.5 Nikon Metrology NV
- 13.1.5.1. Company Overview
- 13.1.5.2. Products
- 13.1.5.3. Company Financials
- 13.1.5.4. SWOT Analysis
- 13.1.6 Fujifilm Corporation
- 13.1.6.1. Company Overview
- 13.1.6.2. Products
- 13.1.6.3. Company Financials
- 13.1.6.4. SWOT Analysis
- 13.1.7 Mistras Group Inc
- 13.1.7.1. Company Overview
- 13.1.7.2. Products
- 13.1.7.3. Company Financials
- 13.1.7.4. SWOT Analysis
- 13.1.8 OkoNDT Group
- 13.1.8.1. Company Overview
- 13.1.8.2. Products
- 13.1.8.3. Company Financials
- 13.1.8.4. SWOT Analysis
- 13.1.9 Innospection Limited
- 13.1.9.1. Company Overview
- 13.1.9.2. Products
- 13.1.9.3. Company Financials
- 13.1.9.4. SWOT Analysis
- 13.1.10 Applus+ Laboratories
- 13.1.10.1. Company Overview
- 13.1.10.2. Products
- 13.1.10.3. Company Financials
- 13.1.10.4. SWOT Analysis
- 13.1.11 Bureau Veritas SA
- 13.1.11.1. Company Overview
- 13.1.11.2. Products
- 13.1.11.3. Company Financials
- 13.1.11.4. SWOT Analysis
- 13.1.12 Olympus Corporation
- 13.1.12.1. Company Overview
- 13.1.12.2. Products
- 13.1.12.3. Company Financials
- 13.1.12.4. SWOT Analysis
- 13.1.13 Magnaflux Corp
- 13.1.13.1. Company Overview
- 13.1.13.2. Products
- 13.1.13.3. Company Financials
- 13.1.13.4. SWOT Analysis
- 13.1.1 Intertek Group PLC
- 13.2. Market Entropy
- 13.2.1 Company's Key Areas Served
- 13.2.2 Recent Developments
- 13.3. Company Market Share Analysis 2025
- 13.3.1 Top 5 Companies Market Share Analysis
- 13.3.2 Top 3 Companies Market Share Analysis
- 13.4. List of Potential Customers
- 14. Research Methodology
List of Figures
- Figure 1: Global Non-Destructive Testing Equipment Industry Revenue Breakdown (Million, %) by Region 2025 & 2033
- Figure 2: North America Non-Destructive Testing Equipment Industry Revenue (Million), by Technology 2025 & 2033
- Figure 3: North America Non-Destructive Testing Equipment Industry Revenue Share (%), by Technology 2025 & 2033
- Figure 4: North America Non-Destructive Testing Equipment Industry Revenue (Million), by End-user Industry 2025 & 2033
- Figure 5: North America Non-Destructive Testing Equipment Industry Revenue Share (%), by End-user Industry 2025 & 2033
- Figure 6: North America Non-Destructive Testing Equipment Industry Revenue (Million), by Country 2025 & 2033
- Figure 7: North America Non-Destructive Testing Equipment Industry Revenue Share (%), by Country 2025 & 2033
- Figure 8: Europe Non-Destructive Testing Equipment Industry Revenue (Million), by Technology 2025 & 2033
- Figure 9: Europe Non-Destructive Testing Equipment Industry Revenue Share (%), by Technology 2025 & 2033
- Figure 10: Europe Non-Destructive Testing Equipment Industry Revenue (Million), by End-user Industry 2025 & 2033
- Figure 11: Europe Non-Destructive Testing Equipment Industry Revenue Share (%), by End-user Industry 2025 & 2033
- Figure 12: Europe Non-Destructive Testing Equipment Industry Revenue (Million), by Country 2025 & 2033
- Figure 13: Europe Non-Destructive Testing Equipment Industry Revenue Share (%), by Country 2025 & 2033
- Figure 14: Asia Non-Destructive Testing Equipment Industry Revenue (Million), by Technology 2025 & 2033
- Figure 15: Asia Non-Destructive Testing Equipment Industry Revenue Share (%), by Technology 2025 & 2033
- Figure 16: Asia Non-Destructive Testing Equipment Industry Revenue (Million), by End-user Industry 2025 & 2033
- Figure 17: Asia Non-Destructive Testing Equipment Industry Revenue Share (%), by End-user Industry 2025 & 2033
- Figure 18: Asia Non-Destructive Testing Equipment Industry Revenue (Million), by Country 2025 & 2033
- Figure 19: Asia Non-Destructive Testing Equipment Industry Revenue Share (%), by Country 2025 & 2033
- Figure 20: Australia and New Zealand Non-Destructive Testing Equipment Industry Revenue (Million), by Technology 2025 & 2033
- Figure 21: Australia and New Zealand Non-Destructive Testing Equipment Industry Revenue Share (%), by Technology 2025 & 2033
- Figure 22: Australia and New Zealand Non-Destructive Testing Equipment Industry Revenue (Million), by End-user Industry 2025 & 2033
- Figure 23: Australia and New Zealand Non-Destructive Testing Equipment Industry Revenue Share (%), by End-user Industry 2025 & 2033
- Figure 24: Australia and New Zealand Non-Destructive Testing Equipment Industry Revenue (Million), by Country 2025 & 2033
- Figure 25: Australia and New Zealand Non-Destructive Testing Equipment Industry Revenue Share (%), by Country 2025 & 2033
- Figure 26: Latin America Non-Destructive Testing Equipment Industry Revenue (Million), by Technology 2025 & 2033
- Figure 27: Latin America Non-Destructive Testing Equipment Industry Revenue Share (%), by Technology 2025 & 2033
- Figure 28: Latin America Non-Destructive Testing Equipment Industry Revenue (Million), by End-user Industry 2025 & 2033
- Figure 29: Latin America Non-Destructive Testing Equipment Industry Revenue Share (%), by End-user Industry 2025 & 2033
- Figure 30: Latin America Non-Destructive Testing Equipment Industry Revenue (Million), by Country 2025 & 2033
- Figure 31: Latin America Non-Destructive Testing Equipment Industry Revenue Share (%), by Country 2025 & 2033
- Figure 32: Middle East and Africa Non-Destructive Testing Equipment Industry Revenue (Million), by Technology 2025 & 2033
- Figure 33: Middle East and Africa Non-Destructive Testing Equipment Industry Revenue Share (%), by Technology 2025 & 2033
- Figure 34: Middle East and Africa Non-Destructive Testing Equipment Industry Revenue (Million), by End-user Industry 2025 & 2033
- Figure 35: Middle East and Africa Non-Destructive Testing Equipment Industry Revenue Share (%), by End-user Industry 2025 & 2033
- Figure 36: Middle East and Africa Non-Destructive Testing Equipment Industry Revenue (Million), by Country 2025 & 2033
- Figure 37: Middle East and Africa Non-Destructive Testing Equipment Industry Revenue Share (%), by Country 2025 & 2033
List of Tables
- Table 1: Global Non-Destructive Testing Equipment Industry Revenue Million Forecast, by Technology 2020 & 2033
- Table 2: Global Non-Destructive Testing Equipment Industry Revenue Million Forecast, by End-user Industry 2020 & 2033
- Table 3: Global Non-Destructive Testing Equipment Industry Revenue Million Forecast, by Region 2020 & 2033
- Table 4: Global Non-Destructive Testing Equipment Industry Revenue Million Forecast, by Technology 2020 & 2033
- Table 5: Global Non-Destructive Testing Equipment Industry Revenue Million Forecast, by End-user Industry 2020 & 2033
- Table 6: Global Non-Destructive Testing Equipment Industry Revenue Million Forecast, by Country 2020 & 2033
- Table 7: United States Non-Destructive Testing Equipment Industry Revenue (Million) Forecast, by Application 2020 & 2033
- Table 8: Canada Non-Destructive Testing Equipment Industry Revenue (Million) Forecast, by Application 2020 & 2033
- Table 9: Global Non-Destructive Testing Equipment Industry Revenue Million Forecast, by Technology 2020 & 2033
- Table 10: Global Non-Destructive Testing Equipment Industry Revenue Million Forecast, by End-user Industry 2020 & 2033
- Table 11: Global Non-Destructive Testing Equipment Industry Revenue Million Forecast, by Country 2020 & 2033
- Table 12: United Kingdom Non-Destructive Testing Equipment Industry Revenue (Million) Forecast, by Application 2020 & 2033
- Table 13: Germany Non-Destructive Testing Equipment Industry Revenue (Million) Forecast, by Application 2020 & 2033
- Table 14: France Non-Destructive Testing Equipment Industry Revenue (Million) Forecast, by Application 2020 & 2033
- Table 15: Russia Non-Destructive Testing Equipment Industry Revenue (Million) Forecast, by Application 2020 & 2033
- Table 16: Italy Non-Destructive Testing Equipment Industry Revenue (Million) Forecast, by Application 2020 & 2033
- Table 17: Global Non-Destructive Testing Equipment Industry Revenue Million Forecast, by Technology 2020 & 2033
- Table 18: Global Non-Destructive Testing Equipment Industry Revenue Million Forecast, by End-user Industry 2020 & 2033
- Table 19: Global Non-Destructive Testing Equipment Industry Revenue Million Forecast, by Country 2020 & 2033
- Table 20: China Non-Destructive Testing Equipment Industry Revenue (Million) Forecast, by Application 2020 & 2033
- Table 21: India Non-Destructive Testing Equipment Industry Revenue (Million) Forecast, by Application 2020 & 2033
- Table 22: South Korea Non-Destructive Testing Equipment Industry Revenue (Million) Forecast, by Application 2020 & 2033
- Table 23: Global Non-Destructive Testing Equipment Industry Revenue Million Forecast, by Technology 2020 & 2033
- Table 24: Global Non-Destructive Testing Equipment Industry Revenue Million Forecast, by End-user Industry 2020 & 2033
- Table 25: Global Non-Destructive Testing Equipment Industry Revenue Million Forecast, by Country 2020 & 2033
- Table 26: Global Non-Destructive Testing Equipment Industry Revenue Million Forecast, by Technology 2020 & 2033
- Table 27: Global Non-Destructive Testing Equipment Industry Revenue Million Forecast, by End-user Industry 2020 & 2033
- Table 28: Global Non-Destructive Testing Equipment Industry Revenue Million Forecast, by Country 2020 & 2033
- Table 29: Mexico Non-Destructive Testing Equipment Industry Revenue (Million) Forecast, by Application 2020 & 2033
- Table 30: Brazil Non-Destructive Testing Equipment Industry Revenue (Million) Forecast, by Application 2020 & 2033
- Table 31: Argentina Non-Destructive Testing Equipment Industry Revenue (Million) Forecast, by Application 2020 & 2033
- Table 32: Global Non-Destructive Testing Equipment Industry Revenue Million Forecast, by Technology 2020 & 2033
- Table 33: Global Non-Destructive Testing Equipment Industry Revenue Million Forecast, by End-user Industry 2020 & 2033
- Table 34: Global Non-Destructive Testing Equipment Industry Revenue Million Forecast, by Country 2020 & 2033
- Table 35: Saudi Arabia Non-Destructive Testing Equipment Industry Revenue (Million) Forecast, by Application 2020 & 2033
- Table 36: United Arab Emirates Non-Destructive Testing Equipment Industry Revenue (Million) Forecast, by Application 2020 & 2033
- Table 37: Qatar Non-Destructive Testing Equipment Industry Revenue (Million) Forecast, by Application 2020 & 2033
Frequently Asked Questions
1. What is the projected Compound Annual Growth Rate (CAGR) of the Non-Destructive Testing Equipment Industry?
The projected CAGR is approximately 7.20%.
2. Which companies are prominent players in the Non-Destructive Testing Equipment Industry?
Key companies in the market include Intertek Group PLC, YXLON International GmbH (COMET Holding AG), Baker Hughes, Controle Mesure Systemes SA, Nikon Metrology NV, Fujifilm Corporation, Mistras Group Inc, OkoNDT Group, Innospection Limited, Applus+ Laboratories, Bureau Veritas SA, Olympus Corporation, Magnaflux Corp.
3. What are the main segments of the Non-Destructive Testing Equipment Industry?
The market segments include Technology, End-user Industry.
4. Can you provide details about the market size?
The market size is estimated to be USD 3.02 Million as of 2022.
5. What are some drivers contributing to market growth?
Stringent Regulations Mandating Safety; Aging Infrastructure and Increasing Need for Maintenance.
6. What are the notable trends driving market growth?
Oil and Gas Holds Highest Market Share.
7. Are there any restraints impacting market growth?
Lack of Skilled Personnel and Training Facilities.
8. Can you provide examples of recent developments in the market?
May 2023: MP Machinery and Testing announced the release of proprietary material testing equipment that non-destructively determines the material properties of structures and in-service components. MPM provides advanced material testing products and services for the steel, nuclear power & energy, aerospace, pipe, defense, and transportation industries.
9. What pricing options are available for accessing the report?
Pricing options include single-user, multi-user, and enterprise licenses priced at USD 4750, USD 5250, and USD 8750 respectively.
10. Is the market size provided in terms of value or volume?
The market size is provided in terms of value, measured in Million.
11. Are there any specific market keywords associated with the report?
Yes, the market keyword associated with the report is "Non-Destructive Testing Equipment Industry," which aids in identifying and referencing the specific market segment covered.
12. How do I determine which pricing option suits my needs best?
The pricing options vary based on user requirements and access needs. Individual users may opt for single-user licenses, while businesses requiring broader access may choose multi-user or enterprise licenses for cost-effective access to the report.
13. Are there any additional resources or data provided in the Non-Destructive Testing Equipment Industry report?
While the report offers comprehensive insights, it's advisable to review the specific contents or supplementary materials provided to ascertain if additional resources or data are available.
14. How can I stay updated on further developments or reports in the Non-Destructive Testing Equipment Industry?
To stay informed about further developments, trends, and reports in the Non-Destructive Testing Equipment Industry, consider subscribing to industry newsletters, following relevant companies and organizations, or regularly checking reputable industry news sources and publications.
Methodology
Step 1 - Identification of Relevant Samples Size from Population Database


Step 2 - Approaches for Defining Global Market Size (Value, Volume* & Price*)

Note*: In applicable scenarios
Step 3 - Data Sources
Primary Research
- Web Analytics
- Survey Reports
- Research Institute
- Latest Research Reports
- Opinion Leaders
Secondary Research
- Annual Reports
- White Paper
- Latest Press Release
- Industry Association
- Paid Database
- Investor Presentations

Step 4 - Data Triangulation
Involves using different sources of information in order to increase the validity of a study
These sources are likely to be stakeholders in a program - participants, other researchers, program staff, other community members, and so on.
Then we put all data in single framework & apply various statistical tools to find out the dynamic on the market.
During the analysis stage, feedback from the stakeholder groups would be compared to determine areas of agreement as well as areas of divergence