

Key Insights
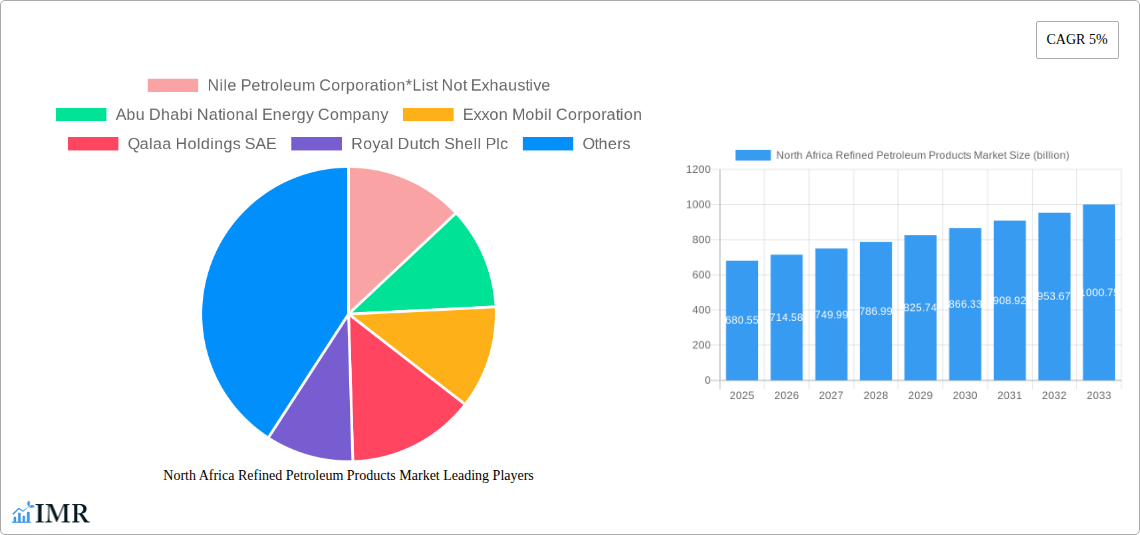
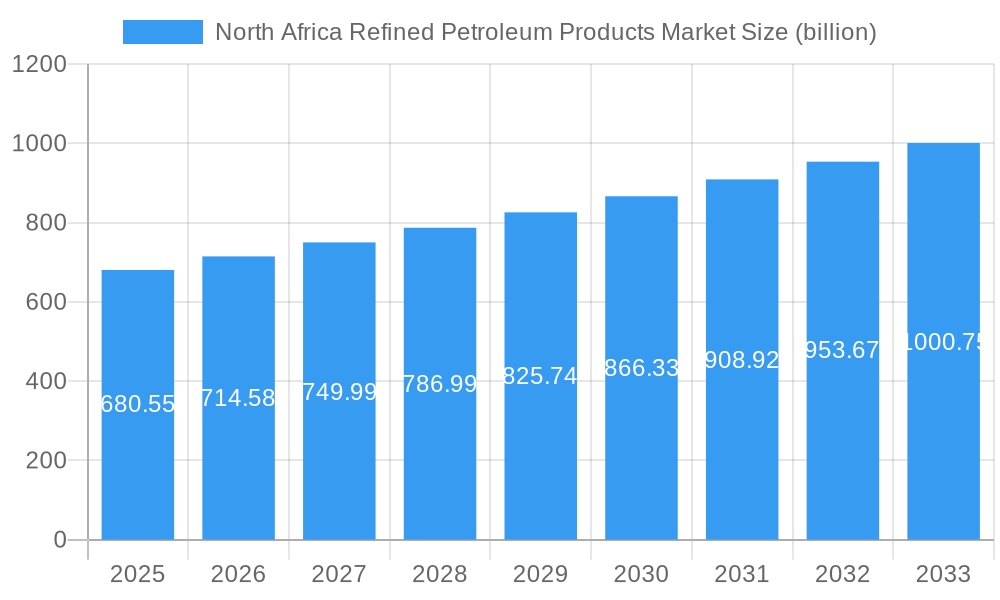
The North Africa Refined Petroleum Products Market is poised for steady growth, with an estimated market size of USD 611.94 billion in 2021. The market is projected to expand at a Compound Annual Growth Rate (CAGR) of 5% through 2033, indicating a robust and expanding demand for refined petroleum products across the region. This growth is underpinned by a variety of factors, including increasing energy consumption driven by industrialization and infrastructure development, a growing population, and the ongoing reliance on refined petroleum for transportation, power generation, and petrochemical feedstock. Key segments within this market include Light Distillates, Middle Distillates, and Heavy Distillates, each catering to distinct industrial and consumer needs. Geographically, North Africa, encompassing key markets like Morocco, Algeria, and Egypt, along with the broader Rest of North Africa, forms the core of this dynamic sector. The competitive landscape features major global and regional players, including Exxon Mobil Corporation, Royal Dutch Shell Plc, Total S A, Sonatrach SPA, and Abu Dhabi National Energy Company, all vying for market share and contributing to innovation and supply chain efficiency.
North Africa Refined Petroleum Products Market Market Size (In Million)
The market's trajectory, however, is not without its challenges. While drivers such as economic expansion and rising energy needs are significant, evolving global energy policies, increasing investments in renewable energy sources, and the push towards decarbonization could act as potential restraints in the long term. Nevertheless, the immediate future suggests a continued reliance on refined petroleum products to fuel economic activities and meet energy demands in North Africa. The study period, spanning from 2019 to 2033 with a base year of 2025, highlights a strategic focus on understanding current market dynamics and forecasting future trends. The forecast period (2025-2033) will likely witness strategic investments in upgrading refining capacities, optimizing product portfolios to meet cleaner fuel standards, and adapting to shifting energy landscapes. The market's resilience and adaptability will be crucial in navigating these evolving conditions and sustaining its growth trajectory.
North Africa Refined Petroleum Products Market Company Market Share
North Africa Refined Petroleum Products Market: Comprehensive Analysis and Future Outlook (2019-2033)
This in-depth report provides a definitive analysis of the North Africa Refined Petroleum Products Market, offering critical insights into market dynamics, growth trends, competitive landscape, and future opportunities. Spanning the period from 2019 to 2033, with a base and estimated year of 2025, this report is an essential resource for stakeholders seeking to understand and capitalize on this dynamic region. We dissect the parent market and its child segments, presenting data in billions of USD, ensuring a clear understanding of market valuation.
North Africa Refined Petroleum Products Market Market Dynamics & Structure
The North Africa Refined Petroleum Products Market exhibits a moderately concentrated structure, with a few key players holding significant market share, but with growing influence from regional entities. Technological innovation is primarily driven by advancements in refining processes, aiming for increased efficiency, reduced environmental impact, and the production of higher-value products. Regulatory frameworks are evolving, influenced by international standards for fuel quality and environmental emissions, alongside national energy policies aimed at energy security and diversification. Competitive product substitutes are limited for core refined products, though the long-term threat from alternative energy sources is a growing consideration. End-user demographics are characterized by a growing middle class in key economies like Egypt and Algeria, driving demand for transportation fuels and industrial applications. Mergers and acquisitions (M&A) activity, while not extensive, is strategic, focusing on capacity expansion, technology acquisition, and vertical integration. For instance, anticipated M&A deal volumes are estimated at around $3.5 billion over the forecast period, driven by consolidation and the pursuit of economies of scale. Barriers to innovation include high capital investment requirements for upgrading refining infrastructure and the complexity of adapting to diverse regional regulatory landscapes.
- Market Concentration: Moderate, with leading national oil companies dominating.
- Technological Drivers: Process optimization, environmental compliance, higher-value product yields.
- Regulatory Frameworks: Increasing alignment with global fuel quality standards and national energy security goals.
- Competitive Substitutes: Primarily alternative energy sources in the long term.
- End-User Demographics: Growing middle class, industrial expansion.
- M&A Trends: Strategic, focused on capacity and technology.
- Innovation Barriers: High capital investment, regulatory complexity.
North Africa Refined Petroleum Products Market Growth Trends & Insights
The North Africa Refined Petroleum Products Market is poised for robust growth, projecting a Compound Annual Growth Rate (CAGR) of approximately 4.2% over the forecast period, reaching an estimated market size of $115.8 billion by 2033. This expansion is fueled by a confluence of factors, including sustained economic development across key nations like Algeria and Egypt, leading to increased demand for transportation fuels and petrochemical feedstocks. The adoption rate of advanced refining technologies, particularly those enhancing yield and efficiency, is steadily increasing, driven by the need to meet stricter environmental regulations and optimize operational costs. Technological disruptions, while not revolutionary in the short term, are focused on incremental improvements such as enhanced catalysis and digitalization of refinery operations. Consumer behavior shifts are evident in the growing preference for cleaner-burning fuels and an increased awareness of energy efficiency. The market penetration of premium fuel grades is also on an upward trajectory, reflecting a more discerning consumer base. The estimated market size in the base year of 2025 is $98.5 billion, indicating significant expansion potential in the coming decade. Increased urbanization and infrastructure development across the region are critical in supporting this growth, translating into higher demand for refined petroleum products in construction and transportation sectors. Furthermore, the growing industrial base, particularly in manufacturing and petrochemicals, will continue to be a strong demand driver.
Dominant Regions, Countries, or Segments in North Africa Refined Petroleum Products Market
Algeria emerges as a dominant force within the North Africa Refined Petroleum Products Market, driven by its substantial domestic refining capacity and significant oil and gas reserves. This dominance is further bolstered by favorable government policies supporting the energy sector and substantial investments in infrastructure aimed at optimizing the distribution of refined products. The country's strategic location and its role as a major exporter of petroleum products contribute to its leading position. The Middle Distillates segment, encompassing diesel fuel and jet fuel, is projected to be the fastest-growing within the Type classification, driven by the expanding transportation sector, including both road freight and air travel, and the increasing use of diesel in industrial machinery and power generation. In terms of geography, Algeria commands a significant market share, estimated at 35% of the total market value in the base year 2025, with Morocco and Egypt following closely. The Rest of North Africa, encompassing countries like Tunisia and Libya, also contributes to the overall market, albeit with smaller individual shares. Key drivers for Algeria's dominance include its robust economic growth projections, which directly correlate with increased energy consumption, and ongoing efforts to modernize its refining infrastructure to meet evolving market demands and environmental standards. The country's strategic initiatives to enhance its downstream sector, including investments in new refineries and expansion of existing ones, underscore its commitment to maintaining its leadership. Furthermore, Algeria's active role in regional energy dialogues and its participation in international oil markets solidify its position as a critical player.
- Dominant Country: Algeria
- Key Drivers for Algeria: Substantial reserves, favorable policies, infrastructure investment, export capacity.
- Dominant Segment (Type): Middle Distillates (Diesel, Jet Fuel)
- Drivers for Middle Distillates: Transportation growth, industrial demand, power generation.
- Geographic Market Share (2025 Estimate): Algeria (35%), Morocco (22%), Egypt (28%), Rest of North Africa (15%).
- Growth Potential: High due to ongoing development and modernization efforts.
North Africa Refined Petroleum Products Market Product Landscape
The product landscape within the North Africa Refined Petroleum Products Market is characterized by a focus on essential fuels and petrochemical feedstocks. Key offerings include gasoline, diesel, jet fuel, and various fuel oils catering to diverse end-use applications, from transportation to industrial power generation. Innovations are centered around improving fuel efficiency, reducing emissions to meet environmental mandates, and enhancing the quality of petrochemical feedstocks for downstream industries. Performance metrics are increasingly scrutinized, with an emphasis on sulfur content reduction and octane rating improvements for gasoline. Unique selling propositions often revolve around product availability, supply chain reliability, and adherence to international quality standards. Technological advancements are gradually being integrated to optimize refining processes, leading to more consistent product quality and reduced environmental impact.
Key Drivers, Barriers & Challenges in North Africa Refined Petroleum Products Market
The North Africa Refined Petroleum Products Market is propelled by several key drivers. Economic growth and industrial expansion are fundamentally increasing the demand for refined fuels. Government initiatives aimed at energy security and infrastructure development also act as significant catalysts. Furthermore, the growing automotive sector and increasing air travel contribute to sustained demand for transportation fuels.
However, the market faces notable barriers and challenges. Volatility in global crude oil prices directly impacts refining margins and investment decisions. Stringent environmental regulations, while ultimately beneficial, require substantial capital investment for compliance. Geopolitical instability in certain sub-regions can disrupt supply chains and affect operational continuity. Additionally, competition from alternative energy sources, though nascent in some applications, poses a long-term challenge.
Emerging Opportunities in North Africa Refined Petroleum Products Market
Emerging opportunities within the North Africa Refined Petroleum Products Market lie in the increasing demand for specialized petroleum derivatives and the potential for increased exports to neighboring regions. The growing petrochemical sector presents a significant opportunity for higher-value product streams. Furthermore, investments in cleaner fuel technologies and infrastructure development, particularly for electric vehicle charging networks powered by cleaner energy sources derived from refining processes, can open new avenues. The untapped potential in regions with developing energy infrastructure also presents growth prospects for market players focused on reliable supply.
Growth Accelerators in the North Africa Refined Petroleum Products Market Industry
Growth in the North Africa Refined Petroleum Products Market industry is being accelerated by significant investments in refinery upgrades and expansion projects across key countries like Egypt and Algeria. Technological breakthroughs in catalysis and process optimization are enhancing efficiency and enabling the production of higher-quality products, thereby increasing profitability. Strategic partnerships between national oil companies and international players are facilitating technology transfer and access to global best practices, further fueling growth. Market expansion strategies, including exploring new export markets and diversifying product portfolios to include niche petrochemicals, are also critical accelerators.
Key Players Shaping the North Africa Refined Petroleum Products Market Market
- Nile Petroleum Corporation
- Abu Dhabi National Energy Company
- Exxon Mobil Corporation
- Qalaa Holdings SAE
- Royal Dutch Shell Plc
- Total S A
- Sonatrach SPA
Notable Milestones in North Africa Refined Petroleum Products Market Sector
- 2022/05: Sonatrach announces significant investment in upgrading its Arzew refinery to enhance gasoline production and meet Euro V standards.
- 2023/01: Egypt's Ministry of Petroleum and Mineral Resources outlines plans for expanding refining capacity by 30% by 2030 to meet growing domestic demand.
- 2023/08: Royal Dutch Shell Plc explores potential partnerships for developing advanced refining technologies in Morocco.
- 2024/02: Qalaa Holdings SAE completes acquisition of a stake in a regional petrochemical complex, signaling strategic diversification.
- 2024/07: Algeria's Sonatrach announces a new project to produce low-sulfur diesel, aligning with stricter environmental regulations.
In-Depth North Africa Refined Petroleum Products Market Market Outlook
The outlook for the North Africa Refined Petroleum Products Market is strongly positive, characterized by sustained demand driven by economic expansion and demographic growth. Key growth accelerators, including technological advancements in refining and strategic investments in capacity, will continue to shape the market. The increasing focus on cleaner fuels and the burgeoning petrochemical sector present significant opportunities for innovation and market diversification. Stakeholders can anticipate continued M&A activity as companies seek to consolidate their positions and leverage synergies. The market is expected to witness a steady increase in value, reaching approximately $115.8 billion by 2033, underscoring its importance in the global energy landscape. Strategic opportunities will likely focus on enhancing efficiency, meeting evolving environmental standards, and capitalizing on regional development trends.
North Africa Refined Petroleum Products Market Segmentation
-
1. Type
- 1.1. Light Distillates
- 1.2. Middle Distillates
- 1.3. Heavy Distillates
-
2. Geogrpahy
- 2.1. Morocco
- 2.2. Algeria
- 2.3. Egypt
- 2.4. Rest of North Africa
North Africa Refined Petroleum Products Market Segmentation By Geography
-
1. North America
- 1.1. United States
- 1.2. Canada
- 1.3. Mexico
-
2. South America
- 2.1. Brazil
- 2.2. Argentina
- 2.3. Rest of South America
-
3. Europe
- 3.1. United Kingdom
- 3.2. Germany
- 3.3. France
- 3.4. Italy
- 3.5. Spain
- 3.6. Russia
- 3.7. Benelux
- 3.8. Nordics
- 3.9. Rest of Europe
-
4. Middle East & Africa
- 4.1. Turkey
- 4.2. Israel
- 4.3. GCC
- 4.4. North Africa
- 4.5. South Africa
- 4.6. Rest of Middle East & Africa
-
5. Asia Pacific
- 5.1. China
- 5.2. India
- 5.3. Japan
- 5.4. South Korea
- 5.5. ASEAN
- 5.6. Oceania
- 5.7. Rest of Asia Pacific
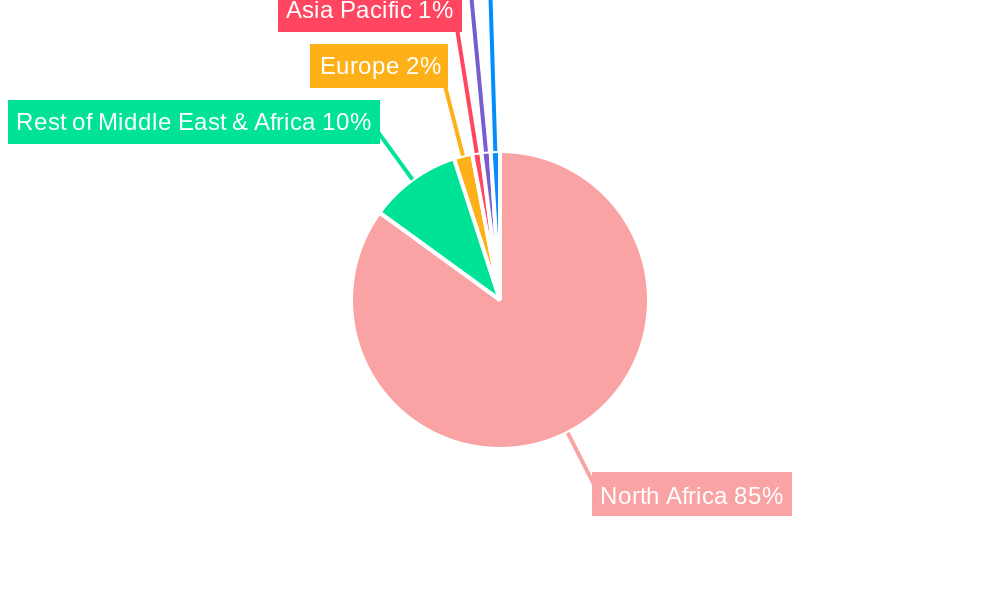
North Africa Refined Petroleum Products Market Regional Market Share
Geographic Coverage of North Africa Refined Petroleum Products Market
North Africa Refined Petroleum Products Market REPORT HIGHLIGHTS
| Aspects | Details |
|---|---|
| Study Period | 2020-2034 |
| Base Year | 2025 |
| Estimated Year | 2026 |
| Forecast Period | 2026-2034 |
| Historical Period | 2020-2025 |
| Growth Rate | CAGR of 5% from 2020-2034 |
| Segmentation |
|
Table of Contents
- 1. Introduction
- 1.1. Research Scope
- 1.2. Market Segmentation
- 1.3. Research Objective
- 1.4. Definitions and Assumptions
- 2. Executive Summary
- 2.1. Market Snapshot
- 3. Market Dynamics
- 3.1. Market Drivers
- 3.2. Market Restrains
- 3.3. Market Trends
- 3.4. Market Opportunities
- 4. Market Factor Analysis
- 4.1. Porters Five Forces
- 4.1.1. Bargaining Power of Suppliers
- 4.1.2. Bargaining Power of Buyers
- 4.1.3. Threat of New Entrants
- 4.1.4. Threat of Substitutes
- 4.1.5. Competitive Rivalry
- 4.2. PESTEL analysis
- 4.3. BCG Analysis
- 4.3.1. Stars (High Growth, High Market Share)
- 4.3.2. Cash Cows (Low Growth, High Market Share)
- 4.3.3. Question Mark (High Growth, Low Market Share)
- 4.3.4. Dogs (Low Growth, Low Market Share)
- 4.4. Ansoff Matrix Analysis
- 4.5. Supply Chain Analysis
- 4.6. Regulatory Landscape
- 4.7. Current Market Potential and Opportunity Assessment (TAM–SAM–SOM Framework)
- 4.8. IMR Analyst Note
- 4.1. Porters Five Forces
- 5. Market Analysis, Insights and Forecast 2021-2033
- 5.1. Market Analysis, Insights and Forecast - by Type
- 5.1.1. Light Distillates
- 5.1.2. Middle Distillates
- 5.1.3. Heavy Distillates
- 5.2. Market Analysis, Insights and Forecast - by Geogrpahy
- 5.2.1. Morocco
- 5.2.2. Algeria
- 5.2.3. Egypt
- 5.2.4. Rest of North Africa
- 5.3. Market Analysis, Insights and Forecast - by Region
- 5.3.1. North America
- 5.3.2. South America
- 5.3.3. Europe
- 5.3.4. Middle East & Africa
- 5.3.5. Asia Pacific
- 5.1. Market Analysis, Insights and Forecast - by Type
- 6. Global North Africa Refined Petroleum Products Market Analysis, Insights and Forecast, 2021-2033
- 6.1. Market Analysis, Insights and Forecast - by Type
- 6.1.1. Light Distillates
- 6.1.2. Middle Distillates
- 6.1.3. Heavy Distillates
- 6.2. Market Analysis, Insights and Forecast - by Geogrpahy
- 6.2.1. Morocco
- 6.2.2. Algeria
- 6.2.3. Egypt
- 6.2.4. Rest of North Africa
- 6.1. Market Analysis, Insights and Forecast - by Type
- 7. North America North Africa Refined Petroleum Products Market Analysis, Insights and Forecast, 2020-2032
- 7.1. Market Analysis, Insights and Forecast - by Type
- 7.1.1. Light Distillates
- 7.1.2. Middle Distillates
- 7.1.3. Heavy Distillates
- 7.2. Market Analysis, Insights and Forecast - by Geogrpahy
- 7.2.1. Morocco
- 7.2.2. Algeria
- 7.2.3. Egypt
- 7.2.4. Rest of North Africa
- 7.1. Market Analysis, Insights and Forecast - by Type
- 8. South America North Africa Refined Petroleum Products Market Analysis, Insights and Forecast, 2020-2032
- 8.1. Market Analysis, Insights and Forecast - by Type
- 8.1.1. Light Distillates
- 8.1.2. Middle Distillates
- 8.1.3. Heavy Distillates
- 8.2. Market Analysis, Insights and Forecast - by Geogrpahy
- 8.2.1. Morocco
- 8.2.2. Algeria
- 8.2.3. Egypt
- 8.2.4. Rest of North Africa
- 8.1. Market Analysis, Insights and Forecast - by Type
- 9. Europe North Africa Refined Petroleum Products Market Analysis, Insights and Forecast, 2020-2032
- 9.1. Market Analysis, Insights and Forecast - by Type
- 9.1.1. Light Distillates
- 9.1.2. Middle Distillates
- 9.1.3. Heavy Distillates
- 9.2. Market Analysis, Insights and Forecast - by Geogrpahy
- 9.2.1. Morocco
- 9.2.2. Algeria
- 9.2.3. Egypt
- 9.2.4. Rest of North Africa
- 9.1. Market Analysis, Insights and Forecast - by Type
- 10. Middle East & Africa North Africa Refined Petroleum Products Market Analysis, Insights and Forecast, 2020-2032
- 10.1. Market Analysis, Insights and Forecast - by Type
- 10.1.1. Light Distillates
- 10.1.2. Middle Distillates
- 10.1.3. Heavy Distillates
- 10.2. Market Analysis, Insights and Forecast - by Geogrpahy
- 10.2.1. Morocco
- 10.2.2. Algeria
- 10.2.3. Egypt
- 10.2.4. Rest of North Africa
- 10.1. Market Analysis, Insights and Forecast - by Type
- 11. Asia Pacific North Africa Refined Petroleum Products Market Analysis, Insights and Forecast, 2020-2032
- 11.1. Market Analysis, Insights and Forecast - by Type
- 11.1.1. Light Distillates
- 11.1.2. Middle Distillates
- 11.1.3. Heavy Distillates
- 11.2. Market Analysis, Insights and Forecast - by Geogrpahy
- 11.2.1. Morocco
- 11.2.2. Algeria
- 11.2.3. Egypt
- 11.2.4. Rest of North Africa
- 11.1. Market Analysis, Insights and Forecast - by Type
- 12. Competitive Analysis
- 12.1. Company Profiles
- 12.1.1 Nile Petroleum Corporation*List Not Exhaustive
- 12.1.1.1. Company Overview
- 12.1.1.2. Products
- 12.1.1.3. Company Financials
- 12.1.1.4. SWOT Analysis
- 12.1.2 Abu Dhabi National Energy Company
- 12.1.2.1. Company Overview
- 12.1.2.2. Products
- 12.1.2.3. Company Financials
- 12.1.2.4. SWOT Analysis
- 12.1.3 Exxon Mobil Corporation
- 12.1.3.1. Company Overview
- 12.1.3.2. Products
- 12.1.3.3. Company Financials
- 12.1.3.4. SWOT Analysis
- 12.1.4 Qalaa Holdings SAE
- 12.1.4.1. Company Overview
- 12.1.4.2. Products
- 12.1.4.3. Company Financials
- 12.1.4.4. SWOT Analysis
- 12.1.5 Royal Dutch Shell Plc
- 12.1.5.1. Company Overview
- 12.1.5.2. Products
- 12.1.5.3. Company Financials
- 12.1.5.4. SWOT Analysis
- 12.1.6 Total S A
- 12.1.6.1. Company Overview
- 12.1.6.2. Products
- 12.1.6.3. Company Financials
- 12.1.6.4. SWOT Analysis
- 12.1.7 Sonatrach SPA
- 12.1.7.1. Company Overview
- 12.1.7.2. Products
- 12.1.7.3. Company Financials
- 12.1.7.4. SWOT Analysis
- 12.1.1 Nile Petroleum Corporation*List Not Exhaustive
- 12.2. Market Entropy
- 12.2.1 Company's Key Areas Served
- 12.2.2 Recent Developments
- 12.3. Company Market Share Analysis 2025
- 12.3.1 Top 5 Companies Market Share Analysis
- 12.3.2 Top 3 Companies Market Share Analysis
- 12.4. List of Potential Customers
- 13. Research Methodology
List of Figures
- Figure 1: Global North Africa Refined Petroleum Products Market Revenue Breakdown (billion, %) by Region 2025 & 2033
- Figure 2: North America North Africa Refined Petroleum Products Market Revenue (billion), by Type 2025 & 2033
- Figure 3: North America North Africa Refined Petroleum Products Market Revenue Share (%), by Type 2025 & 2033
- Figure 4: North America North Africa Refined Petroleum Products Market Revenue (billion), by Geogrpahy 2025 & 2033
- Figure 5: North America North Africa Refined Petroleum Products Market Revenue Share (%), by Geogrpahy 2025 & 2033
- Figure 6: North America North Africa Refined Petroleum Products Market Revenue (billion), by Country 2025 & 2033
- Figure 7: North America North Africa Refined Petroleum Products Market Revenue Share (%), by Country 2025 & 2033
- Figure 8: South America North Africa Refined Petroleum Products Market Revenue (billion), by Type 2025 & 2033
- Figure 9: South America North Africa Refined Petroleum Products Market Revenue Share (%), by Type 2025 & 2033
- Figure 10: South America North Africa Refined Petroleum Products Market Revenue (billion), by Geogrpahy 2025 & 2033
- Figure 11: South America North Africa Refined Petroleum Products Market Revenue Share (%), by Geogrpahy 2025 & 2033
- Figure 12: South America North Africa Refined Petroleum Products Market Revenue (billion), by Country 2025 & 2033
- Figure 13: South America North Africa Refined Petroleum Products Market Revenue Share (%), by Country 2025 & 2033
- Figure 14: Europe North Africa Refined Petroleum Products Market Revenue (billion), by Type 2025 & 2033
- Figure 15: Europe North Africa Refined Petroleum Products Market Revenue Share (%), by Type 2025 & 2033
- Figure 16: Europe North Africa Refined Petroleum Products Market Revenue (billion), by Geogrpahy 2025 & 2033
- Figure 17: Europe North Africa Refined Petroleum Products Market Revenue Share (%), by Geogrpahy 2025 & 2033
- Figure 18: Europe North Africa Refined Petroleum Products Market Revenue (billion), by Country 2025 & 2033
- Figure 19: Europe North Africa Refined Petroleum Products Market Revenue Share (%), by Country 2025 & 2033
- Figure 20: Middle East & Africa North Africa Refined Petroleum Products Market Revenue (billion), by Type 2025 & 2033
- Figure 21: Middle East & Africa North Africa Refined Petroleum Products Market Revenue Share (%), by Type 2025 & 2033
- Figure 22: Middle East & Africa North Africa Refined Petroleum Products Market Revenue (billion), by Geogrpahy 2025 & 2033
- Figure 23: Middle East & Africa North Africa Refined Petroleum Products Market Revenue Share (%), by Geogrpahy 2025 & 2033
- Figure 24: Middle East & Africa North Africa Refined Petroleum Products Market Revenue (billion), by Country 2025 & 2033
- Figure 25: Middle East & Africa North Africa Refined Petroleum Products Market Revenue Share (%), by Country 2025 & 2033
- Figure 26: Asia Pacific North Africa Refined Petroleum Products Market Revenue (billion), by Type 2025 & 2033
- Figure 27: Asia Pacific North Africa Refined Petroleum Products Market Revenue Share (%), by Type 2025 & 2033
- Figure 28: Asia Pacific North Africa Refined Petroleum Products Market Revenue (billion), by Geogrpahy 2025 & 2033
- Figure 29: Asia Pacific North Africa Refined Petroleum Products Market Revenue Share (%), by Geogrpahy 2025 & 2033
- Figure 30: Asia Pacific North Africa Refined Petroleum Products Market Revenue (billion), by Country 2025 & 2033
- Figure 31: Asia Pacific North Africa Refined Petroleum Products Market Revenue Share (%), by Country 2025 & 2033
List of Tables
- Table 1: Global North Africa Refined Petroleum Products Market Revenue billion Forecast, by Type 2020 & 2033
- Table 2: Global North Africa Refined Petroleum Products Market Revenue billion Forecast, by Geogrpahy 2020 & 2033
- Table 3: Global North Africa Refined Petroleum Products Market Revenue billion Forecast, by Region 2020 & 2033
- Table 4: Global North Africa Refined Petroleum Products Market Revenue billion Forecast, by Type 2020 & 2033
- Table 5: Global North Africa Refined Petroleum Products Market Revenue billion Forecast, by Geogrpahy 2020 & 2033
- Table 6: Global North Africa Refined Petroleum Products Market Revenue billion Forecast, by Country 2020 & 2033
- Table 7: United States North Africa Refined Petroleum Products Market Revenue (billion) Forecast, by Application 2020 & 2033
- Table 8: Canada North Africa Refined Petroleum Products Market Revenue (billion) Forecast, by Application 2020 & 2033
- Table 9: Mexico North Africa Refined Petroleum Products Market Revenue (billion) Forecast, by Application 2020 & 2033
- Table 10: Global North Africa Refined Petroleum Products Market Revenue billion Forecast, by Type 2020 & 2033
- Table 11: Global North Africa Refined Petroleum Products Market Revenue billion Forecast, by Geogrpahy 2020 & 2033
- Table 12: Global North Africa Refined Petroleum Products Market Revenue billion Forecast, by Country 2020 & 2033
- Table 13: Brazil North Africa Refined Petroleum Products Market Revenue (billion) Forecast, by Application 2020 & 2033
- Table 14: Argentina North Africa Refined Petroleum Products Market Revenue (billion) Forecast, by Application 2020 & 2033
- Table 15: Rest of South America North Africa Refined Petroleum Products Market Revenue (billion) Forecast, by Application 2020 & 2033
- Table 16: Global North Africa Refined Petroleum Products Market Revenue billion Forecast, by Type 2020 & 2033
- Table 17: Global North Africa Refined Petroleum Products Market Revenue billion Forecast, by Geogrpahy 2020 & 2033
- Table 18: Global North Africa Refined Petroleum Products Market Revenue billion Forecast, by Country 2020 & 2033
- Table 19: United Kingdom North Africa Refined Petroleum Products Market Revenue (billion) Forecast, by Application 2020 & 2033
- Table 20: Germany North Africa Refined Petroleum Products Market Revenue (billion) Forecast, by Application 2020 & 2033
- Table 21: France North Africa Refined Petroleum Products Market Revenue (billion) Forecast, by Application 2020 & 2033
- Table 22: Italy North Africa Refined Petroleum Products Market Revenue (billion) Forecast, by Application 2020 & 2033
- Table 23: Spain North Africa Refined Petroleum Products Market Revenue (billion) Forecast, by Application 2020 & 2033
- Table 24: Russia North Africa Refined Petroleum Products Market Revenue (billion) Forecast, by Application 2020 & 2033
- Table 25: Benelux North Africa Refined Petroleum Products Market Revenue (billion) Forecast, by Application 2020 & 2033
- Table 26: Nordics North Africa Refined Petroleum Products Market Revenue (billion) Forecast, by Application 2020 & 2033
- Table 27: Rest of Europe North Africa Refined Petroleum Products Market Revenue (billion) Forecast, by Application 2020 & 2033
- Table 28: Global North Africa Refined Petroleum Products Market Revenue billion Forecast, by Type 2020 & 2033
- Table 29: Global North Africa Refined Petroleum Products Market Revenue billion Forecast, by Geogrpahy 2020 & 2033
- Table 30: Global North Africa Refined Petroleum Products Market Revenue billion Forecast, by Country 2020 & 2033
- Table 31: Turkey North Africa Refined Petroleum Products Market Revenue (billion) Forecast, by Application 2020 & 2033
- Table 32: Israel North Africa Refined Petroleum Products Market Revenue (billion) Forecast, by Application 2020 & 2033
- Table 33: GCC North Africa Refined Petroleum Products Market Revenue (billion) Forecast, by Application 2020 & 2033
- Table 34: North Africa North Africa Refined Petroleum Products Market Revenue (billion) Forecast, by Application 2020 & 2033
- Table 35: South Africa North Africa Refined Petroleum Products Market Revenue (billion) Forecast, by Application 2020 & 2033
- Table 36: Rest of Middle East & Africa North Africa Refined Petroleum Products Market Revenue (billion) Forecast, by Application 2020 & 2033
- Table 37: Global North Africa Refined Petroleum Products Market Revenue billion Forecast, by Type 2020 & 2033
- Table 38: Global North Africa Refined Petroleum Products Market Revenue billion Forecast, by Geogrpahy 2020 & 2033
- Table 39: Global North Africa Refined Petroleum Products Market Revenue billion Forecast, by Country 2020 & 2033
- Table 40: China North Africa Refined Petroleum Products Market Revenue (billion) Forecast, by Application 2020 & 2033
- Table 41: India North Africa Refined Petroleum Products Market Revenue (billion) Forecast, by Application 2020 & 2033
- Table 42: Japan North Africa Refined Petroleum Products Market Revenue (billion) Forecast, by Application 2020 & 2033
- Table 43: South Korea North Africa Refined Petroleum Products Market Revenue (billion) Forecast, by Application 2020 & 2033
- Table 44: ASEAN North Africa Refined Petroleum Products Market Revenue (billion) Forecast, by Application 2020 & 2033
- Table 45: Oceania North Africa Refined Petroleum Products Market Revenue (billion) Forecast, by Application 2020 & 2033
- Table 46: Rest of Asia Pacific North Africa Refined Petroleum Products Market Revenue (billion) Forecast, by Application 2020 & 2033
Frequently Asked Questions
1. What is the projected Compound Annual Growth Rate (CAGR) of the North Africa Refined Petroleum Products Market?
The projected CAGR is approximately 5%.
2. Which companies are prominent players in the North Africa Refined Petroleum Products Market?
Key companies in the market include Nile Petroleum Corporation*List Not Exhaustive, Abu Dhabi National Energy Company, Exxon Mobil Corporation, Qalaa Holdings SAE, Royal Dutch Shell Plc, Total S A, Sonatrach SPA.
3. What are the main segments of the North Africa Refined Petroleum Products Market?
The market segments include Type, Geogrpahy.
4. Can you provide details about the market size?
The market size is estimated to be USD 611.94 billion as of 2022.
5. What are some drivers contributing to market growth?
4.; Urbanization and Infrastructure Development4.; Increasing Renewable Power Generation.
6. What are the notable trends driving market growth?
Middle Distillates to Dominate the Market.
7. Are there any restraints impacting market growth?
4.; Grid Infrastructure Challenges.
8. Can you provide examples of recent developments in the market?
N/A
9. What pricing options are available for accessing the report?
Pricing options include single-user, multi-user, and enterprise licenses priced at USD 4750, USD 5250, and USD 8750 respectively.
10. Is the market size provided in terms of value or volume?
The market size is provided in terms of value, measured in billion.
11. Are there any specific market keywords associated with the report?
Yes, the market keyword associated with the report is "North Africa Refined Petroleum Products Market," which aids in identifying and referencing the specific market segment covered.
12. How do I determine which pricing option suits my needs best?
The pricing options vary based on user requirements and access needs. Individual users may opt for single-user licenses, while businesses requiring broader access may choose multi-user or enterprise licenses for cost-effective access to the report.
13. Are there any additional resources or data provided in the North Africa Refined Petroleum Products Market report?
While the report offers comprehensive insights, it's advisable to review the specific contents or supplementary materials provided to ascertain if additional resources or data are available.
14. How can I stay updated on further developments or reports in the North Africa Refined Petroleum Products Market?
To stay informed about further developments, trends, and reports in the North Africa Refined Petroleum Products Market, consider subscribing to industry newsletters, following relevant companies and organizations, or regularly checking reputable industry news sources and publications.
Methodology
Step 1 - Identification of Relevant Samples Size from Population Database


Step 2 - Approaches for Defining Global Market Size (Value, Volume* & Price*)

Note*: In applicable scenarios
Step 3 - Data Sources
Primary Research
- Web Analytics
- Survey Reports
- Research Institute
- Latest Research Reports
- Opinion Leaders
Secondary Research
- Annual Reports
- White Paper
- Latest Press Release
- Industry Association
- Paid Database
- Investor Presentations

Step 4 - Data Triangulation
Involves using different sources of information in order to increase the validity of a study
These sources are likely to be stakeholders in a program - participants, other researchers, program staff, other community members, and so on.
Then we put all data in single framework & apply various statistical tools to find out the dynamic on the market.
During the analysis stage, feedback from the stakeholder groups would be compared to determine areas of agreement as well as areas of divergence