

Key Insights
The Oil & Gas Digital Transformation market is poised for substantial growth, driven by the imperative for enhanced operational efficiency, stringent safety standards, and improved sustainability across the sector. Projected to expand at a Compound Annual Growth Rate (CAGR) of 17%, the market is expected to reach approximately 90.44 billion by 2025. This digital evolution is powered by several key technologies. Big data analytics and cloud computing are instrumental in streamlining operations, refining decision-making, and reducing costs. The Internet of Things (IoT) enables real-time asset monitoring and predictive maintenance, thereby minimizing downtime and optimizing resource allocation. Artificial intelligence (AI) and machine learning are enhancing automation, optimizing production processes, and bolstering safety protocols. Extended reality (AR/VR/MR) is transforming training and maintenance through immersive experiences, improving skill development and operational effectiveness. Advancements in field devices, including sensors and smart motors, provide critical data for superior operational insights and control. The market’s segmentation across upstream, midstream, and downstream operations highlights widespread digital adoption throughout the oil and gas value chain.
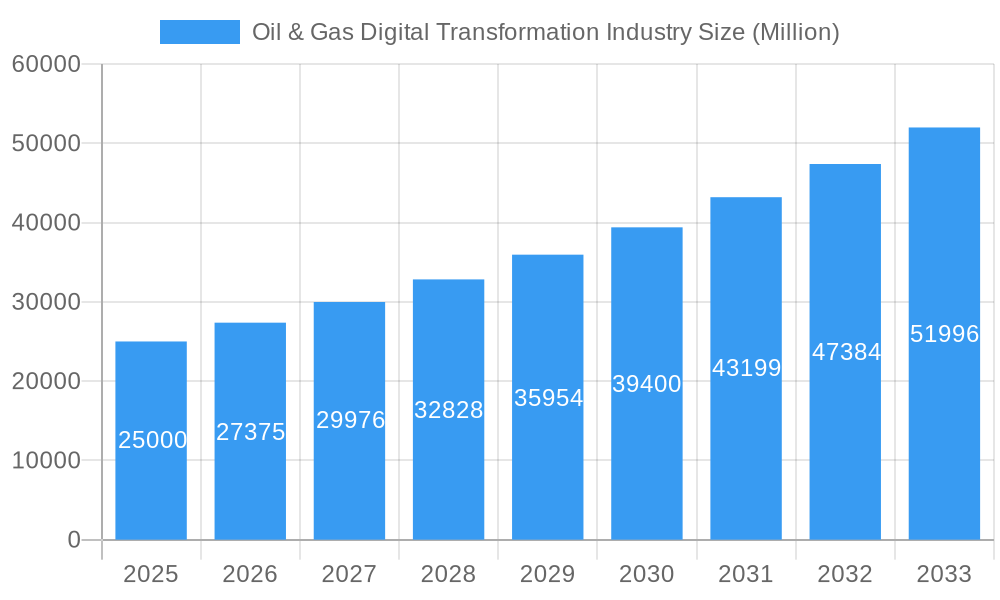
Oil & Gas Digital Transformation Industry Market Size (In Billion)
Geographically, North America, the Middle East, and Asia-Pacific are anticipated to lead market penetration due to significant digital infrastructure investments and concentrated oil and gas activities. Europe and Latin America are also projected for considerable growth, influenced by regulatory demands for sustainability and efficiency enhancements. Leading industry players such as Honeywell, ABB, IBM, and Siemens are actively shaping the market with innovative solutions and strategic collaborations, accelerating the digital transformation. The competitive environment is dynamic, characterized by established companies and emerging technology providers striving for market share, which fosters continuous innovation and enhanced offerings for oil and gas enterprises. This sustained competition ensures the ongoing development and expansion of digital solutions, promising further advancements in efficiency, safety, and profitability within the oil and gas sector.
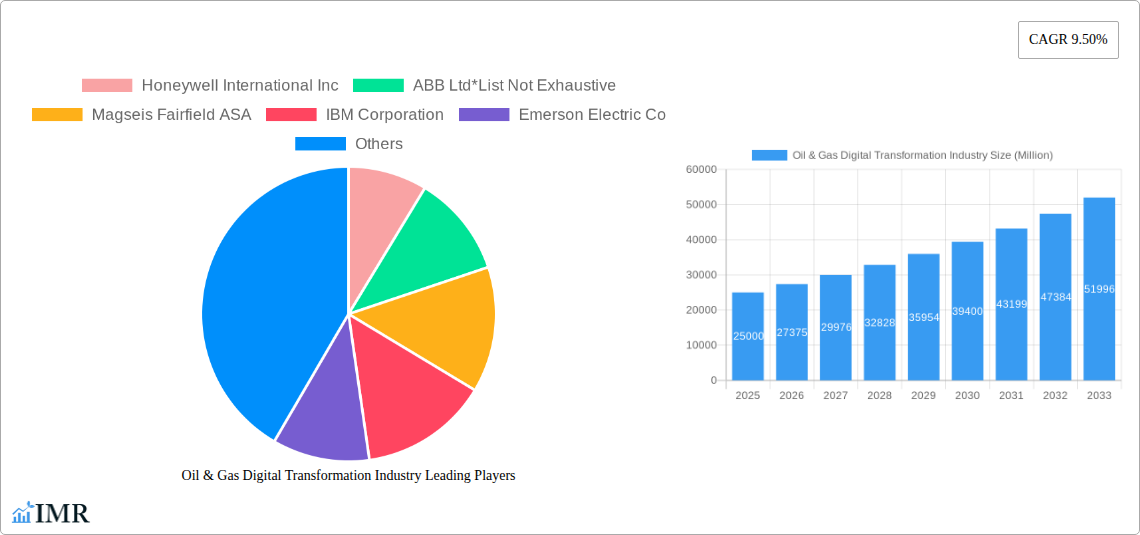
Oil & Gas Digital Transformation Industry Company Market Share
Oil & Gas Digital Transformation Market Report: 2019-2033
This comprehensive report provides a detailed analysis of the Oil & Gas Digital Transformation market, encompassing market dynamics, growth trends, regional segmentation, product landscape, key players, and future outlook. The study period spans from 2019 to 2033, with 2025 serving as the base and estimated year. The report is essential for industry professionals, investors, and strategic decision-makers seeking insights into this rapidly evolving sector. The market is segmented by Oil and Gas Industry Activity (Upstream, Midstream, Downstream) and by Enabling Technologies (Big Data/Analytics and Cloud Computing, IoT, AI, Industrial Control Systems, Extended Reality, Field Devices). The market size is projected in millions of USD.
Oil & Gas Digital Transformation Industry Market Dynamics & Structure
The Oil & Gas Digital Transformation market is characterized by a moderately concentrated structure, with several large multinational corporations and specialized technology providers vying for market share. Technological innovation, particularly in areas like AI, IoT, and cloud computing, is a key driver, pushing the adoption of advanced solutions for enhanced efficiency, safety, and sustainability. Stringent regulatory frameworks focusing on environmental protection and operational safety significantly influence market dynamics. The market also witnesses competitive pressure from alternative solutions, including legacy systems and niche players. M&A activity has been significant, with large players acquiring smaller technology firms to expand their offerings.
- Market Concentration: Moderately concentrated, with top 10 players holding an estimated xx% market share in 2025.
- Technological Innovation: AI, IoT, and cloud computing are primary drivers of innovation.
- Regulatory Framework: Stringent environmental and safety regulations are key influencers.
- Competitive Substitutes: Legacy systems and specialized niche solutions pose competitive challenges.
- M&A Activity: Significant consolidation through acquisitions, with xx deals recorded from 2019-2024.
- Innovation Barriers: High initial investment costs, integration complexity, and cybersecurity concerns hinder widespread adoption.
Oil & Gas Digital Transformation Industry Growth Trends & Insights
The Oil & Gas Digital Transformation market experienced significant growth between 2019 and 2024, driven by increasing demand for enhanced operational efficiency, improved safety, and reduced environmental impact. The market size reached xx million USD in 2024, and it is projected to reach xx million USD in 2025, exhibiting a CAGR of xx% during the forecast period (2025-2033). This growth is further propelled by the rising adoption of digital technologies across the upstream, midstream, and downstream segments of the oil and gas industry. The increasing availability of big data and advancements in analytics capabilities are also contributing to market expansion. Furthermore, a growing focus on predictive maintenance and real-time monitoring is boosting market demand. Consumer behavior shifts towards greater sustainability and responsible resource management are driving further adoption of digital solutions.
Dominant Regions, Countries, or Segments in Oil & Gas Digital Transformation Industry
North America and Europe currently dominate the Oil & Gas Digital Transformation market, driven by high technological adoption rates and a robust regulatory framework promoting digitalization. Within these regions, the Upstream segment holds the largest market share, followed by the Downstream segment. The high concentration of oil and gas operations in these regions, combined with substantial investments in digital technologies, fuels market growth. In terms of enabling technologies, Big Data/Analytics and Cloud Computing and IoT are experiencing rapid adoption.
- Leading Region: North America, driven by high technology adoption and investment.
- Key Country: The United States, due to its large oil and gas sector and technological advancement.
- Dominant Segment (Industry Activity): Upstream, due to its high potential for efficiency gains and safety improvements.
- Dominant Segment (Enabling Technologies): Big Data/Analytics and Cloud Computing, owing to their broad applicability and cost-effectiveness.
- Growth Drivers: Favorable government policies, robust infrastructure, high technological awareness, and significant investments in R&D.
Oil & Gas Digital Transformation Industry Product Landscape
The Oil & Gas Digital Transformation market offers a diverse range of products and solutions, including advanced analytics platforms, IoT-enabled sensors, AI-powered predictive maintenance tools, and cloud-based data management systems. These solutions address various industry needs, from optimizing production processes and enhancing asset management to improving safety and environmental performance. Key product innovations focus on improved scalability, enhanced data security, and seamless integration with existing infrastructure. Unique selling propositions often include improved accuracy, real-time insights, and reduced operational costs.
Key Drivers, Barriers & Challenges in Oil & Gas Digital Transformation Industry
Key Drivers: The primary drivers of market growth are the need for improved operational efficiency, enhanced safety, reduced environmental impact, and increased profitability. Technological advancements in AI, IoT, and cloud computing are creating new opportunities for optimization. Favorable government policies promoting digitalization in the oil and gas sector are further driving market expansion.
Challenges and Restraints: High upfront investment costs, cybersecurity risks, data integration complexities, and the need for skilled workforce represent significant barriers to wider adoption. Regulatory uncertainties and the lack of standardized protocols can also impede market growth. Supply chain disruptions and talent shortages further add to the challenges. An estimated xx million USD in potential market growth is hampered by these challenges annually.
Emerging Opportunities in Oil & Gas Digital Transformation Industry
Emerging opportunities include the application of Extended Reality (XR) technologies for training and remote operations, advancements in digital twin technology for predictive maintenance, and the utilization of blockchain for supply chain transparency and enhanced security. Untapped markets in developing economies, particularly in regions with significant oil and gas reserves, present substantial growth potential. Growing concerns about climate change and environmental sustainability are also driving demand for greener digital solutions.
Growth Accelerators in the Oil & Gas Digital Transformation Industry Industry
Long-term growth will be significantly accelerated by continued technological innovation, strategic partnerships between oil and gas companies and technology providers, and market expansion into new geographical regions. Government initiatives promoting digitalization, coupled with increased investment in research and development, will further boost market growth. The increasing adoption of cloud-based solutions and the development of more user-friendly interfaces will also drive market expansion.
Key Players Shaping the Oil & Gas Digital Transformation Market
- Honeywell International Inc
- ABB Ltd
- Magseis Fairfield ASA
- IBM Corporation
- Emerson Electric Co
- Mitsubishi Electric Corporation
- Siemens AG
- Schneider Electric SE
- WFS Technologies Ltd
- Fanuc Corporation
- Omron Corporation
- Rockwell Automation Inc
- Rohrback Cosasco Systems Inc
- Yokogawa Electric Corporation
Notable Milestones in Oil & Gas Digital Transformation Industry Sector
- October 2021: Emerson announced a multi-year agreement with BayoTech, valued at xx million USD, to accelerate hydrogen delivery globally using Emerson's automation technologies.
- March 2022: Kyndryl signed a five-year, USD 160 million agreement with Motiva Enterprises to streamline IT services and accelerate Motiva's cloud adoption. This highlights the growing demand for comprehensive digital transformation services in the refining sector.
In-Depth Oil & Gas Digital Transformation Industry Market Outlook
The Oil & Gas Digital Transformation market is poised for robust growth in the coming years, driven by the increasing adoption of advanced technologies, the growing need for operational efficiency, and the imperative for environmental sustainability. Strategic partnerships, innovative product development, and expansion into new markets will be crucial for success in this dynamic sector. Companies that effectively leverage AI, IoT, and cloud computing will be best positioned to capitalize on the significant opportunities that lie ahead. The market is expected to reach xx million USD by 2033, representing substantial growth potential for both established players and emerging entrants.
Oil & Gas Digital Transformation Industry Segmentation
-
1. Enabling Technologies
- 1.1. Big Data/Analytics and Cloud Computing
- 1.2. Internet of Things (IoT)
- 1.3. Artificial Intelligence
- 1.4. Industri
- 1.5. Extended Reality (AR, VR and MR)
- 1.6. Field Devices (Sensors, Motors, VFD etc.)
-
2. Oil and Gas Industry Activity
- 2.1. Upstream
- 2.2. Mid Stream
- 2.3. Downstream
Oil & Gas Digital Transformation Industry Segmentation By Geography
-
1. North America
- 1.1. United States
- 1.2. Canada
-
2. Europe
- 2.1. Germany
- 2.2. United Kingdom
- 2.3. France
- 2.4. Rest of Europe
-
3. Asia Pacific
- 3.1. China
- 3.2. Japan
- 3.3. India
- 3.4. Rest of the Asia Pacific
-
4. Latin America
- 4.1. Brazil
- 4.2. Argentina
- 4.3. Rest of Latin America
-
5. Middle East and Africa
- 5.1. United Arab Emirates
- 5.2. Saudi Arabia
- 5.3. Rest of Middle East and Africa
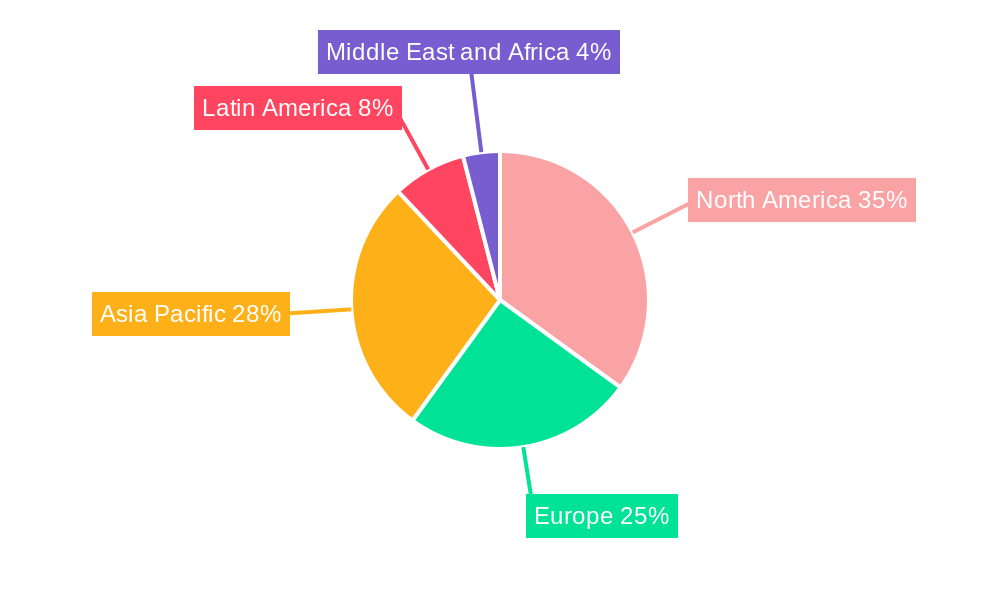
Oil & Gas Digital Transformation Industry Regional Market Share
Geographic Coverage of Oil & Gas Digital Transformation Industry
Oil & Gas Digital Transformation Industry REPORT HIGHLIGHTS
| Aspects | Details |
|---|---|
| Study Period | 2020-2034 |
| Base Year | 2025 |
| Estimated Year | 2026 |
| Forecast Period | 2026-2034 |
| Historical Period | 2020-2025 |
| Growth Rate | CAGR of 17% from 2020-2034 |
| Segmentation |
|
Table of Contents
- 1. Introduction
- 1.1. Research Scope
- 1.2. Market Segmentation
- 1.3. Research Objective
- 1.4. Definitions and Assumptions
- 2. Executive Summary
- 2.1. Market Snapshot
- 3. Market Dynamics
- 3.1. Market Drivers
- 3.2. Market Restrains
- 3.3. Market Trends
- 3.4. Market Opportunities
- 4. Market Factor Analysis
- 4.1. Porters Five Forces
- 4.1.1. Bargaining Power of Suppliers
- 4.1.2. Bargaining Power of Buyers
- 4.1.3. Threat of New Entrants
- 4.1.4. Threat of Substitutes
- 4.1.5. Competitive Rivalry
- 4.2. PESTEL analysis
- 4.3. BCG Analysis
- 4.3.1. Stars (High Growth, High Market Share)
- 4.3.2. Cash Cows (Low Growth, High Market Share)
- 4.3.3. Question Mark (High Growth, Low Market Share)
- 4.3.4. Dogs (Low Growth, Low Market Share)
- 4.4. Ansoff Matrix Analysis
- 4.5. Supply Chain Analysis
- 4.6. Regulatory Landscape
- 4.7. Current Market Potential and Opportunity Assessment (TAM–SAM–SOM Framework)
- 4.8. IMR Analyst Note
- 4.1. Porters Five Forces
- 5. Market Analysis, Insights and Forecast 2021-2033
- 5.1. Market Analysis, Insights and Forecast - by Enabling Technologies
- 5.1.1. Big Data/Analytics and Cloud Computing
- 5.1.2. Internet of Things (IoT)
- 5.1.3. Artificial Intelligence
- 5.1.4. Industri
- 5.1.5. Extended Reality (AR, VR and MR)
- 5.1.6. Field Devices (Sensors, Motors, VFD etc.)
- 5.2. Market Analysis, Insights and Forecast - by Oil and Gas Industry Activity
- 5.2.1. Upstream
- 5.2.2. Mid Stream
- 5.2.3. Downstream
- 5.3. Market Analysis, Insights and Forecast - by Region
- 5.3.1. North America
- 5.3.2. Europe
- 5.3.3. Asia Pacific
- 5.3.4. Latin America
- 5.3.5. Middle East and Africa
- 5.1. Market Analysis, Insights and Forecast - by Enabling Technologies
- 6. Global Oil & Gas Digital Transformation Industry Analysis, Insights and Forecast, 2021-2033
- 6.1. Market Analysis, Insights and Forecast - by Enabling Technologies
- 6.1.1. Big Data/Analytics and Cloud Computing
- 6.1.2. Internet of Things (IoT)
- 6.1.3. Artificial Intelligence
- 6.1.4. Industri
- 6.1.5. Extended Reality (AR, VR and MR)
- 6.1.6. Field Devices (Sensors, Motors, VFD etc.)
- 6.2. Market Analysis, Insights and Forecast - by Oil and Gas Industry Activity
- 6.2.1. Upstream
- 6.2.2. Mid Stream
- 6.2.3. Downstream
- 6.1. Market Analysis, Insights and Forecast - by Enabling Technologies
- 7. North America Oil & Gas Digital Transformation Industry Analysis, Insights and Forecast, 2020-2032
- 7.1. Market Analysis, Insights and Forecast - by Enabling Technologies
- 7.1.1. Big Data/Analytics and Cloud Computing
- 7.1.2. Internet of Things (IoT)
- 7.1.3. Artificial Intelligence
- 7.1.4. Industri
- 7.1.5. Extended Reality (AR, VR and MR)
- 7.1.6. Field Devices (Sensors, Motors, VFD etc.)
- 7.2. Market Analysis, Insights and Forecast - by Oil and Gas Industry Activity
- 7.2.1. Upstream
- 7.2.2. Mid Stream
- 7.2.3. Downstream
- 7.1. Market Analysis, Insights and Forecast - by Enabling Technologies
- 8. Europe Oil & Gas Digital Transformation Industry Analysis, Insights and Forecast, 2020-2032
- 8.1. Market Analysis, Insights and Forecast - by Enabling Technologies
- 8.1.1. Big Data/Analytics and Cloud Computing
- 8.1.2. Internet of Things (IoT)
- 8.1.3. Artificial Intelligence
- 8.1.4. Industri
- 8.1.5. Extended Reality (AR, VR and MR)
- 8.1.6. Field Devices (Sensors, Motors, VFD etc.)
- 8.2. Market Analysis, Insights and Forecast - by Oil and Gas Industry Activity
- 8.2.1. Upstream
- 8.2.2. Mid Stream
- 8.2.3. Downstream
- 8.1. Market Analysis, Insights and Forecast - by Enabling Technologies
- 9. Asia Pacific Oil & Gas Digital Transformation Industry Analysis, Insights and Forecast, 2020-2032
- 9.1. Market Analysis, Insights and Forecast - by Enabling Technologies
- 9.1.1. Big Data/Analytics and Cloud Computing
- 9.1.2. Internet of Things (IoT)
- 9.1.3. Artificial Intelligence
- 9.1.4. Industri
- 9.1.5. Extended Reality (AR, VR and MR)
- 9.1.6. Field Devices (Sensors, Motors, VFD etc.)
- 9.2. Market Analysis, Insights and Forecast - by Oil and Gas Industry Activity
- 9.2.1. Upstream
- 9.2.2. Mid Stream
- 9.2.3. Downstream
- 9.1. Market Analysis, Insights and Forecast - by Enabling Technologies
- 10. Latin America Oil & Gas Digital Transformation Industry Analysis, Insights and Forecast, 2020-2032
- 10.1. Market Analysis, Insights and Forecast - by Enabling Technologies
- 10.1.1. Big Data/Analytics and Cloud Computing
- 10.1.2. Internet of Things (IoT)
- 10.1.3. Artificial Intelligence
- 10.1.4. Industri
- 10.1.5. Extended Reality (AR, VR and MR)
- 10.1.6. Field Devices (Sensors, Motors, VFD etc.)
- 10.2. Market Analysis, Insights and Forecast - by Oil and Gas Industry Activity
- 10.2.1. Upstream
- 10.2.2. Mid Stream
- 10.2.3. Downstream
- 10.1. Market Analysis, Insights and Forecast - by Enabling Technologies
- 11. Middle East and Africa Oil & Gas Digital Transformation Industry Analysis, Insights and Forecast, 2020-2032
- 11.1. Market Analysis, Insights and Forecast - by Enabling Technologies
- 11.1.1. Big Data/Analytics and Cloud Computing
- 11.1.2. Internet of Things (IoT)
- 11.1.3. Artificial Intelligence
- 11.1.4. Industri
- 11.1.5. Extended Reality (AR, VR and MR)
- 11.1.6. Field Devices (Sensors, Motors, VFD etc.)
- 11.2. Market Analysis, Insights and Forecast - by Oil and Gas Industry Activity
- 11.2.1. Upstream
- 11.2.2. Mid Stream
- 11.2.3. Downstream
- 11.1. Market Analysis, Insights and Forecast - by Enabling Technologies
- 12. Competitive Analysis
- 12.1. Company Profiles
- 12.1.1 Honeywell International Inc
- 12.1.1.1. Company Overview
- 12.1.1.2. Products
- 12.1.1.3. Company Financials
- 12.1.1.4. SWOT Analysis
- 12.1.2 ABB Ltd*List Not Exhaustive
- 12.1.2.1. Company Overview
- 12.1.2.2. Products
- 12.1.2.3. Company Financials
- 12.1.2.4. SWOT Analysis
- 12.1.3 Magseis Fairfield ASA
- 12.1.3.1. Company Overview
- 12.1.3.2. Products
- 12.1.3.3. Company Financials
- 12.1.3.4. SWOT Analysis
- 12.1.4 IBM Corporation
- 12.1.4.1. Company Overview
- 12.1.4.2. Products
- 12.1.4.3. Company Financials
- 12.1.4.4. SWOT Analysis
- 12.1.5 Emerson Electric Co
- 12.1.5.1. Company Overview
- 12.1.5.2. Products
- 12.1.5.3. Company Financials
- 12.1.5.4. SWOT Analysis
- 12.1.6 Mitsubishi Electric Corporation
- 12.1.6.1. Company Overview
- 12.1.6.2. Products
- 12.1.6.3. Company Financials
- 12.1.6.4. SWOT Analysis
- 12.1.7 Siemens AG
- 12.1.7.1. Company Overview
- 12.1.7.2. Products
- 12.1.7.3. Company Financials
- 12.1.7.4. SWOT Analysis
- 12.1.8 Schneider Electric SE
- 12.1.8.1. Company Overview
- 12.1.8.2. Products
- 12.1.8.3. Company Financials
- 12.1.8.4. SWOT Analysis
- 12.1.9 WFS Technologies Ltd
- 12.1.9.1. Company Overview
- 12.1.9.2. Products
- 12.1.9.3. Company Financials
- 12.1.9.4. SWOT Analysis
- 12.1.10 Fanuc Corporation
- 12.1.10.1. Company Overview
- 12.1.10.2. Products
- 12.1.10.3. Company Financials
- 12.1.10.4. SWOT Analysis
- 12.1.11 Omron Corporation
- 12.1.11.1. Company Overview
- 12.1.11.2. Products
- 12.1.11.3. Company Financials
- 12.1.11.4. SWOT Analysis
- 12.1.12 Rockwell Automation Inc
- 12.1.12.1. Company Overview
- 12.1.12.2. Products
- 12.1.12.3. Company Financials
- 12.1.12.4. SWOT Analysis
- 12.1.13 Rohrback Cosasco Systems Inc
- 12.1.13.1. Company Overview
- 12.1.13.2. Products
- 12.1.13.3. Company Financials
- 12.1.13.4. SWOT Analysis
- 12.1.14 Yokogawa Electric Corporation
- 12.1.14.1. Company Overview
- 12.1.14.2. Products
- 12.1.14.3. Company Financials
- 12.1.14.4. SWOT Analysis
- 12.1.1 Honeywell International Inc
- 12.2. Market Entropy
- 12.2.1 Company's Key Areas Served
- 12.2.2 Recent Developments
- 12.3. Company Market Share Analysis 2025
- 12.3.1 Top 5 Companies Market Share Analysis
- 12.3.2 Top 3 Companies Market Share Analysis
- 12.4. List of Potential Customers
- 13. Research Methodology
List of Figures
- Figure 1: Global Oil & Gas Digital Transformation Industry Revenue Breakdown (billion, %) by Region 2025 & 2033
- Figure 2: North America Oil & Gas Digital Transformation Industry Revenue (billion), by Enabling Technologies 2025 & 2033
- Figure 3: North America Oil & Gas Digital Transformation Industry Revenue Share (%), by Enabling Technologies 2025 & 2033
- Figure 4: North America Oil & Gas Digital Transformation Industry Revenue (billion), by Oil and Gas Industry Activity 2025 & 2033
- Figure 5: North America Oil & Gas Digital Transformation Industry Revenue Share (%), by Oil and Gas Industry Activity 2025 & 2033
- Figure 6: North America Oil & Gas Digital Transformation Industry Revenue (billion), by Country 2025 & 2033
- Figure 7: North America Oil & Gas Digital Transformation Industry Revenue Share (%), by Country 2025 & 2033
- Figure 8: Europe Oil & Gas Digital Transformation Industry Revenue (billion), by Enabling Technologies 2025 & 2033
- Figure 9: Europe Oil & Gas Digital Transformation Industry Revenue Share (%), by Enabling Technologies 2025 & 2033
- Figure 10: Europe Oil & Gas Digital Transformation Industry Revenue (billion), by Oil and Gas Industry Activity 2025 & 2033
- Figure 11: Europe Oil & Gas Digital Transformation Industry Revenue Share (%), by Oil and Gas Industry Activity 2025 & 2033
- Figure 12: Europe Oil & Gas Digital Transformation Industry Revenue (billion), by Country 2025 & 2033
- Figure 13: Europe Oil & Gas Digital Transformation Industry Revenue Share (%), by Country 2025 & 2033
- Figure 14: Asia Pacific Oil & Gas Digital Transformation Industry Revenue (billion), by Enabling Technologies 2025 & 2033
- Figure 15: Asia Pacific Oil & Gas Digital Transformation Industry Revenue Share (%), by Enabling Technologies 2025 & 2033
- Figure 16: Asia Pacific Oil & Gas Digital Transformation Industry Revenue (billion), by Oil and Gas Industry Activity 2025 & 2033
- Figure 17: Asia Pacific Oil & Gas Digital Transformation Industry Revenue Share (%), by Oil and Gas Industry Activity 2025 & 2033
- Figure 18: Asia Pacific Oil & Gas Digital Transformation Industry Revenue (billion), by Country 2025 & 2033
- Figure 19: Asia Pacific Oil & Gas Digital Transformation Industry Revenue Share (%), by Country 2025 & 2033
- Figure 20: Latin America Oil & Gas Digital Transformation Industry Revenue (billion), by Enabling Technologies 2025 & 2033
- Figure 21: Latin America Oil & Gas Digital Transformation Industry Revenue Share (%), by Enabling Technologies 2025 & 2033
- Figure 22: Latin America Oil & Gas Digital Transformation Industry Revenue (billion), by Oil and Gas Industry Activity 2025 & 2033
- Figure 23: Latin America Oil & Gas Digital Transformation Industry Revenue Share (%), by Oil and Gas Industry Activity 2025 & 2033
- Figure 24: Latin America Oil & Gas Digital Transformation Industry Revenue (billion), by Country 2025 & 2033
- Figure 25: Latin America Oil & Gas Digital Transformation Industry Revenue Share (%), by Country 2025 & 2033
- Figure 26: Middle East and Africa Oil & Gas Digital Transformation Industry Revenue (billion), by Enabling Technologies 2025 & 2033
- Figure 27: Middle East and Africa Oil & Gas Digital Transformation Industry Revenue Share (%), by Enabling Technologies 2025 & 2033
- Figure 28: Middle East and Africa Oil & Gas Digital Transformation Industry Revenue (billion), by Oil and Gas Industry Activity 2025 & 2033
- Figure 29: Middle East and Africa Oil & Gas Digital Transformation Industry Revenue Share (%), by Oil and Gas Industry Activity 2025 & 2033
- Figure 30: Middle East and Africa Oil & Gas Digital Transformation Industry Revenue (billion), by Country 2025 & 2033
- Figure 31: Middle East and Africa Oil & Gas Digital Transformation Industry Revenue Share (%), by Country 2025 & 2033
List of Tables
- Table 1: Global Oil & Gas Digital Transformation Industry Revenue billion Forecast, by Enabling Technologies 2020 & 2033
- Table 2: Global Oil & Gas Digital Transformation Industry Revenue billion Forecast, by Oil and Gas Industry Activity 2020 & 2033
- Table 3: Global Oil & Gas Digital Transformation Industry Revenue billion Forecast, by Region 2020 & 2033
- Table 4: Global Oil & Gas Digital Transformation Industry Revenue billion Forecast, by Enabling Technologies 2020 & 2033
- Table 5: Global Oil & Gas Digital Transformation Industry Revenue billion Forecast, by Oil and Gas Industry Activity 2020 & 2033
- Table 6: Global Oil & Gas Digital Transformation Industry Revenue billion Forecast, by Country 2020 & 2033
- Table 7: United States Oil & Gas Digital Transformation Industry Revenue (billion) Forecast, by Application 2020 & 2033
- Table 8: Canada Oil & Gas Digital Transformation Industry Revenue (billion) Forecast, by Application 2020 & 2033
- Table 9: Global Oil & Gas Digital Transformation Industry Revenue billion Forecast, by Enabling Technologies 2020 & 2033
- Table 10: Global Oil & Gas Digital Transformation Industry Revenue billion Forecast, by Oil and Gas Industry Activity 2020 & 2033
- Table 11: Global Oil & Gas Digital Transformation Industry Revenue billion Forecast, by Country 2020 & 2033
- Table 12: Germany Oil & Gas Digital Transformation Industry Revenue (billion) Forecast, by Application 2020 & 2033
- Table 13: United Kingdom Oil & Gas Digital Transformation Industry Revenue (billion) Forecast, by Application 2020 & 2033
- Table 14: France Oil & Gas Digital Transformation Industry Revenue (billion) Forecast, by Application 2020 & 2033
- Table 15: Rest of Europe Oil & Gas Digital Transformation Industry Revenue (billion) Forecast, by Application 2020 & 2033
- Table 16: Global Oil & Gas Digital Transformation Industry Revenue billion Forecast, by Enabling Technologies 2020 & 2033
- Table 17: Global Oil & Gas Digital Transformation Industry Revenue billion Forecast, by Oil and Gas Industry Activity 2020 & 2033
- Table 18: Global Oil & Gas Digital Transformation Industry Revenue billion Forecast, by Country 2020 & 2033
- Table 19: China Oil & Gas Digital Transformation Industry Revenue (billion) Forecast, by Application 2020 & 2033
- Table 20: Japan Oil & Gas Digital Transformation Industry Revenue (billion) Forecast, by Application 2020 & 2033
- Table 21: India Oil & Gas Digital Transformation Industry Revenue (billion) Forecast, by Application 2020 & 2033
- Table 22: Rest of the Asia Pacific Oil & Gas Digital Transformation Industry Revenue (billion) Forecast, by Application 2020 & 2033
- Table 23: Global Oil & Gas Digital Transformation Industry Revenue billion Forecast, by Enabling Technologies 2020 & 2033
- Table 24: Global Oil & Gas Digital Transformation Industry Revenue billion Forecast, by Oil and Gas Industry Activity 2020 & 2033
- Table 25: Global Oil & Gas Digital Transformation Industry Revenue billion Forecast, by Country 2020 & 2033
- Table 26: Brazil Oil & Gas Digital Transformation Industry Revenue (billion) Forecast, by Application 2020 & 2033
- Table 27: Argentina Oil & Gas Digital Transformation Industry Revenue (billion) Forecast, by Application 2020 & 2033
- Table 28: Rest of Latin America Oil & Gas Digital Transformation Industry Revenue (billion) Forecast, by Application 2020 & 2033
- Table 29: Global Oil & Gas Digital Transformation Industry Revenue billion Forecast, by Enabling Technologies 2020 & 2033
- Table 30: Global Oil & Gas Digital Transformation Industry Revenue billion Forecast, by Oil and Gas Industry Activity 2020 & 2033
- Table 31: Global Oil & Gas Digital Transformation Industry Revenue billion Forecast, by Country 2020 & 2033
- Table 32: United Arab Emirates Oil & Gas Digital Transformation Industry Revenue (billion) Forecast, by Application 2020 & 2033
- Table 33: Saudi Arabia Oil & Gas Digital Transformation Industry Revenue (billion) Forecast, by Application 2020 & 2033
- Table 34: Rest of Middle East and Africa Oil & Gas Digital Transformation Industry Revenue (billion) Forecast, by Application 2020 & 2033
Frequently Asked Questions
1. What is the projected Compound Annual Growth Rate (CAGR) of the Oil & Gas Digital Transformation Industry?
The projected CAGR is approximately 17%.
2. Which companies are prominent players in the Oil & Gas Digital Transformation Industry?
Key companies in the market include Honeywell International Inc, ABB Ltd*List Not Exhaustive, Magseis Fairfield ASA, IBM Corporation, Emerson Electric Co, Mitsubishi Electric Corporation, Siemens AG, Schneider Electric SE, WFS Technologies Ltd, Fanuc Corporation, Omron Corporation, Rockwell Automation Inc, Rohrback Cosasco Systems Inc, Yokogawa Electric Corporation.
3. What are the main segments of the Oil & Gas Digital Transformation Industry?
The market segments include Enabling Technologies, Oil and Gas Industry Activity.
4. Can you provide details about the market size?
The market size is estimated to be USD 90.44 billion as of 2022.
5. What are some drivers contributing to market growth?
Increasing Need to Implement Disruptive Technologies to Optimize Operations & Increase Safety; Regulatory Requirements.
6. What are the notable trends driving market growth?
Downstream Sector is Expected to Witness Major Market Share.
7. Are there any restraints impacting market growth?
; Trade Tensions and Implementation Challenges.
8. Can you provide examples of recent developments in the market?
March 2022 - Kyndryl, an IT infrastructure services provider, signed a five-year, USD 160 million agreement with Motiva Enterprises, owner of North America's largest refinery. Under this agreement, Kyndryl is set to streamline Motiva's IT services, accelerate Motiva's cloud journey, and set the foundation for its enterprise-wide digital transformation.
9. What pricing options are available for accessing the report?
Pricing options include single-user, multi-user, and enterprise licenses priced at USD 4750, USD 5250, and USD 8750 respectively.
10. Is the market size provided in terms of value or volume?
The market size is provided in terms of value, measured in billion.
11. Are there any specific market keywords associated with the report?
Yes, the market keyword associated with the report is "Oil & Gas Digital Transformation Industry," which aids in identifying and referencing the specific market segment covered.
12. How do I determine which pricing option suits my needs best?
The pricing options vary based on user requirements and access needs. Individual users may opt for single-user licenses, while businesses requiring broader access may choose multi-user or enterprise licenses for cost-effective access to the report.
13. Are there any additional resources or data provided in the Oil & Gas Digital Transformation Industry report?
While the report offers comprehensive insights, it's advisable to review the specific contents or supplementary materials provided to ascertain if additional resources or data are available.
14. How can I stay updated on further developments or reports in the Oil & Gas Digital Transformation Industry?
To stay informed about further developments, trends, and reports in the Oil & Gas Digital Transformation Industry, consider subscribing to industry newsletters, following relevant companies and organizations, or regularly checking reputable industry news sources and publications.
Methodology
Step 1 - Identification of Relevant Samples Size from Population Database


Step 2 - Approaches for Defining Global Market Size (Value, Volume* & Price*)

Note*: In applicable scenarios
Step 3 - Data Sources
Primary Research
- Web Analytics
- Survey Reports
- Research Institute
- Latest Research Reports
- Opinion Leaders
Secondary Research
- Annual Reports
- White Paper
- Latest Press Release
- Industry Association
- Paid Database
- Investor Presentations

Step 4 - Data Triangulation
Involves using different sources of information in order to increase the validity of a study
These sources are likely to be stakeholders in a program - participants, other researchers, program staff, other community members, and so on.
Then we put all data in single framework & apply various statistical tools to find out the dynamic on the market.
During the analysis stage, feedback from the stakeholder groups would be compared to determine areas of agreement as well as areas of divergence