

Key Insights
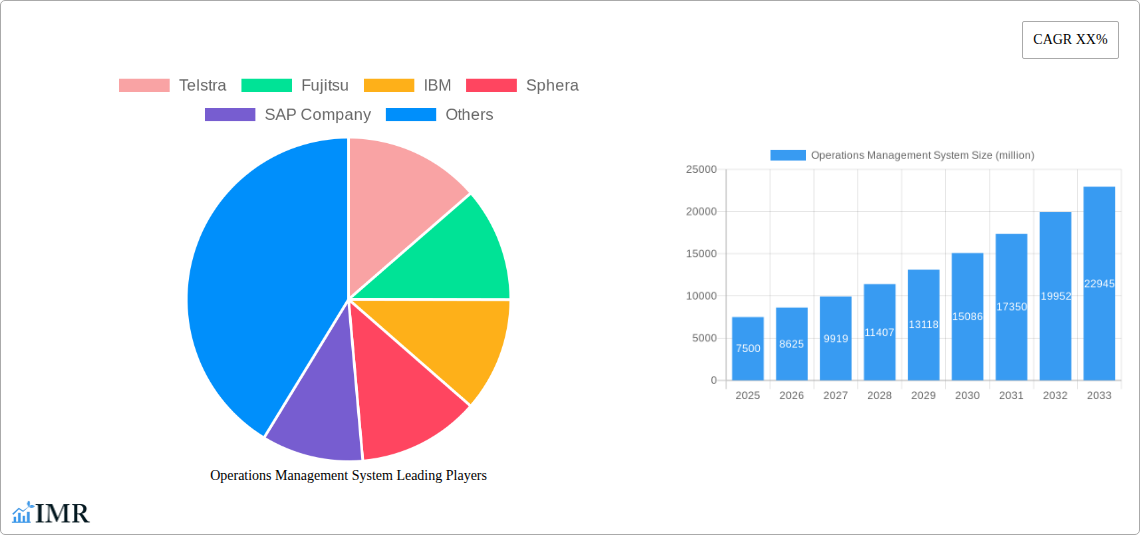
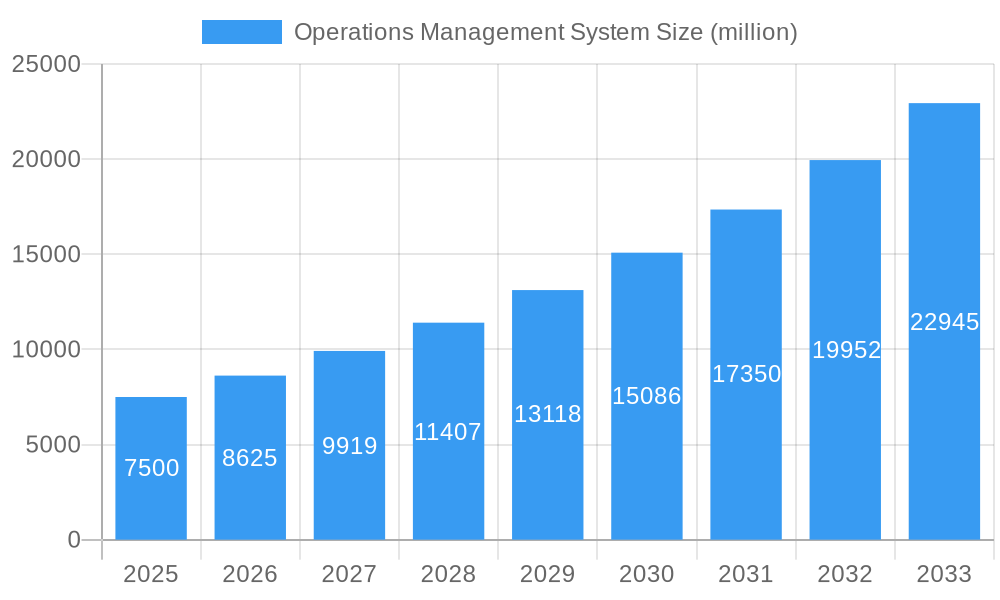
The Operations Management System (OMS) market is poised for significant expansion, driven by the imperative for businesses to elevate operational efficiency and productivity. With a projected market size of $10.59 billion in the base year 2025, the market is anticipated to grow at a robust CAGR of 12.02%. This growth trajectory underscores the increasing adoption of advanced OMS solutions by enterprises globally. Key catalysts for this expansion include the widespread integration of cloud-based OMS, offering enhanced scalability, cost-efficiency, and accessibility. Furthermore, the growing reliance on data analytics empowers organizations to make informed, data-driven decisions, thereby optimizing resource allocation and streamlining operational workflows. The incorporation of Artificial Intelligence (AI) and Machine Learning (ML) technologies is instrumental in driving automation and predictive capabilities, leading to improved overall performance and reduced operational expenditures. Additionally, stringent regulatory compliance requirements across diverse industries are mandating the deployment of sophisticated OMS solutions for effective risk mitigation and adherence. Prominent market players such as Telstra, Fujitsu, IBM, Sphera, SAP, Hitachi, Kapture, and Integrify are actively shaping this dynamic market through continuous innovation and strategic alliances.
Operations Management System Market Size (In Billion)
Market segmentation highlights substantial growth opportunities across key industry verticals including manufacturing, healthcare, and finance. Geographically, North America and Europe currently lead the market share, with the Asia-Pacific region expected to experience considerable growth, fueled by accelerating digitalization and infrastructure development initiatives. Challenges, such as initial implementation costs and the demand for skilled professionals, are being addressed through evolving market dynamics and technological advancements. The long-term outlook for the OMS market remains exceptionally positive, propelled by ongoing technological innovations and the persistent pursuit of operational excellence across all business sectors.
Operations Management System Company Market Share
Operations Management System (OMS) Market Report: 2019-2033
This comprehensive report provides an in-depth analysis of the Operations Management System (OMS) market, encompassing market dynamics, growth trends, regional dominance, product landscape, key players, and future outlook. The study covers the period 2019-2033, with a focus on the forecast period 2025-2033, using 2025 as the base year and estimated year. The report is invaluable for industry professionals, investors, and businesses seeking to understand and capitalize on the opportunities within this rapidly evolving market. The market is segmented by [insert segments here, e.g., industry, deployment type, organization size]. Parent Market: Enterprise Resource Planning (ERP) Software; Child Market: Manufacturing Execution Systems (MES).
Operations Management System Market Dynamics & Structure
The global OMS market, valued at $xx million in 2025, is experiencing significant growth driven by technological advancements, increasing demand for operational efficiency, and stringent regulatory compliance requirements. Market concentration is moderate, with key players such as Telstra, Fujitsu, IBM, Sphera, SAP, Hitachi, Kapture, and Integrify holding significant market share. However, the market is characterized by intense competition and continuous innovation.
- Market Concentration: The top 5 players hold approximately xx% of the market share in 2025.
- Technological Innovation: AI, Machine Learning, and IoT integration are key drivers, enhancing predictive analytics and automation capabilities.
- Regulatory Frameworks: Compliance needs (e.g., GDPR, industry-specific regulations) are pushing OMS adoption.
- Competitive Product Substitutes: Generic ERP systems and stand-alone solutions pose competitive threats.
- End-User Demographics: Manufacturing, logistics, healthcare, and finance sectors are major adopters.
- M&A Trends: An estimated xx M&A deals occurred between 2019 and 2024, with an average deal value of $xx million. Consolidation is expected to continue. Innovation barriers include high initial investment costs and integration complexities.
Operations Management System Growth Trends & Insights
The OMS market is projected to exhibit a Compound Annual Growth Rate (CAGR) of xx% during the forecast period (2025-2033), reaching a value of $xx million by 2033. This growth is fueled by several factors including the increasing adoption of cloud-based OMS solutions, the growing need for real-time data visibility, and the rising demand for improved supply chain resilience. Market penetration is currently at xx% and is expected to reach xx% by 2033, driven by increased awareness of the benefits of OMS solutions and decreasing implementation costs. Technological disruptions, such as the rise of AI-powered optimization tools, are accelerating market growth and changing consumer behavior towards more data-driven decision making.
Dominant Regions, Countries, or Segments in Operations Management System
North America currently holds the largest market share, driven by high technological adoption rates, robust infrastructure, and the presence of major OMS vendors. However, the Asia-Pacific region is projected to experience the highest CAGR during the forecast period due to rapid industrialization, increasing investments in digital transformation initiatives, and a growing focus on operational excellence.
- North America: Strong presence of major players, high technological adoption, and established regulatory frameworks.
- Europe: Growing adoption driven by stringent regulatory compliance and increasing focus on digitalization.
- Asia-Pacific: Highest growth potential due to rapid industrialization and increasing investments in digital technologies.
- Key Drivers: Government initiatives supporting digital transformation, increasing investments in infrastructure, and rising demand for improved operational efficiency.
Operations Management System Product Landscape
OMS solutions are increasingly incorporating advanced analytics, AI, and machine learning capabilities to provide real-time insights, predictive analytics, and automated decision-making functionalities. Unique selling propositions include improved efficiency, reduced operational costs, enhanced compliance, and improved decision-making. Technological advancements such as cloud computing, IoT integration, and blockchain technology are enhancing the functionality and scalability of OMS solutions.
Key Drivers, Barriers & Challenges in Operations Management System
Key Drivers: The primary drivers include the need for improved operational efficiency, enhanced supply chain visibility, and the increasing adoption of digital transformation strategies across various industries. Technological advancements, favorable government policies supporting digitalization, and the rising demand for real-time data analytics are also contributing to market growth.
Challenges and Restraints: High implementation costs, integration complexities, lack of skilled workforce, and data security concerns pose significant challenges. Supply chain disruptions can also negatively impact the adoption and effective utilization of OMS solutions. The estimated impact of these challenges is a reduction in market growth by approximately xx% over the forecast period.
Emerging Opportunities in Operations Management System
Emerging opportunities include the expanding adoption of OMS solutions in untapped markets, such as the healthcare and education sectors. The integration of advanced technologies, such as blockchain and AI, offers significant potential for innovation and improved operational performance. Evolving consumer preferences towards sustainable and ethical business practices are also creating opportunities for OMS vendors offering environmentally friendly and socially responsible solutions.
Growth Accelerators in the Operations Management System Industry
Long-term growth will be significantly accelerated by technological breakthroughs in areas such as AI and machine learning, enabling the development of more sophisticated and efficient OMS solutions. Strategic partnerships between OMS providers and other technology companies will enhance the integration of OMS with other enterprise systems and expand market reach. Furthermore, expanding into new geographical markets and focusing on industry-specific solutions will further drive market growth.
Notable Milestones in Operations Management System Sector
- 2020: Launch of AI-powered predictive analytics module by [Company Name].
- 2021: Acquisition of [Company A] by [Company B], expanding market reach.
- 2022: Introduction of cloud-based OMS solution by [Company Name], improving accessibility and scalability.
- 2023: Release of industry-specific OMS module for the manufacturing sector by [Company Name].
- 2024: Partnership between [Company A] and [Company B] for integrated OMS and ERP solutions.
In-Depth Operations Management System Market Outlook
The OMS market is poised for continued strong growth, driven by sustained technological advancements, increased digital adoption across industries, and ongoing demand for improved operational efficiency. Strategic opportunities for vendors include focusing on the development of AI-powered solutions, expanding into emerging markets, and establishing strong strategic partnerships to leverage complementary technologies and enhance market reach. The future of the OMS market is bright, promising significant growth and innovation over the next decade.
Operations Management System Segmentation
-
1. Application
- 1.1. Commercial
- 1.2. Industrial
- 1.3. Government
- 1.4. Other
-
2. Type
- 2.1. Cloud Based
- 2.2. On Premise
Operations Management System Segmentation By Geography
-
1. North America
- 1.1. United States
- 1.2. Canada
- 1.3. Mexico
-
2. South America
- 2.1. Brazil
- 2.2. Argentina
- 2.3. Rest of South America
-
3. Europe
- 3.1. United Kingdom
- 3.2. Germany
- 3.3. France
- 3.4. Italy
- 3.5. Spain
- 3.6. Russia
- 3.7. Benelux
- 3.8. Nordics
- 3.9. Rest of Europe
-
4. Middle East & Africa
- 4.1. Turkey
- 4.2. Israel
- 4.3. GCC
- 4.4. North Africa
- 4.5. South Africa
- 4.6. Rest of Middle East & Africa
-
5. Asia Pacific
- 5.1. China
- 5.2. India
- 5.3. Japan
- 5.4. South Korea
- 5.5. ASEAN
- 5.6. Oceania
- 5.7. Rest of Asia Pacific
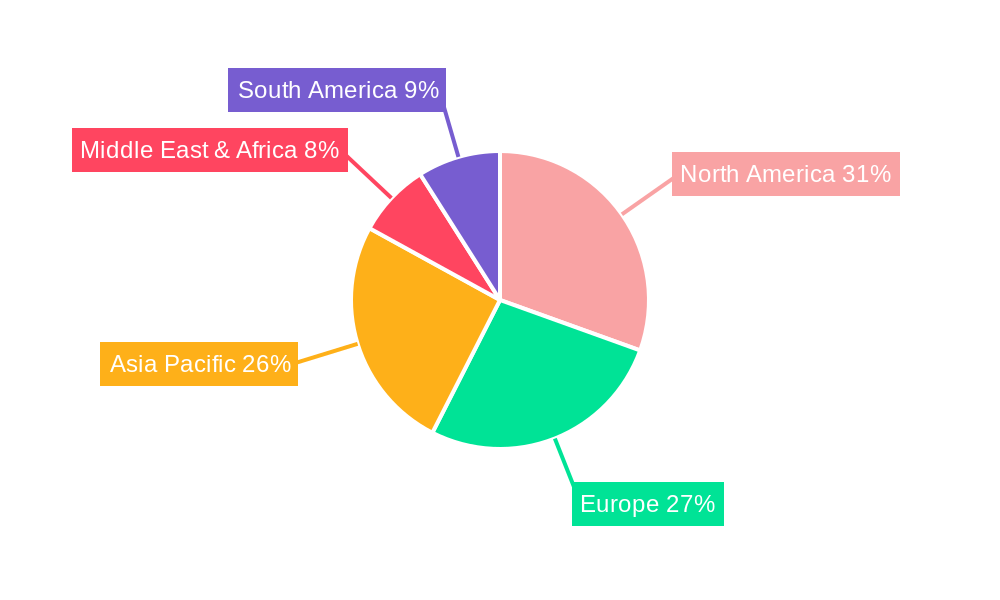
Operations Management System Regional Market Share
Geographic Coverage of Operations Management System
Operations Management System REPORT HIGHLIGHTS
| Aspects | Details |
|---|---|
| Study Period | 2020-2034 |
| Base Year | 2025 |
| Estimated Year | 2026 |
| Forecast Period | 2026-2034 |
| Historical Period | 2020-2025 |
| Growth Rate | CAGR of 12.02% from 2020-2034 |
| Segmentation |
|
Table of Contents
- 1. Introduction
- 1.1. Research Scope
- 1.2. Market Segmentation
- 1.3. Research Methodology
- 1.4. Definitions and Assumptions
- 2. Executive Summary
- 2.1. Introduction
- 3. Market Dynamics
- 3.1. Introduction
- 3.2. Market Drivers
- 3.3. Market Restrains
- 3.4. Market Trends
- 4. Market Factor Analysis
- 4.1. Porters Five Forces
- 4.2. Supply/Value Chain
- 4.3. PESTEL analysis
- 4.4. Market Entropy
- 4.5. Patent/Trademark Analysis
- 5. Global Operations Management System Analysis, Insights and Forecast, 2020-2032
- 5.1. Market Analysis, Insights and Forecast - by Application
- 5.1.1. Commercial
- 5.1.2. Industrial
- 5.1.3. Government
- 5.1.4. Other
- 5.2. Market Analysis, Insights and Forecast - by Type
- 5.2.1. Cloud Based
- 5.2.2. On Premise
- 5.3. Market Analysis, Insights and Forecast - by Region
- 5.3.1. North America
- 5.3.2. South America
- 5.3.3. Europe
- 5.3.4. Middle East & Africa
- 5.3.5. Asia Pacific
- 5.1. Market Analysis, Insights and Forecast - by Application
- 6. North America Operations Management System Analysis, Insights and Forecast, 2020-2032
- 6.1. Market Analysis, Insights and Forecast - by Application
- 6.1.1. Commercial
- 6.1.2. Industrial
- 6.1.3. Government
- 6.1.4. Other
- 6.2. Market Analysis, Insights and Forecast - by Type
- 6.2.1. Cloud Based
- 6.2.2. On Premise
- 6.1. Market Analysis, Insights and Forecast - by Application
- 7. South America Operations Management System Analysis, Insights and Forecast, 2020-2032
- 7.1. Market Analysis, Insights and Forecast - by Application
- 7.1.1. Commercial
- 7.1.2. Industrial
- 7.1.3. Government
- 7.1.4. Other
- 7.2. Market Analysis, Insights and Forecast - by Type
- 7.2.1. Cloud Based
- 7.2.2. On Premise
- 7.1. Market Analysis, Insights and Forecast - by Application
- 8. Europe Operations Management System Analysis, Insights and Forecast, 2020-2032
- 8.1. Market Analysis, Insights and Forecast - by Application
- 8.1.1. Commercial
- 8.1.2. Industrial
- 8.1.3. Government
- 8.1.4. Other
- 8.2. Market Analysis, Insights and Forecast - by Type
- 8.2.1. Cloud Based
- 8.2.2. On Premise
- 8.1. Market Analysis, Insights and Forecast - by Application
- 9. Middle East & Africa Operations Management System Analysis, Insights and Forecast, 2020-2032
- 9.1. Market Analysis, Insights and Forecast - by Application
- 9.1.1. Commercial
- 9.1.2. Industrial
- 9.1.3. Government
- 9.1.4. Other
- 9.2. Market Analysis, Insights and Forecast - by Type
- 9.2.1. Cloud Based
- 9.2.2. On Premise
- 9.1. Market Analysis, Insights and Forecast - by Application
- 10. Asia Pacific Operations Management System Analysis, Insights and Forecast, 2020-2032
- 10.1. Market Analysis, Insights and Forecast - by Application
- 10.1.1. Commercial
- 10.1.2. Industrial
- 10.1.3. Government
- 10.1.4. Other
- 10.2. Market Analysis, Insights and Forecast - by Type
- 10.2.1. Cloud Based
- 10.2.2. On Premise
- 10.1. Market Analysis, Insights and Forecast - by Application
- 11. Competitive Analysis
- 11.1. Global Market Share Analysis 2025
- 11.2. Company Profiles
- 11.2.1 Telstra
- 11.2.1.1. Overview
- 11.2.1.2. Products
- 11.2.1.3. SWOT Analysis
- 11.2.1.4. Recent Developments
- 11.2.1.5. Financials (Based on Availability)
- 11.2.2 Fujitsu
- 11.2.2.1. Overview
- 11.2.2.2. Products
- 11.2.2.3. SWOT Analysis
- 11.2.2.4. Recent Developments
- 11.2.2.5. Financials (Based on Availability)
- 11.2.3 IBM
- 11.2.3.1. Overview
- 11.2.3.2. Products
- 11.2.3.3. SWOT Analysis
- 11.2.3.4. Recent Developments
- 11.2.3.5. Financials (Based on Availability)
- 11.2.4 Sphera
- 11.2.4.1. Overview
- 11.2.4.2. Products
- 11.2.4.3. SWOT Analysis
- 11.2.4.4. Recent Developments
- 11.2.4.5. Financials (Based on Availability)
- 11.2.5 SAP Company
- 11.2.5.1. Overview
- 11.2.5.2. Products
- 11.2.5.3. SWOT Analysis
- 11.2.5.4. Recent Developments
- 11.2.5.5. Financials (Based on Availability)
- 11.2.6 Hitachi
- 11.2.6.1. Overview
- 11.2.6.2. Products
- 11.2.6.3. SWOT Analysis
- 11.2.6.4. Recent Developments
- 11.2.6.5. Financials (Based on Availability)
- 11.2.7 Kapture
- 11.2.7.1. Overview
- 11.2.7.2. Products
- 11.2.7.3. SWOT Analysis
- 11.2.7.4. Recent Developments
- 11.2.7.5. Financials (Based on Availability)
- 11.2.8 Integrify
- 11.2.8.1. Overview
- 11.2.8.2. Products
- 11.2.8.3. SWOT Analysis
- 11.2.8.4. Recent Developments
- 11.2.8.5. Financials (Based on Availability)
- 11.2.1 Telstra
List of Figures
- Figure 1: Global Operations Management System Revenue Breakdown (billion, %) by Region 2025 & 2033
- Figure 2: North America Operations Management System Revenue (billion), by Application 2025 & 2033
- Figure 3: North America Operations Management System Revenue Share (%), by Application 2025 & 2033
- Figure 4: North America Operations Management System Revenue (billion), by Type 2025 & 2033
- Figure 5: North America Operations Management System Revenue Share (%), by Type 2025 & 2033
- Figure 6: North America Operations Management System Revenue (billion), by Country 2025 & 2033
- Figure 7: North America Operations Management System Revenue Share (%), by Country 2025 & 2033
- Figure 8: South America Operations Management System Revenue (billion), by Application 2025 & 2033
- Figure 9: South America Operations Management System Revenue Share (%), by Application 2025 & 2033
- Figure 10: South America Operations Management System Revenue (billion), by Type 2025 & 2033
- Figure 11: South America Operations Management System Revenue Share (%), by Type 2025 & 2033
- Figure 12: South America Operations Management System Revenue (billion), by Country 2025 & 2033
- Figure 13: South America Operations Management System Revenue Share (%), by Country 2025 & 2033
- Figure 14: Europe Operations Management System Revenue (billion), by Application 2025 & 2033
- Figure 15: Europe Operations Management System Revenue Share (%), by Application 2025 & 2033
- Figure 16: Europe Operations Management System Revenue (billion), by Type 2025 & 2033
- Figure 17: Europe Operations Management System Revenue Share (%), by Type 2025 & 2033
- Figure 18: Europe Operations Management System Revenue (billion), by Country 2025 & 2033
- Figure 19: Europe Operations Management System Revenue Share (%), by Country 2025 & 2033
- Figure 20: Middle East & Africa Operations Management System Revenue (billion), by Application 2025 & 2033
- Figure 21: Middle East & Africa Operations Management System Revenue Share (%), by Application 2025 & 2033
- Figure 22: Middle East & Africa Operations Management System Revenue (billion), by Type 2025 & 2033
- Figure 23: Middle East & Africa Operations Management System Revenue Share (%), by Type 2025 & 2033
- Figure 24: Middle East & Africa Operations Management System Revenue (billion), by Country 2025 & 2033
- Figure 25: Middle East & Africa Operations Management System Revenue Share (%), by Country 2025 & 2033
- Figure 26: Asia Pacific Operations Management System Revenue (billion), by Application 2025 & 2033
- Figure 27: Asia Pacific Operations Management System Revenue Share (%), by Application 2025 & 2033
- Figure 28: Asia Pacific Operations Management System Revenue (billion), by Type 2025 & 2033
- Figure 29: Asia Pacific Operations Management System Revenue Share (%), by Type 2025 & 2033
- Figure 30: Asia Pacific Operations Management System Revenue (billion), by Country 2025 & 2033
- Figure 31: Asia Pacific Operations Management System Revenue Share (%), by Country 2025 & 2033
List of Tables
- Table 1: Global Operations Management System Revenue billion Forecast, by Application 2020 & 2033
- Table 2: Global Operations Management System Revenue billion Forecast, by Type 2020 & 2033
- Table 3: Global Operations Management System Revenue billion Forecast, by Region 2020 & 2033
- Table 4: Global Operations Management System Revenue billion Forecast, by Application 2020 & 2033
- Table 5: Global Operations Management System Revenue billion Forecast, by Type 2020 & 2033
- Table 6: Global Operations Management System Revenue billion Forecast, by Country 2020 & 2033
- Table 7: United States Operations Management System Revenue (billion) Forecast, by Application 2020 & 2033
- Table 8: Canada Operations Management System Revenue (billion) Forecast, by Application 2020 & 2033
- Table 9: Mexico Operations Management System Revenue (billion) Forecast, by Application 2020 & 2033
- Table 10: Global Operations Management System Revenue billion Forecast, by Application 2020 & 2033
- Table 11: Global Operations Management System Revenue billion Forecast, by Type 2020 & 2033
- Table 12: Global Operations Management System Revenue billion Forecast, by Country 2020 & 2033
- Table 13: Brazil Operations Management System Revenue (billion) Forecast, by Application 2020 & 2033
- Table 14: Argentina Operations Management System Revenue (billion) Forecast, by Application 2020 & 2033
- Table 15: Rest of South America Operations Management System Revenue (billion) Forecast, by Application 2020 & 2033
- Table 16: Global Operations Management System Revenue billion Forecast, by Application 2020 & 2033
- Table 17: Global Operations Management System Revenue billion Forecast, by Type 2020 & 2033
- Table 18: Global Operations Management System Revenue billion Forecast, by Country 2020 & 2033
- Table 19: United Kingdom Operations Management System Revenue (billion) Forecast, by Application 2020 & 2033
- Table 20: Germany Operations Management System Revenue (billion) Forecast, by Application 2020 & 2033
- Table 21: France Operations Management System Revenue (billion) Forecast, by Application 2020 & 2033
- Table 22: Italy Operations Management System Revenue (billion) Forecast, by Application 2020 & 2033
- Table 23: Spain Operations Management System Revenue (billion) Forecast, by Application 2020 & 2033
- Table 24: Russia Operations Management System Revenue (billion) Forecast, by Application 2020 & 2033
- Table 25: Benelux Operations Management System Revenue (billion) Forecast, by Application 2020 & 2033
- Table 26: Nordics Operations Management System Revenue (billion) Forecast, by Application 2020 & 2033
- Table 27: Rest of Europe Operations Management System Revenue (billion) Forecast, by Application 2020 & 2033
- Table 28: Global Operations Management System Revenue billion Forecast, by Application 2020 & 2033
- Table 29: Global Operations Management System Revenue billion Forecast, by Type 2020 & 2033
- Table 30: Global Operations Management System Revenue billion Forecast, by Country 2020 & 2033
- Table 31: Turkey Operations Management System Revenue (billion) Forecast, by Application 2020 & 2033
- Table 32: Israel Operations Management System Revenue (billion) Forecast, by Application 2020 & 2033
- Table 33: GCC Operations Management System Revenue (billion) Forecast, by Application 2020 & 2033
- Table 34: North Africa Operations Management System Revenue (billion) Forecast, by Application 2020 & 2033
- Table 35: South Africa Operations Management System Revenue (billion) Forecast, by Application 2020 & 2033
- Table 36: Rest of Middle East & Africa Operations Management System Revenue (billion) Forecast, by Application 2020 & 2033
- Table 37: Global Operations Management System Revenue billion Forecast, by Application 2020 & 2033
- Table 38: Global Operations Management System Revenue billion Forecast, by Type 2020 & 2033
- Table 39: Global Operations Management System Revenue billion Forecast, by Country 2020 & 2033
- Table 40: China Operations Management System Revenue (billion) Forecast, by Application 2020 & 2033
- Table 41: India Operations Management System Revenue (billion) Forecast, by Application 2020 & 2033
- Table 42: Japan Operations Management System Revenue (billion) Forecast, by Application 2020 & 2033
- Table 43: South Korea Operations Management System Revenue (billion) Forecast, by Application 2020 & 2033
- Table 44: ASEAN Operations Management System Revenue (billion) Forecast, by Application 2020 & 2033
- Table 45: Oceania Operations Management System Revenue (billion) Forecast, by Application 2020 & 2033
- Table 46: Rest of Asia Pacific Operations Management System Revenue (billion) Forecast, by Application 2020 & 2033
Frequently Asked Questions
1. What is the projected Compound Annual Growth Rate (CAGR) of the Operations Management System?
The projected CAGR is approximately 12.02%.
2. Which companies are prominent players in the Operations Management System?
Key companies in the market include Telstra, Fujitsu, IBM, Sphera, SAP Company, Hitachi, Kapture, Integrify.
3. What are the main segments of the Operations Management System?
The market segments include Application, Type.
4. Can you provide details about the market size?
The market size is estimated to be USD 10.59 billion as of 2022.
5. What are some drivers contributing to market growth?
N/A
6. What are the notable trends driving market growth?
N/A
7. Are there any restraints impacting market growth?
N/A
8. Can you provide examples of recent developments in the market?
N/A
9. What pricing options are available for accessing the report?
Pricing options include single-user, multi-user, and enterprise licenses priced at USD 2900.00, USD 4350.00, and USD 5800.00 respectively.
10. Is the market size provided in terms of value or volume?
The market size is provided in terms of value, measured in billion.
11. Are there any specific market keywords associated with the report?
Yes, the market keyword associated with the report is "Operations Management System," which aids in identifying and referencing the specific market segment covered.
12. How do I determine which pricing option suits my needs best?
The pricing options vary based on user requirements and access needs. Individual users may opt for single-user licenses, while businesses requiring broader access may choose multi-user or enterprise licenses for cost-effective access to the report.
13. Are there any additional resources or data provided in the Operations Management System report?
While the report offers comprehensive insights, it's advisable to review the specific contents or supplementary materials provided to ascertain if additional resources or data are available.
14. How can I stay updated on further developments or reports in the Operations Management System?
To stay informed about further developments, trends, and reports in the Operations Management System, consider subscribing to industry newsletters, following relevant companies and organizations, or regularly checking reputable industry news sources and publications.
Methodology
Step 1 - Identification of Relevant Samples Size from Population Database


Step 2 - Approaches for Defining Global Market Size (Value, Volume* & Price*)

Note*: In applicable scenarios
Step 3 - Data Sources
Primary Research
- Web Analytics
- Survey Reports
- Research Institute
- Latest Research Reports
- Opinion Leaders
Secondary Research
- Annual Reports
- White Paper
- Latest Press Release
- Industry Association
- Paid Database
- Investor Presentations

Step 4 - Data Triangulation
Involves using different sources of information in order to increase the validity of a study
These sources are likely to be stakeholders in a program - participants, other researchers, program staff, other community members, and so on.
Then we put all data in single framework & apply various statistical tools to find out the dynamic on the market.
During the analysis stage, feedback from the stakeholder groups would be compared to determine areas of agreement as well as areas of divergence