

Key Insights
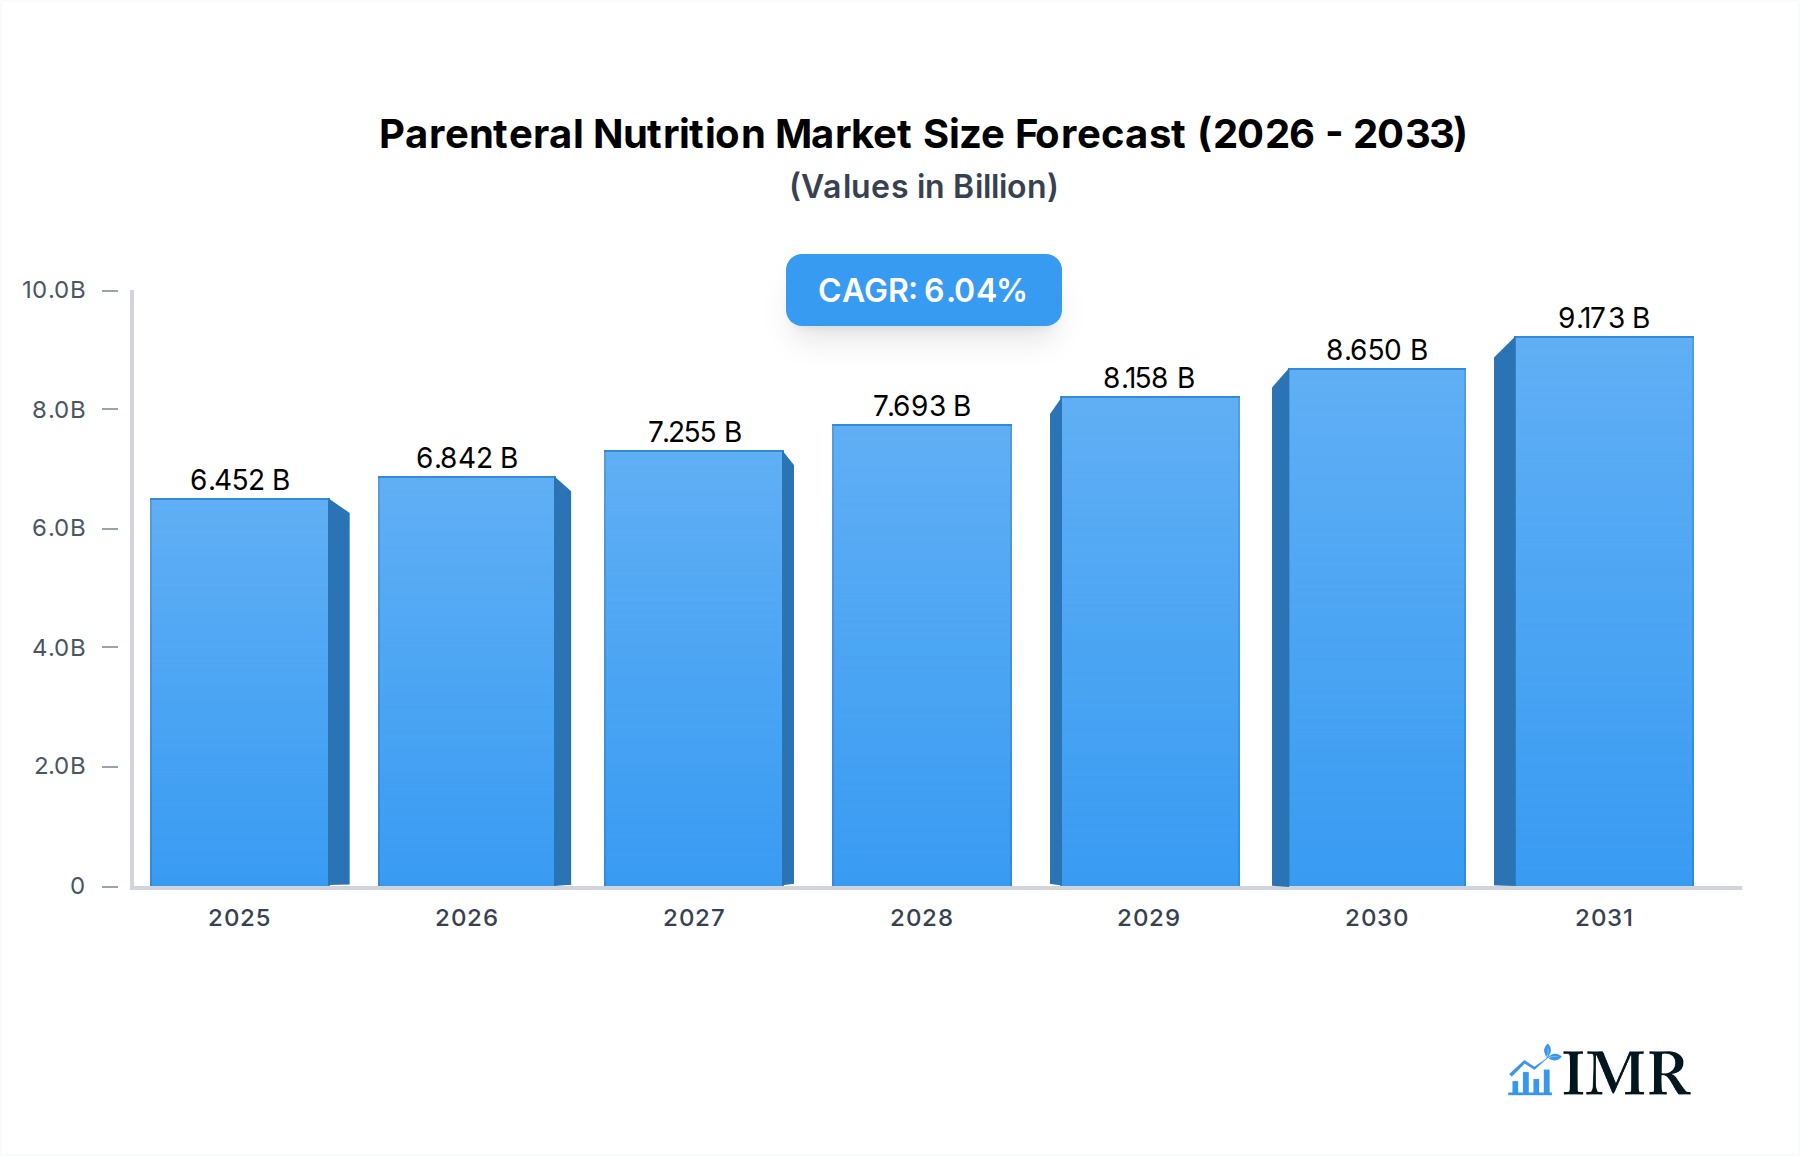
The Parenteral Nutrition Market, a critical segment within the broader Clinical Nutrition Market, was valued at $6084.35 million in 2023. Projections indicate robust expansion, with the market anticipated to reach $11,529.07 million by 2034, demonstrating a compound annual growth rate (CAGR) of 6.04% during the forecast period. This growth trajectory is fundamentally underpinned by a confluence of demographic, epidemiological, and technological factors. A primary demand driver is the escalating global prevalence of chronic diseases such as cancer, gastrointestinal disorders, and intestinal failure, which frequently lead to severe malnutrition requiring intravenous nutritional support. The rapidly expanding geriatric population, highly susceptible to age-related malnourishment and complex medical conditions, further fuels demand. Advancements in Parenteral Nutrition (PN) formulations, particularly in multi-chamber bags and improved lipid emulsions, are enhancing safety, efficacy, and ease of administration, thereby broadening their clinical applicability.

Parenteral Nutrition Market Size (In Billion)
Macroeconomic tailwinds significantly supporting market expansion include increasing healthcare expenditure globally, which improves patient access to advanced therapies. Favorable reimbursement policies, especially in developed economies, alleviate the financial burden on patients and healthcare systems, encouraging PN adoption. Furthermore, the growing trend towards home-based care and the associated expansion of the Home Healthcare Market are creating new avenues for PN delivery, moving beyond traditional hospital settings. Innovations in delivery systems, often overlapping with the Intravenous Infusion Systems Market, are making PN administration safer and more convenient for both clinicians and patients. Key players are continually investing in research and development to introduce next-generation formulations that reduce complications and optimize patient outcomes. The ongoing focus on patient-centric care models and the recognition of nutrition as a cornerstone of recovery are expected to sustain the positive momentum of the Parenteral Nutrition Market through the projected period, solidifying its role as a vital component of modern medical treatment.
Parenteral Nutrition Company Market Share
Dominant Segment: Ready-to-Use PN Bags in Parenteral Nutrition Market
Within the multifaceted Parenteral Nutrition Market, the Ready-to-Use (RTU) PN Bags segment has firmly established its dominance by revenue share, a trend projected to continue due to its inherent advantages in clinical practice and supply chain management. This segment comprises pre-formulated, multi-chamber bags containing macronutrients (amino acids, lipids, carbohydrates) and micronutrients (vitamins, trace elements, electrolytes) that are designed for immediate administration or with minimal preparation. The primary driver for its widespread adoption lies in the significant reduction of preparation time and labor requirements for healthcare providers, particularly in high-volume settings like hospitals and long-term care facilities. The convenience offered by RTU PN bags is unparalleled, directly contributing to operational efficiencies and allowing clinical staff to focus more on patient care rather than compounding processes.
Moreover, RTU PN bags offer a substantially lower risk of microbial contamination compared to extemporaneously compounded PN formulations. This enhanced safety profile is a critical factor in a healthcare environment increasingly focused on infection control and patient safety protocols. The standardized formulations ensure consistent nutrient delivery and reduce the potential for compounding errors, which can have severe patient outcomes. These benefits make the Ready-to-Use PN Bags Market particularly appealing to institutional buyers and contribute to its growing share against the more labor-intensive Compounded Parenteral Nutrition Market. Major global players such as Baxter, Fresenius Kabi, and B. Braun are pivotal in this segment, continually innovating their RTU product lines with improved stability, wider nutrient profiles, and extended shelf lives.
While the Compounded Parenteral Nutrition Market retains its niche for highly individualized patient needs, especially in neonates or patients with unique metabolic requirements, the cost-effectiveness and safety advantages of RTU PN bags are driving a clear shift in preference. The market share of RTU PN bags is not only growing but also consolidating, as economies of scale in manufacturing and distribution favor large pharmaceutical companies capable of producing these complex formulations at scale. This trend is further supported by the increasing demand from the Home Healthcare Market, where the simplicity and safety of RTU products are critical for non-clinical caregivers. The ongoing R&D efforts in this segment focus on developing even more comprehensive and stable formulations, including specialized lipid emulsions and a broader range of Amino Acids Market components, to address a wider spectrum of clinical needs while maintaining the ready-to-use format. This continuous innovation solidifies the dominant position of RTU PN Bags as a cornerstone of the Parenteral Nutrition Market.
Key Market Drivers & Constraints in Parenteral Nutrition Market
The Parenteral Nutrition Market dynamics are shaped by a complex interplay of demand-side drivers and supply-side constraints, each quantified by specific clinical and economic metrics.
Key Market Drivers:
- Increasing Prevalence of Chronic Diseases: The rising global burden of chronic conditions such as cancer, Crohn's disease, and short bowel syndrome directly correlates with the need for nutritional support. For instance, the global incidence of cancer is projected to increase by 55% between 2020 and 2040, with approximately 30-50% of advanced cancer patients experiencing malnutrition. Similarly, inflammatory bowel diseases, including Crohn's, affect millions globally, often necessitating PN for malabsorption. This demographic shift significantly boosts the demand for PN products.
- Aging Population Demographics: The global population aged 65 and above is expected to nearly double by 2050, reaching over 1.6 billion. This demographic segment is particularly vulnerable to malnutrition due to age-related physiological changes, multiple comorbidities, and polypharmacy, making them significant consumers of PN therapies, thereby expanding the Parenteral Nutrition Market.
- Technological Advancements in Formulations and Delivery: Ongoing innovations in PN formulations, such as the development of multi-chamber bags that enhance nutrient stability and reduce preparation errors, drive market adoption. The introduction of novel lipid emulsions, like those containing fish oil, which offer improved immunomodulatory effects and reduced incidence of liver complications, further expands the therapeutic window for PN, minimizing side effects and improving patient outcomes. Such advancements improve the safety and efficacy of Intravenous Infusion Systems Market components.
Key Market Constraints:
- High Cost of Parenteral Nutrition Therapy: The financial burden associated with PN therapy is substantial. A typical annual regimen for home parenteral nutrition can cost between $100,000 and $150,000 per patient, creating significant access barriers in low and middle-income countries and impacting healthcare budgets even in developed regions. This cost contributes to slower growth in certain segments of the Specialty Pharmaceuticals Market.
- Risk of Complications and Adverse Events: PN administration, especially long-term, carries inherent risks such as catheter-related bloodstream infections (CRBSIs), which occur at a rate of approximately 0.8 to 2.7 episodes per 1,000 PN days, and PN-associated liver disease. These complications necessitate careful monitoring, adding to healthcare costs and requiring specialized clinical expertise, thereby limiting broader application.
- Complex Regulatory Approval Processes: The development and approval of new PN formulations are subject to rigorous regulatory scrutiny by agencies such as the FDA and EMA. The comprehensive clinical trials and safety data requirements can extend the time-to-market for new products to 7-10 years, hindering rapid innovation and market entry for manufacturers.
Competitive Ecosystem of Parenteral Nutrition Market
The competitive landscape of the Parenteral Nutrition Market is characterized by a mix of established global pharmaceutical and medical nutrition companies alongside specialized regional players, all vying for market share through product innovation, strategic partnerships, and geographical expansion. Key entities leverage their extensive R&D capabilities and distribution networks to maintain prominence.
- Baxter: A global leader in clinical nutrition, Baxter offers a comprehensive portfolio of multi-chamber bags, compounded PN, and automated compounding devices, focusing on solutions for hospital and homecare settings.
- B. Braun: Known for its broad range of medical products, B. Braun provides a variety of PN solutions, including lipid emulsions and amino acid formulations, emphasizing safety and user-friendliness in its offerings.
- Fresenius Kabi: A major player in infusion therapy and clinical nutrition, Fresenius Kabi offers a wide array of parenteral and enteral nutrition products, with a strong focus on patient care and advanced formulations.
- Kelun Pharma: A significant pharmaceutical enterprise, particularly strong in the Asia-Pacific region, Kelun Pharma is expanding its footprint in the PN segment with innovative products and manufacturing capabilities.
- Otsuka Pharmaceutical: A Japanese pharmaceutical giant, Otsuka specializes in intravenous solutions and medical devices, contributing to the Parenteral Nutrition Market with its diverse product range and R&D.
- JW Pharmaceutical: A leading South Korean pharmaceutical company, JW Pharmaceutical is recognized for its advanced PN formulations, including unique lipid emulsions and multi-chamber bags for various patient groups.
- Pfizer: While primarily known for its broad pharmaceutical portfolio, Pfizer also has a presence in injectable medications that support critical care, including some components utilized in PN therapy.
- Teva Pharmaceutical: A global leader in generic pharmaceuticals, Teva provides cost-effective injectable solutions, indirectly supporting the accessibility of components for the Compounded Parenteral Nutrition Market.
- Haisco Pharmaceutical Group: A prominent Chinese pharmaceutical company, Haisco focuses on innovative drugs and medical devices, making strides in specialized nutrition products within its domestic and regional markets.
- King York: Engaged in pharmaceutical manufacturing, King York contributes to the local supply chains of PN components and finished products, catering to specific regional demands.
- Cisen: As a key player in the Chinese pharmaceutical industry, Cisen manufactures a range of injectable products, including components crucial for both hospital and home-based PN.
- Lummy: This company is involved in the development and production of pharmaceutical preparations, including those essential for providing complete nutritional support to patients requiring PN.
- Grand Life Sciences: An emerging entity, Grand Life Sciences focuses on niche therapeutic areas, potentially including specialized nutritional supplements that complement or form part of PN regimens.
- Medisan: A pharmaceutical company that likely offers a range of injectable and infusion products, addressing the demand for foundational elements in the Parenteral Nutrition Market.
- BBCA Pharmaceutical: Primarily active in biotechnology and pharmaceuticals, BBCA Pharmaceutical's portfolio may include raw materials or finished products pertinent to nutritional therapy.
- Biokin Pharmaceutical: This company contributes to the pharmaceutical sector with a focus on biopharmaceutical products, potentially including advanced therapeutic nutrition solutions.
- Xi'an Libang Pharmaceutical: A Chinese pharmaceutical manufacturer, Xi'an Libang produces a variety of injectables, supporting the broad clinical needs, including those related to PN.
- Lionco Pharmaceutical: Engaged in the production and distribution of pharmaceutical products, Lionco Pharmaceutical plays a role in ensuring the supply of essential medicines and nutrition.
- China Meheco Kangli: As part of a larger medical and pharmaceutical group, this entity is involved in the distribution and manufacturing of healthcare products, including those used in clinical nutrition.
Recent Developments & Milestones in Parenteral Nutrition Market
The Parenteral Nutrition Market is continuously evolving through strategic initiatives, product innovations, and regulatory adaptations, aimed at enhancing patient outcomes and market accessibility.
- Q3 2023: A leading global provider introduced a new generation of multi-chamber bags for adult parenteral nutrition, featuring improved stability for a broader range of vitamins and trace elements, designed to minimize nutrient degradation over longer infusion periods.
- Q4 2023: Regulatory bodies in the European Union granted expanded approval for a novel lipid emulsion specifically formulated to reduce the risk of parenteral nutrition-associated liver disease in pediatric patients, addressing a significant clinical challenge.
- Q1 2024: A major pharmaceutical company announced a strategic partnership with a prominent Home Healthcare Market provider to optimize the distribution and clinical support services for patients receiving home parenteral nutrition, aiming to improve adherence and reduce hospital readmissions.
- Q2 2024: The launch of an AI-powered digital platform by an emerging technology firm, designed to assist clinicians in optimizing PN prescriptions by integrating patient data, metabolic requirements, and drug compatibility, thereby enhancing safety and efficacy.
- Q3 2024: An acquisition deal was finalized wherein a global competitor acquired a specialized manufacturing facility focusing on the production of Amino Acids Market components for PN, strategically bolstering its raw material supply chain and production capacity.
- Q4 2024: Researchers presented promising clinical trial data for an innovative PN formulation designed for patients with severe sepsis, demonstrating improved inflammatory markers and reduced length of ICU stay, indicating future expansion opportunities within critical care settings.
Regional Market Breakdown for Parenteral Nutrition Market
The Parenteral Nutrition Market exhibits varied growth dynamics and adoption patterns across key geographical regions, influenced by healthcare infrastructure, prevalence of chronic diseases, and regulatory frameworks.
North America: This region held the largest revenue share in 2023, accounting for approximately 36% of the global market. Valued at roughly $2190.36 million, North America is characterized by a well-established healthcare system, high awareness of malnutrition, and significant adoption of advanced PN formulations, particularly in the Ready-to-Use PN Bags Market. The region is projected to grow at a CAGR of 5.5%, driven by a rising elderly population and extensive insurance coverage for nutritional therapies.
Europe: Following North America, Europe captured approximately 30% of the market share in 2023, equating to approximately $1825.31 million. The region benefits from stringent regulatory standards ensuring product quality and safety, a high prevalence of chronic diseases, and a substantial geriatric demographic. The European Parenteral Nutrition Market is anticipated to grow at a CAGR of 5.0%, propelled by government initiatives to combat malnutrition and advancements in the Intravenous Infusion Systems Market.
Asia Pacific: This region is identified as the fastest-growing market for parenteral nutrition, with a projected CAGR of 7.5%. While its current market share was about 22% in 2023, valued at around $1338.56 million, the rapid growth is attributed to improving healthcare infrastructure, increasing healthcare expenditure, a vast patient pool, and growing awareness of clinical nutrition. Countries like China and India are emerging as significant growth engines due to their large populations and economic development, leading to increased demand for Specialty Pharmaceuticals Market products.
South America: Representing approximately 6% of the global market in 2023, or about $365.06 million, South America is poised for healthy expansion with a CAGR of 6.8%. The growth here is primarily driven by improvements in healthcare access, increasing prevalence of chronic diseases, and economic development leading to better healthcare funding across countries like Brazil and Argentina.
Middle East & Africa: This region accounted for the remaining 6% of the market in 2023, also approximately $365.06 million, and is expected to grow at a CAGR of 7.0%. Factors such as increasing investment in healthcare infrastructure, rising awareness about malnutrition, and the growing incidence of chronic and lifestyle-related diseases are contributing to the expansion of the Parenteral Nutrition Market in this area.

Parenteral Nutrition Regional Market Share
Customer Segmentation & Buying Behavior in Parenteral Nutrition Market
The Parenteral Nutrition Market serves a diverse customer base, primarily segmented by care setting and patient demographics, each exhibiting distinct purchasing criteria and behaviors. The primary end-user segments include hospitals and clinics, home healthcare providers, and long-term care facilities.
Hospitals and Clinics constitute the largest segment. Their purchasing decisions are heavily influenced by product efficacy, safety profiles (especially contamination risk), ease of use (favoring Ready-to-Use PN Bags Market products), and cost-effectiveness for bulk procurement. Reliability of supply and comprehensive technical support from manufacturers are critical. Procurement is often centralized through Group Purchasing Organizations (GPOs), leveraging volume discounts. Price sensitivity is high, but quality and clinical outcomes often outweigh initial cost in critical care settings.
Home Healthcare Providers represent a rapidly growing segment. For these customers, factors like simplicity of administration, patient convenience, stability of formulations over extended periods, and comprehensive support services for patients and caregivers are paramount. The shift towards home-based care for chronic conditions means a higher demand for user-friendly Intravenous Infusion Systems Market solutions that can be managed outside of clinical environments. Price sensitivity is significant due to individual patient or insurer payment models, often seeking products that balance cost with safety and ease of use. This segment also sees increased demand for user-friendly Compounded Parenteral Nutrition Market solutions for highly individualized home care plans.
Long-Term Care Facilities share similar criteria with hospitals but with an increased emphasis on ease of administration for their nursing staff and cost containment. They prioritize solutions that minimize labor and reduce the risk of complications for long-term residents.
Notable shifts in buyer preference include a growing demand for RTU formulations across all settings due to safety and efficiency benefits, a trend towards personalized nutrition plans where feasible, and an increasing reliance on digital tools for patient monitoring and PN management. Furthermore, the rising awareness of the distinction between parenteral and Enteral Nutrition Market options influences clinical decision-making, with PN being reserved for cases where the gastrointestinal tract is non-functional.
Export, Trade Flow & Tariff Impact on Parenteral Nutrition Market
The Parenteral Nutrition Market is significantly impacted by intricate global trade flows, export dynamics, and varying tariff and non-tariff barriers, particularly given the specialized nature of its products. Key manufacturing hubs for sophisticated PN solutions are concentrated in developed regions, leading to complex international trade patterns.
Major Trade Corridors: The primary trade routes for parenteral nutrition products include flows from Europe (especially Germany, France, and Ireland) to North America and Asia Pacific; North America (particularly the United States) to Canada and Latin American countries; and increasingly, intra-Asia flows from advanced manufacturing bases to developing economies within the region. Cross-border movement of raw materials, such as specific Amino Acids Market components and lipids, also follows these corridors, often involving multiple stages of processing before final product assembly.
Leading Exporting Nations: Germany, the United States, and Switzerland are prominent exporters of finished PN products and high-value components, leveraging their advanced pharmaceutical manufacturing capabilities and stringent quality control. Countries like Ireland also serve as key export hubs due to favorable corporate tax structures and established pharmaceutical industries. These nations supply the global demand for both Ready-to-Use PN Bags Market and specialized Compounded Parenteral Nutrition Market ingredients.
Leading Importing Nations: Major importers include countries with large healthcare expenditures and significant patient populations requiring nutritional support, such as Japan, the United Kingdom, France, and various rapidly developing nations in Asia Pacific and Latin America. These countries often rely on imports to supplement domestic production or to access specialized, patented formulations within the Specialty Pharmaceuticals Market.
Tariff and Non-Tariff Barriers: Tariffs on PN products and their raw materials generally vary but can add 2-5% to import costs in certain regions, affecting pricing and market access. More significant are non-tariff barriers, which include stringent regulatory approvals (e.g., FDA, EMA, PMDA), country-specific packaging and labeling requirements, and intellectual property protection laws. These regulatory hurdles can significantly delay market entry for new products and increase compliance costs. The highly regulated nature of the Intravenous Infusion Systems Market, which directly impacts PN delivery, also contributes to these barriers.
Recent Trade Policy Impacts: Recent geopolitical events and trade disputes, such as the US-China trade tensions, have indirectly impacted the sourcing of specific raw materials, potentially leading to supply chain diversification strategies and marginal cost increases. Brexit has introduced new customs checks and regulatory divergence between the UK and EU, potentially affecting the smooth flow of PN products and their components across the English Channel, causing logistical challenges and minor price fluctuations. Overall, the market remains highly sensitive to disruptions in global logistics and changes in international trade agreements due to the critical nature of these medical supplies.
Parenteral Nutrition Segmentation
-
1. Product Type
- 1.1. Ready-to-Use (RTU) PN Bags
- 1.2. Compounded Parenteral Nutrition (PN)
-
2. Care Setting
- 2.1. Hospital/Clinical PN
- 2.2. Home Parenteral Nutrition
-
3. Nutrient Type
-
3.1. Macronutrients
- 3.1.1. Amino Acids
- 3.1.2. Lipids
- 3.1.3. Carbohydrates
-
3.2. Micronutrients
- 3.2.1. Vitamins
- 3.2.2. Trace Elements
- 3.2.3. Electrolytes
-
3.1. Macronutrients
-
4. Therapeutic Indication
- 4.1. Short Bowel Syndrome
- 4.2. Cancer-Related Malnutrition
- 4.3. Gastrointestinal Disorders
- 4.4. Crohn's Disease
- 4.5. Intestinal Failure
- 4.6. Others
-
5. Age Group
- 5.1. Adult
- 5.2. Pediatric
- 5.3. Neonatal
Parenteral Nutrition Segmentation By Geography
-
1. North America
- 1.1. United States
- 1.2. Canada
- 1.3. Mexico
-
2. South America
- 2.1. Brazil
- 2.2. Argentina
- 2.3. Rest of South America
-
3. Europe
- 3.1. United Kingdom
- 3.2. Germany
- 3.3. France
- 3.4. Italy
- 3.5. Spain
- 3.6. Russia
- 3.7. Benelux
- 3.8. Nordics
- 3.9. Rest of Europe
-
4. Middle East & Africa
- 4.1. Turkey
- 4.2. Israel
- 4.3. GCC
- 4.4. North Africa
- 4.5. South Africa
- 4.6. Rest of Middle East & Africa
-
5. Asia Pacific
- 5.1. China
- 5.2. India
- 5.3. Japan
- 5.4. South Korea
- 5.5. ASEAN
- 5.6. Oceania
- 5.7. Rest of Asia Pacific
Parenteral Nutrition Regional Market Share
Geographic Coverage of Parenteral Nutrition
Parenteral Nutrition REPORT HIGHLIGHTS
| Aspects | Details |
|---|---|
| Study Period | 2020-2034 |
| Base Year | 2025 |
| Estimated Year | 2026 |
| Forecast Period | 2026-2034 |
| Historical Period | 2020-2025 |
| Growth Rate | CAGR of 6.04% from 2020-2034 |
| Segmentation |
|
Table of Contents
- 1. Introduction
- 1.1. Research Scope
- 1.2. Market Segmentation
- 1.3. Research Objective
- 1.4. Definitions and Assumptions
- 2. Executive Summary
- 2.1. Market Snapshot
- 3. Market Dynamics
- 3.1. Market Drivers
- 3.2. Market Restrains
- 3.3. Market Trends
- 3.4. Market Opportunities
- 4. Market Factor Analysis
- 4.1. Porters Five Forces
- 4.1.1. Bargaining Power of Suppliers
- 4.1.2. Bargaining Power of Buyers
- 4.1.3. Threat of New Entrants
- 4.1.4. Threat of Substitutes
- 4.1.5. Competitive Rivalry
- 4.2. PESTEL analysis
- 4.3. BCG Analysis
- 4.3.1. Stars (High Growth, High Market Share)
- 4.3.2. Cash Cows (Low Growth, High Market Share)
- 4.3.3. Question Mark (High Growth, Low Market Share)
- 4.3.4. Dogs (Low Growth, Low Market Share)
- 4.4. Ansoff Matrix Analysis
- 4.5. Supply Chain Analysis
- 4.6. Regulatory Landscape
- 4.7. Current Market Potential and Opportunity Assessment (TAM–SAM–SOM Framework)
- 4.8. IMR Analyst Note
- 4.1. Porters Five Forces
- 5. Market Analysis, Insights and Forecast 2021-2033
- 5.1. Market Analysis, Insights and Forecast - by Product Type
- 5.1.1. Ready-to-Use (RTU) PN Bags
- 5.1.2. Compounded Parenteral Nutrition (PN)
- 5.2. Market Analysis, Insights and Forecast - by Care Setting
- 5.2.1. Hospital/Clinical PN
- 5.2.2. Home Parenteral Nutrition
- 5.3. Market Analysis, Insights and Forecast - by Nutrient Type
- 5.3.1. Macronutrients
- 5.3.1.1. Amino Acids
- 5.3.1.2. Lipids
- 5.3.1.3. Carbohydrates
- 5.3.2. Micronutrients
- 5.3.2.1. Vitamins
- 5.3.2.2. Trace Elements
- 5.3.2.3. Electrolytes
- 5.3.1. Macronutrients
- 5.4. Market Analysis, Insights and Forecast - by Therapeutic Indication
- 5.4.1. Short Bowel Syndrome
- 5.4.2. Cancer-Related Malnutrition
- 5.4.3. Gastrointestinal Disorders
- 5.4.4. Crohn's Disease
- 5.4.5. Intestinal Failure
- 5.4.6. Others
- 5.5. Market Analysis, Insights and Forecast - by Age Group
- 5.5.1. Adult
- 5.5.2. Pediatric
- 5.5.3. Neonatal
- 5.6. Market Analysis, Insights and Forecast - by Region
- 5.6.1. North America
- 5.6.2. South America
- 5.6.3. Europe
- 5.6.4. Middle East & Africa
- 5.6.5. Asia Pacific
- 5.1. Market Analysis, Insights and Forecast - by Product Type
- 6. Global Parenteral Nutrition Analysis, Insights and Forecast, 2021-2033
- 6.1. Market Analysis, Insights and Forecast - by Product Type
- 6.1.1. Ready-to-Use (RTU) PN Bags
- 6.1.2. Compounded Parenteral Nutrition (PN)
- 6.2. Market Analysis, Insights and Forecast - by Care Setting
- 6.2.1. Hospital/Clinical PN
- 6.2.2. Home Parenteral Nutrition
- 6.3. Market Analysis, Insights and Forecast - by Nutrient Type
- 6.3.1. Macronutrients
- 6.3.1.1. Amino Acids
- 6.3.1.2. Lipids
- 6.3.1.3. Carbohydrates
- 6.3.2. Micronutrients
- 6.3.2.1. Vitamins
- 6.3.2.2. Trace Elements
- 6.3.2.3. Electrolytes
- 6.3.1. Macronutrients
- 6.4. Market Analysis, Insights and Forecast - by Therapeutic Indication
- 6.4.1. Short Bowel Syndrome
- 6.4.2. Cancer-Related Malnutrition
- 6.4.3. Gastrointestinal Disorders
- 6.4.4. Crohn's Disease
- 6.4.5. Intestinal Failure
- 6.4.6. Others
- 6.5. Market Analysis, Insights and Forecast - by Age Group
- 6.5.1. Adult
- 6.5.2. Pediatric
- 6.5.3. Neonatal
- 6.1. Market Analysis, Insights and Forecast - by Product Type
- 7. North America Parenteral Nutrition Analysis, Insights and Forecast, 2020-2032
- 7.1. Market Analysis, Insights and Forecast - by Product Type
- 7.1.1. Ready-to-Use (RTU) PN Bags
- 7.1.2. Compounded Parenteral Nutrition (PN)
- 7.2. Market Analysis, Insights and Forecast - by Care Setting
- 7.2.1. Hospital/Clinical PN
- 7.2.2. Home Parenteral Nutrition
- 7.3. Market Analysis, Insights and Forecast - by Nutrient Type
- 7.3.1. Macronutrients
- 7.3.1.1. Amino Acids
- 7.3.1.2. Lipids
- 7.3.1.3. Carbohydrates
- 7.3.2. Micronutrients
- 7.3.2.1. Vitamins
- 7.3.2.2. Trace Elements
- 7.3.2.3. Electrolytes
- 7.3.1. Macronutrients
- 7.4. Market Analysis, Insights and Forecast - by Therapeutic Indication
- 7.4.1. Short Bowel Syndrome
- 7.4.2. Cancer-Related Malnutrition
- 7.4.3. Gastrointestinal Disorders
- 7.4.4. Crohn's Disease
- 7.4.5. Intestinal Failure
- 7.4.6. Others
- 7.5. Market Analysis, Insights and Forecast - by Age Group
- 7.5.1. Adult
- 7.5.2. Pediatric
- 7.5.3. Neonatal
- 7.1. Market Analysis, Insights and Forecast - by Product Type
- 8. South America Parenteral Nutrition Analysis, Insights and Forecast, 2020-2032
- 8.1. Market Analysis, Insights and Forecast - by Product Type
- 8.1.1. Ready-to-Use (RTU) PN Bags
- 8.1.2. Compounded Parenteral Nutrition (PN)
- 8.2. Market Analysis, Insights and Forecast - by Care Setting
- 8.2.1. Hospital/Clinical PN
- 8.2.2. Home Parenteral Nutrition
- 8.3. Market Analysis, Insights and Forecast - by Nutrient Type
- 8.3.1. Macronutrients
- 8.3.1.1. Amino Acids
- 8.3.1.2. Lipids
- 8.3.1.3. Carbohydrates
- 8.3.2. Micronutrients
- 8.3.2.1. Vitamins
- 8.3.2.2. Trace Elements
- 8.3.2.3. Electrolytes
- 8.3.1. Macronutrients
- 8.4. Market Analysis, Insights and Forecast - by Therapeutic Indication
- 8.4.1. Short Bowel Syndrome
- 8.4.2. Cancer-Related Malnutrition
- 8.4.3. Gastrointestinal Disorders
- 8.4.4. Crohn's Disease
- 8.4.5. Intestinal Failure
- 8.4.6. Others
- 8.5. Market Analysis, Insights and Forecast - by Age Group
- 8.5.1. Adult
- 8.5.2. Pediatric
- 8.5.3. Neonatal
- 8.1. Market Analysis, Insights and Forecast - by Product Type
- 9. Europe Parenteral Nutrition Analysis, Insights and Forecast, 2020-2032
- 9.1. Market Analysis, Insights and Forecast - by Product Type
- 9.1.1. Ready-to-Use (RTU) PN Bags
- 9.1.2. Compounded Parenteral Nutrition (PN)
- 9.2. Market Analysis, Insights and Forecast - by Care Setting
- 9.2.1. Hospital/Clinical PN
- 9.2.2. Home Parenteral Nutrition
- 9.3. Market Analysis, Insights and Forecast - by Nutrient Type
- 9.3.1. Macronutrients
- 9.3.1.1. Amino Acids
- 9.3.1.2. Lipids
- 9.3.1.3. Carbohydrates
- 9.3.2. Micronutrients
- 9.3.2.1. Vitamins
- 9.3.2.2. Trace Elements
- 9.3.2.3. Electrolytes
- 9.3.1. Macronutrients
- 9.4. Market Analysis, Insights and Forecast - by Therapeutic Indication
- 9.4.1. Short Bowel Syndrome
- 9.4.2. Cancer-Related Malnutrition
- 9.4.3. Gastrointestinal Disorders
- 9.4.4. Crohn's Disease
- 9.4.5. Intestinal Failure
- 9.4.6. Others
- 9.5. Market Analysis, Insights and Forecast - by Age Group
- 9.5.1. Adult
- 9.5.2. Pediatric
- 9.5.3. Neonatal
- 9.1. Market Analysis, Insights and Forecast - by Product Type
- 10. Middle East & Africa Parenteral Nutrition Analysis, Insights and Forecast, 2020-2032
- 10.1. Market Analysis, Insights and Forecast - by Product Type
- 10.1.1. Ready-to-Use (RTU) PN Bags
- 10.1.2. Compounded Parenteral Nutrition (PN)
- 10.2. Market Analysis, Insights and Forecast - by Care Setting
- 10.2.1. Hospital/Clinical PN
- 10.2.2. Home Parenteral Nutrition
- 10.3. Market Analysis, Insights and Forecast - by Nutrient Type
- 10.3.1. Macronutrients
- 10.3.1.1. Amino Acids
- 10.3.1.2. Lipids
- 10.3.1.3. Carbohydrates
- 10.3.2. Micronutrients
- 10.3.2.1. Vitamins
- 10.3.2.2. Trace Elements
- 10.3.2.3. Electrolytes
- 10.3.1. Macronutrients
- 10.4. Market Analysis, Insights and Forecast - by Therapeutic Indication
- 10.4.1. Short Bowel Syndrome
- 10.4.2. Cancer-Related Malnutrition
- 10.4.3. Gastrointestinal Disorders
- 10.4.4. Crohn's Disease
- 10.4.5. Intestinal Failure
- 10.4.6. Others
- 10.5. Market Analysis, Insights and Forecast - by Age Group
- 10.5.1. Adult
- 10.5.2. Pediatric
- 10.5.3. Neonatal
- 10.1. Market Analysis, Insights and Forecast - by Product Type
- 11. Asia Pacific Parenteral Nutrition Analysis, Insights and Forecast, 2020-2032
- 11.1. Market Analysis, Insights and Forecast - by Product Type
- 11.1.1. Ready-to-Use (RTU) PN Bags
- 11.1.2. Compounded Parenteral Nutrition (PN)
- 11.2. Market Analysis, Insights and Forecast - by Care Setting
- 11.2.1. Hospital/Clinical PN
- 11.2.2. Home Parenteral Nutrition
- 11.3. Market Analysis, Insights and Forecast - by Nutrient Type
- 11.3.1. Macronutrients
- 11.3.1.1. Amino Acids
- 11.3.1.2. Lipids
- 11.3.1.3. Carbohydrates
- 11.3.2. Micronutrients
- 11.3.2.1. Vitamins
- 11.3.2.2. Trace Elements
- 11.3.2.3. Electrolytes
- 11.3.1. Macronutrients
- 11.4. Market Analysis, Insights and Forecast - by Therapeutic Indication
- 11.4.1. Short Bowel Syndrome
- 11.4.2. Cancer-Related Malnutrition
- 11.4.3. Gastrointestinal Disorders
- 11.4.4. Crohn's Disease
- 11.4.5. Intestinal Failure
- 11.4.6. Others
- 11.5. Market Analysis, Insights and Forecast - by Age Group
- 11.5.1. Adult
- 11.5.2. Pediatric
- 11.5.3. Neonatal
- 11.1. Market Analysis, Insights and Forecast - by Product Type
- 12. Competitive Analysis
- 12.1. Company Profiles
- 12.1.1 Baxter
- 12.1.1.1. Company Overview
- 12.1.1.2. Products
- 12.1.1.3. Company Financials
- 12.1.1.4. SWOT Analysis
- 12.1.2 B. Braun
- 12.1.2.1. Company Overview
- 12.1.2.2. Products
- 12.1.2.3. Company Financials
- 12.1.2.4. SWOT Analysis
- 12.1.3 Fresenius Kabi
- 12.1.3.1. Company Overview
- 12.1.3.2. Products
- 12.1.3.3. Company Financials
- 12.1.3.4. SWOT Analysis
- 12.1.4 Kelun Pharma
- 12.1.4.1. Company Overview
- 12.1.4.2. Products
- 12.1.4.3. Company Financials
- 12.1.4.4. SWOT Analysis
- 12.1.5 Otsuka Pharmaceutical
- 12.1.5.1. Company Overview
- 12.1.5.2. Products
- 12.1.5.3. Company Financials
- 12.1.5.4. SWOT Analysis
- 12.1.6 JW Pharmaceutical
- 12.1.6.1. Company Overview
- 12.1.6.2. Products
- 12.1.6.3. Company Financials
- 12.1.6.4. SWOT Analysis
- 12.1.7 Pfizer
- 12.1.7.1. Company Overview
- 12.1.7.2. Products
- 12.1.7.3. Company Financials
- 12.1.7.4. SWOT Analysis
- 12.1.8 Teva Pharmaceutical
- 12.1.8.1. Company Overview
- 12.1.8.2. Products
- 12.1.8.3. Company Financials
- 12.1.8.4. SWOT Analysis
- 12.1.9 Haisco Pharmaceutical Group
- 12.1.9.1. Company Overview
- 12.1.9.2. Products
- 12.1.9.3. Company Financials
- 12.1.9.4. SWOT Analysis
- 12.1.10 King York
- 12.1.10.1. Company Overview
- 12.1.10.2. Products
- 12.1.10.3. Company Financials
- 12.1.10.4. SWOT Analysis
- 12.1.11 Cisen
- 12.1.11.1. Company Overview
- 12.1.11.2. Products
- 12.1.11.3. Company Financials
- 12.1.11.4. SWOT Analysis
- 12.1.12 Lummy
- 12.1.12.1. Company Overview
- 12.1.12.2. Products
- 12.1.12.3. Company Financials
- 12.1.12.4. SWOT Analysis
- 12.1.13 Grand Life Sciences
- 12.1.13.1. Company Overview
- 12.1.13.2. Products
- 12.1.13.3. Company Financials
- 12.1.13.4. SWOT Analysis
- 12.1.14 Medisan
- 12.1.14.1. Company Overview
- 12.1.14.2. Products
- 12.1.14.3. Company Financials
- 12.1.14.4. SWOT Analysis
- 12.1.15 BBCA Pharmaceutical
- 12.1.15.1. Company Overview
- 12.1.15.2. Products
- 12.1.15.3. Company Financials
- 12.1.15.4. SWOT Analysis
- 12.1.16 Biokin Pharmaceutical
- 12.1.16.1. Company Overview
- 12.1.16.2. Products
- 12.1.16.3. Company Financials
- 12.1.16.4. SWOT Analysis
- 12.1.17 Xi'an Libang Pharmaceutical
- 12.1.17.1. Company Overview
- 12.1.17.2. Products
- 12.1.17.3. Company Financials
- 12.1.17.4. SWOT Analysis
- 12.1.18 Lionco Pharmaceutical
- 12.1.18.1. Company Overview
- 12.1.18.2. Products
- 12.1.18.3. Company Financials
- 12.1.18.4. SWOT Analysis
- 12.1.19 China Meheco Kangli
- 12.1.19.1. Company Overview
- 12.1.19.2. Products
- 12.1.19.3. Company Financials
- 12.1.19.4. SWOT Analysis
- 12.1.1 Baxter
- 12.2. Market Entropy
- 12.2.1 Company's Key Areas Served
- 12.2.2 Recent Developments
- 12.3. Company Market Share Analysis 2025
- 12.3.1 Top 5 Companies Market Share Analysis
- 12.3.2 Top 3 Companies Market Share Analysis
- 12.4. List of Potential Customers
- 13. Research Methodology
List of Figures
- Figure 1: Global Parenteral Nutrition Revenue Breakdown (million, %) by Region 2025 & 2033
- Figure 2: Global Parenteral Nutrition Volume Breakdown (K, %) by Region 2025 & 2033
- Figure 3: North America Parenteral Nutrition Revenue (million), by Product Type 2025 & 2033
- Figure 4: North America Parenteral Nutrition Volume (K), by Product Type 2025 & 2033
- Figure 5: North America Parenteral Nutrition Revenue Share (%), by Product Type 2025 & 2033
- Figure 6: North America Parenteral Nutrition Volume Share (%), by Product Type 2025 & 2033
- Figure 7: North America Parenteral Nutrition Revenue (million), by Care Setting 2025 & 2033
- Figure 8: North America Parenteral Nutrition Volume (K), by Care Setting 2025 & 2033
- Figure 9: North America Parenteral Nutrition Revenue Share (%), by Care Setting 2025 & 2033
- Figure 10: North America Parenteral Nutrition Volume Share (%), by Care Setting 2025 & 2033
- Figure 11: North America Parenteral Nutrition Revenue (million), by Nutrient Type 2025 & 2033
- Figure 12: North America Parenteral Nutrition Volume (K), by Nutrient Type 2025 & 2033
- Figure 13: North America Parenteral Nutrition Revenue Share (%), by Nutrient Type 2025 & 2033
- Figure 14: North America Parenteral Nutrition Volume Share (%), by Nutrient Type 2025 & 2033
- Figure 15: North America Parenteral Nutrition Revenue (million), by Therapeutic Indication 2025 & 2033
- Figure 16: North America Parenteral Nutrition Volume (K), by Therapeutic Indication 2025 & 2033
- Figure 17: North America Parenteral Nutrition Revenue Share (%), by Therapeutic Indication 2025 & 2033
- Figure 18: North America Parenteral Nutrition Volume Share (%), by Therapeutic Indication 2025 & 2033
- Figure 19: North America Parenteral Nutrition Revenue (million), by Age Group 2025 & 2033
- Figure 20: North America Parenteral Nutrition Volume (K), by Age Group 2025 & 2033
- Figure 21: North America Parenteral Nutrition Revenue Share (%), by Age Group 2025 & 2033
- Figure 22: North America Parenteral Nutrition Volume Share (%), by Age Group 2025 & 2033
- Figure 23: North America Parenteral Nutrition Revenue (million), by Country 2025 & 2033
- Figure 24: North America Parenteral Nutrition Volume (K), by Country 2025 & 2033
- Figure 25: North America Parenteral Nutrition Revenue Share (%), by Country 2025 & 2033
- Figure 26: North America Parenteral Nutrition Volume Share (%), by Country 2025 & 2033
- Figure 27: South America Parenteral Nutrition Revenue (million), by Product Type 2025 & 2033
- Figure 28: South America Parenteral Nutrition Volume (K), by Product Type 2025 & 2033
- Figure 29: South America Parenteral Nutrition Revenue Share (%), by Product Type 2025 & 2033
- Figure 30: South America Parenteral Nutrition Volume Share (%), by Product Type 2025 & 2033
- Figure 31: South America Parenteral Nutrition Revenue (million), by Care Setting 2025 & 2033
- Figure 32: South America Parenteral Nutrition Volume (K), by Care Setting 2025 & 2033
- Figure 33: South America Parenteral Nutrition Revenue Share (%), by Care Setting 2025 & 2033
- Figure 34: South America Parenteral Nutrition Volume Share (%), by Care Setting 2025 & 2033
- Figure 35: South America Parenteral Nutrition Revenue (million), by Nutrient Type 2025 & 2033
- Figure 36: South America Parenteral Nutrition Volume (K), by Nutrient Type 2025 & 2033
- Figure 37: South America Parenteral Nutrition Revenue Share (%), by Nutrient Type 2025 & 2033
- Figure 38: South America Parenteral Nutrition Volume Share (%), by Nutrient Type 2025 & 2033
- Figure 39: South America Parenteral Nutrition Revenue (million), by Therapeutic Indication 2025 & 2033
- Figure 40: South America Parenteral Nutrition Volume (K), by Therapeutic Indication 2025 & 2033
- Figure 41: South America Parenteral Nutrition Revenue Share (%), by Therapeutic Indication 2025 & 2033
- Figure 42: South America Parenteral Nutrition Volume Share (%), by Therapeutic Indication 2025 & 2033
- Figure 43: South America Parenteral Nutrition Revenue (million), by Age Group 2025 & 2033
- Figure 44: South America Parenteral Nutrition Volume (K), by Age Group 2025 & 2033
- Figure 45: South America Parenteral Nutrition Revenue Share (%), by Age Group 2025 & 2033
- Figure 46: South America Parenteral Nutrition Volume Share (%), by Age Group 2025 & 2033
- Figure 47: South America Parenteral Nutrition Revenue (million), by Country 2025 & 2033
- Figure 48: South America Parenteral Nutrition Volume (K), by Country 2025 & 2033
- Figure 49: South America Parenteral Nutrition Revenue Share (%), by Country 2025 & 2033
- Figure 50: South America Parenteral Nutrition Volume Share (%), by Country 2025 & 2033
- Figure 51: Europe Parenteral Nutrition Revenue (million), by Product Type 2025 & 2033
- Figure 52: Europe Parenteral Nutrition Volume (K), by Product Type 2025 & 2033
- Figure 53: Europe Parenteral Nutrition Revenue Share (%), by Product Type 2025 & 2033
- Figure 54: Europe Parenteral Nutrition Volume Share (%), by Product Type 2025 & 2033
- Figure 55: Europe Parenteral Nutrition Revenue (million), by Care Setting 2025 & 2033
- Figure 56: Europe Parenteral Nutrition Volume (K), by Care Setting 2025 & 2033
- Figure 57: Europe Parenteral Nutrition Revenue Share (%), by Care Setting 2025 & 2033
- Figure 58: Europe Parenteral Nutrition Volume Share (%), by Care Setting 2025 & 2033
- Figure 59: Europe Parenteral Nutrition Revenue (million), by Nutrient Type 2025 & 2033
- Figure 60: Europe Parenteral Nutrition Volume (K), by Nutrient Type 2025 & 2033
- Figure 61: Europe Parenteral Nutrition Revenue Share (%), by Nutrient Type 2025 & 2033
- Figure 62: Europe Parenteral Nutrition Volume Share (%), by Nutrient Type 2025 & 2033
- Figure 63: Europe Parenteral Nutrition Revenue (million), by Therapeutic Indication 2025 & 2033
- Figure 64: Europe Parenteral Nutrition Volume (K), by Therapeutic Indication 2025 & 2033
- Figure 65: Europe Parenteral Nutrition Revenue Share (%), by Therapeutic Indication 2025 & 2033
- Figure 66: Europe Parenteral Nutrition Volume Share (%), by Therapeutic Indication 2025 & 2033
- Figure 67: Europe Parenteral Nutrition Revenue (million), by Age Group 2025 & 2033
- Figure 68: Europe Parenteral Nutrition Volume (K), by Age Group 2025 & 2033
- Figure 69: Europe Parenteral Nutrition Revenue Share (%), by Age Group 2025 & 2033
- Figure 70: Europe Parenteral Nutrition Volume Share (%), by Age Group 2025 & 2033
- Figure 71: Europe Parenteral Nutrition Revenue (million), by Country 2025 & 2033
- Figure 72: Europe Parenteral Nutrition Volume (K), by Country 2025 & 2033
- Figure 73: Europe Parenteral Nutrition Revenue Share (%), by Country 2025 & 2033
- Figure 74: Europe Parenteral Nutrition Volume Share (%), by Country 2025 & 2033
- Figure 75: Middle East & Africa Parenteral Nutrition Revenue (million), by Product Type 2025 & 2033
- Figure 76: Middle East & Africa Parenteral Nutrition Volume (K), by Product Type 2025 & 2033
- Figure 77: Middle East & Africa Parenteral Nutrition Revenue Share (%), by Product Type 2025 & 2033
- Figure 78: Middle East & Africa Parenteral Nutrition Volume Share (%), by Product Type 2025 & 2033
- Figure 79: Middle East & Africa Parenteral Nutrition Revenue (million), by Care Setting 2025 & 2033
- Figure 80: Middle East & Africa Parenteral Nutrition Volume (K), by Care Setting 2025 & 2033
- Figure 81: Middle East & Africa Parenteral Nutrition Revenue Share (%), by Care Setting 2025 & 2033
- Figure 82: Middle East & Africa Parenteral Nutrition Volume Share (%), by Care Setting 2025 & 2033
- Figure 83: Middle East & Africa Parenteral Nutrition Revenue (million), by Nutrient Type 2025 & 2033
- Figure 84: Middle East & Africa Parenteral Nutrition Volume (K), by Nutrient Type 2025 & 2033
- Figure 85: Middle East & Africa Parenteral Nutrition Revenue Share (%), by Nutrient Type 2025 & 2033
- Figure 86: Middle East & Africa Parenteral Nutrition Volume Share (%), by Nutrient Type 2025 & 2033
- Figure 87: Middle East & Africa Parenteral Nutrition Revenue (million), by Therapeutic Indication 2025 & 2033
- Figure 88: Middle East & Africa Parenteral Nutrition Volume (K), by Therapeutic Indication 2025 & 2033
- Figure 89: Middle East & Africa Parenteral Nutrition Revenue Share (%), by Therapeutic Indication 2025 & 2033
- Figure 90: Middle East & Africa Parenteral Nutrition Volume Share (%), by Therapeutic Indication 2025 & 2033
- Figure 91: Middle East & Africa Parenteral Nutrition Revenue (million), by Age Group 2025 & 2033
- Figure 92: Middle East & Africa Parenteral Nutrition Volume (K), by Age Group 2025 & 2033
- Figure 93: Middle East & Africa Parenteral Nutrition Revenue Share (%), by Age Group 2025 & 2033
- Figure 94: Middle East & Africa Parenteral Nutrition Volume Share (%), by Age Group 2025 & 2033
- Figure 95: Middle East & Africa Parenteral Nutrition Revenue (million), by Country 2025 & 2033
- Figure 96: Middle East & Africa Parenteral Nutrition Volume (K), by Country 2025 & 2033
- Figure 97: Middle East & Africa Parenteral Nutrition Revenue Share (%), by Country 2025 & 2033
- Figure 98: Middle East & Africa Parenteral Nutrition Volume Share (%), by Country 2025 & 2033
- Figure 99: Asia Pacific Parenteral Nutrition Revenue (million), by Product Type 2025 & 2033
- Figure 100: Asia Pacific Parenteral Nutrition Volume (K), by Product Type 2025 & 2033
- Figure 101: Asia Pacific Parenteral Nutrition Revenue Share (%), by Product Type 2025 & 2033
- Figure 102: Asia Pacific Parenteral Nutrition Volume Share (%), by Product Type 2025 & 2033
- Figure 103: Asia Pacific Parenteral Nutrition Revenue (million), by Care Setting 2025 & 2033
- Figure 104: Asia Pacific Parenteral Nutrition Volume (K), by Care Setting 2025 & 2033
- Figure 105: Asia Pacific Parenteral Nutrition Revenue Share (%), by Care Setting 2025 & 2033
- Figure 106: Asia Pacific Parenteral Nutrition Volume Share (%), by Care Setting 2025 & 2033
- Figure 107: Asia Pacific Parenteral Nutrition Revenue (million), by Nutrient Type 2025 & 2033
- Figure 108: Asia Pacific Parenteral Nutrition Volume (K), by Nutrient Type 2025 & 2033
- Figure 109: Asia Pacific Parenteral Nutrition Revenue Share (%), by Nutrient Type 2025 & 2033
- Figure 110: Asia Pacific Parenteral Nutrition Volume Share (%), by Nutrient Type 2025 & 2033
- Figure 111: Asia Pacific Parenteral Nutrition Revenue (million), by Therapeutic Indication 2025 & 2033
- Figure 112: Asia Pacific Parenteral Nutrition Volume (K), by Therapeutic Indication 2025 & 2033
- Figure 113: Asia Pacific Parenteral Nutrition Revenue Share (%), by Therapeutic Indication 2025 & 2033
- Figure 114: Asia Pacific Parenteral Nutrition Volume Share (%), by Therapeutic Indication 2025 & 2033
- Figure 115: Asia Pacific Parenteral Nutrition Revenue (million), by Age Group 2025 & 2033
- Figure 116: Asia Pacific Parenteral Nutrition Volume (K), by Age Group 2025 & 2033
- Figure 117: Asia Pacific Parenteral Nutrition Revenue Share (%), by Age Group 2025 & 2033
- Figure 118: Asia Pacific Parenteral Nutrition Volume Share (%), by Age Group 2025 & 2033
- Figure 119: Asia Pacific Parenteral Nutrition Revenue (million), by Country 2025 & 2033
- Figure 120: Asia Pacific Parenteral Nutrition Volume (K), by Country 2025 & 2033
- Figure 121: Asia Pacific Parenteral Nutrition Revenue Share (%), by Country 2025 & 2033
- Figure 122: Asia Pacific Parenteral Nutrition Volume Share (%), by Country 2025 & 2033
List of Tables
- Table 1: Global Parenteral Nutrition Revenue million Forecast, by Product Type 2020 & 2033
- Table 2: Global Parenteral Nutrition Volume K Forecast, by Product Type 2020 & 2033
- Table 3: Global Parenteral Nutrition Revenue million Forecast, by Care Setting 2020 & 2033
- Table 4: Global Parenteral Nutrition Volume K Forecast, by Care Setting 2020 & 2033
- Table 5: Global Parenteral Nutrition Revenue million Forecast, by Nutrient Type 2020 & 2033
- Table 6: Global Parenteral Nutrition Volume K Forecast, by Nutrient Type 2020 & 2033
- Table 7: Global Parenteral Nutrition Revenue million Forecast, by Therapeutic Indication 2020 & 2033
- Table 8: Global Parenteral Nutrition Volume K Forecast, by Therapeutic Indication 2020 & 2033
- Table 9: Global Parenteral Nutrition Revenue million Forecast, by Age Group 2020 & 2033
- Table 10: Global Parenteral Nutrition Volume K Forecast, by Age Group 2020 & 2033
- Table 11: Global Parenteral Nutrition Revenue million Forecast, by Region 2020 & 2033
- Table 12: Global Parenteral Nutrition Volume K Forecast, by Region 2020 & 2033
- Table 13: Global Parenteral Nutrition Revenue million Forecast, by Product Type 2020 & 2033
- Table 14: Global Parenteral Nutrition Volume K Forecast, by Product Type 2020 & 2033
- Table 15: Global Parenteral Nutrition Revenue million Forecast, by Care Setting 2020 & 2033
- Table 16: Global Parenteral Nutrition Volume K Forecast, by Care Setting 2020 & 2033
- Table 17: Global Parenteral Nutrition Revenue million Forecast, by Nutrient Type 2020 & 2033
- Table 18: Global Parenteral Nutrition Volume K Forecast, by Nutrient Type 2020 & 2033
- Table 19: Global Parenteral Nutrition Revenue million Forecast, by Therapeutic Indication 2020 & 2033
- Table 20: Global Parenteral Nutrition Volume K Forecast, by Therapeutic Indication 2020 & 2033
- Table 21: Global Parenteral Nutrition Revenue million Forecast, by Age Group 2020 & 2033
- Table 22: Global Parenteral Nutrition Volume K Forecast, by Age Group 2020 & 2033
- Table 23: Global Parenteral Nutrition Revenue million Forecast, by Country 2020 & 2033
- Table 24: Global Parenteral Nutrition Volume K Forecast, by Country 2020 & 2033
- Table 25: United States Parenteral Nutrition Revenue (million) Forecast, by Application 2020 & 2033
- Table 26: United States Parenteral Nutrition Volume (K) Forecast, by Application 2020 & 2033
- Table 27: Canada Parenteral Nutrition Revenue (million) Forecast, by Application 2020 & 2033
- Table 28: Canada Parenteral Nutrition Volume (K) Forecast, by Application 2020 & 2033
- Table 29: Mexico Parenteral Nutrition Revenue (million) Forecast, by Application 2020 & 2033
- Table 30: Mexico Parenteral Nutrition Volume (K) Forecast, by Application 2020 & 2033
- Table 31: Global Parenteral Nutrition Revenue million Forecast, by Product Type 2020 & 2033
- Table 32: Global Parenteral Nutrition Volume K Forecast, by Product Type 2020 & 2033
- Table 33: Global Parenteral Nutrition Revenue million Forecast, by Care Setting 2020 & 2033
- Table 34: Global Parenteral Nutrition Volume K Forecast, by Care Setting 2020 & 2033
- Table 35: Global Parenteral Nutrition Revenue million Forecast, by Nutrient Type 2020 & 2033
- Table 36: Global Parenteral Nutrition Volume K Forecast, by Nutrient Type 2020 & 2033
- Table 37: Global Parenteral Nutrition Revenue million Forecast, by Therapeutic Indication 2020 & 2033
- Table 38: Global Parenteral Nutrition Volume K Forecast, by Therapeutic Indication 2020 & 2033
- Table 39: Global Parenteral Nutrition Revenue million Forecast, by Age Group 2020 & 2033
- Table 40: Global Parenteral Nutrition Volume K Forecast, by Age Group 2020 & 2033
- Table 41: Global Parenteral Nutrition Revenue million Forecast, by Country 2020 & 2033
- Table 42: Global Parenteral Nutrition Volume K Forecast, by Country 2020 & 2033
- Table 43: Brazil Parenteral Nutrition Revenue (million) Forecast, by Application 2020 & 2033
- Table 44: Brazil Parenteral Nutrition Volume (K) Forecast, by Application 2020 & 2033
- Table 45: Argentina Parenteral Nutrition Revenue (million) Forecast, by Application 2020 & 2033
- Table 46: Argentina Parenteral Nutrition Volume (K) Forecast, by Application 2020 & 2033
- Table 47: Rest of South America Parenteral Nutrition Revenue (million) Forecast, by Application 2020 & 2033
- Table 48: Rest of South America Parenteral Nutrition Volume (K) Forecast, by Application 2020 & 2033
- Table 49: Global Parenteral Nutrition Revenue million Forecast, by Product Type 2020 & 2033
- Table 50: Global Parenteral Nutrition Volume K Forecast, by Product Type 2020 & 2033
- Table 51: Global Parenteral Nutrition Revenue million Forecast, by Care Setting 2020 & 2033
- Table 52: Global Parenteral Nutrition Volume K Forecast, by Care Setting 2020 & 2033
- Table 53: Global Parenteral Nutrition Revenue million Forecast, by Nutrient Type 2020 & 2033
- Table 54: Global Parenteral Nutrition Volume K Forecast, by Nutrient Type 2020 & 2033
- Table 55: Global Parenteral Nutrition Revenue million Forecast, by Therapeutic Indication 2020 & 2033
- Table 56: Global Parenteral Nutrition Volume K Forecast, by Therapeutic Indication 2020 & 2033
- Table 57: Global Parenteral Nutrition Revenue million Forecast, by Age Group 2020 & 2033
- Table 58: Global Parenteral Nutrition Volume K Forecast, by Age Group 2020 & 2033
- Table 59: Global Parenteral Nutrition Revenue million Forecast, by Country 2020 & 2033
- Table 60: Global Parenteral Nutrition Volume K Forecast, by Country 2020 & 2033
- Table 61: United Kingdom Parenteral Nutrition Revenue (million) Forecast, by Application 2020 & 2033
- Table 62: United Kingdom Parenteral Nutrition Volume (K) Forecast, by Application 2020 & 2033
- Table 63: Germany Parenteral Nutrition Revenue (million) Forecast, by Application 2020 & 2033
- Table 64: Germany Parenteral Nutrition Volume (K) Forecast, by Application 2020 & 2033
- Table 65: France Parenteral Nutrition Revenue (million) Forecast, by Application 2020 & 2033
- Table 66: France Parenteral Nutrition Volume (K) Forecast, by Application 2020 & 2033
- Table 67: Italy Parenteral Nutrition Revenue (million) Forecast, by Application 2020 & 2033
- Table 68: Italy Parenteral Nutrition Volume (K) Forecast, by Application 2020 & 2033
- Table 69: Spain Parenteral Nutrition Revenue (million) Forecast, by Application 2020 & 2033
- Table 70: Spain Parenteral Nutrition Volume (K) Forecast, by Application 2020 & 2033
- Table 71: Russia Parenteral Nutrition Revenue (million) Forecast, by Application 2020 & 2033
- Table 72: Russia Parenteral Nutrition Volume (K) Forecast, by Application 2020 & 2033
- Table 73: Benelux Parenteral Nutrition Revenue (million) Forecast, by Application 2020 & 2033
- Table 74: Benelux Parenteral Nutrition Volume (K) Forecast, by Application 2020 & 2033
- Table 75: Nordics Parenteral Nutrition Revenue (million) Forecast, by Application 2020 & 2033
- Table 76: Nordics Parenteral Nutrition Volume (K) Forecast, by Application 2020 & 2033
- Table 77: Rest of Europe Parenteral Nutrition Revenue (million) Forecast, by Application 2020 & 2033
- Table 78: Rest of Europe Parenteral Nutrition Volume (K) Forecast, by Application 2020 & 2033
- Table 79: Global Parenteral Nutrition Revenue million Forecast, by Product Type 2020 & 2033
- Table 80: Global Parenteral Nutrition Volume K Forecast, by Product Type 2020 & 2033
- Table 81: Global Parenteral Nutrition Revenue million Forecast, by Care Setting 2020 & 2033
- Table 82: Global Parenteral Nutrition Volume K Forecast, by Care Setting 2020 & 2033
- Table 83: Global Parenteral Nutrition Revenue million Forecast, by Nutrient Type 2020 & 2033
- Table 84: Global Parenteral Nutrition Volume K Forecast, by Nutrient Type 2020 & 2033
- Table 85: Global Parenteral Nutrition Revenue million Forecast, by Therapeutic Indication 2020 & 2033
- Table 86: Global Parenteral Nutrition Volume K Forecast, by Therapeutic Indication 2020 & 2033
- Table 87: Global Parenteral Nutrition Revenue million Forecast, by Age Group 2020 & 2033
- Table 88: Global Parenteral Nutrition Volume K Forecast, by Age Group 2020 & 2033
- Table 89: Global Parenteral Nutrition Revenue million Forecast, by Country 2020 & 2033
- Table 90: Global Parenteral Nutrition Volume K Forecast, by Country 2020 & 2033
- Table 91: Turkey Parenteral Nutrition Revenue (million) Forecast, by Application 2020 & 2033
- Table 92: Turkey Parenteral Nutrition Volume (K) Forecast, by Application 2020 & 2033
- Table 93: Israel Parenteral Nutrition Revenue (million) Forecast, by Application 2020 & 2033
- Table 94: Israel Parenteral Nutrition Volume (K) Forecast, by Application 2020 & 2033
- Table 95: GCC Parenteral Nutrition Revenue (million) Forecast, by Application 2020 & 2033
- Table 96: GCC Parenteral Nutrition Volume (K) Forecast, by Application 2020 & 2033
- Table 97: North Africa Parenteral Nutrition Revenue (million) Forecast, by Application 2020 & 2033
- Table 98: North Africa Parenteral Nutrition Volume (K) Forecast, by Application 2020 & 2033
- Table 99: South Africa Parenteral Nutrition Revenue (million) Forecast, by Application 2020 & 2033
- Table 100: South Africa Parenteral Nutrition Volume (K) Forecast, by Application 2020 & 2033
- Table 101: Rest of Middle East & Africa Parenteral Nutrition Revenue (million) Forecast, by Application 2020 & 2033
- Table 102: Rest of Middle East & Africa Parenteral Nutrition Volume (K) Forecast, by Application 2020 & 2033
- Table 103: Global Parenteral Nutrition Revenue million Forecast, by Product Type 2020 & 2033
- Table 104: Global Parenteral Nutrition Volume K Forecast, by Product Type 2020 & 2033
- Table 105: Global Parenteral Nutrition Revenue million Forecast, by Care Setting 2020 & 2033
- Table 106: Global Parenteral Nutrition Volume K Forecast, by Care Setting 2020 & 2033
- Table 107: Global Parenteral Nutrition Revenue million Forecast, by Nutrient Type 2020 & 2033
- Table 108: Global Parenteral Nutrition Volume K Forecast, by Nutrient Type 2020 & 2033
- Table 109: Global Parenteral Nutrition Revenue million Forecast, by Therapeutic Indication 2020 & 2033
- Table 110: Global Parenteral Nutrition Volume K Forecast, by Therapeutic Indication 2020 & 2033
- Table 111: Global Parenteral Nutrition Revenue million Forecast, by Age Group 2020 & 2033
- Table 112: Global Parenteral Nutrition Volume K Forecast, by Age Group 2020 & 2033
- Table 113: Global Parenteral Nutrition Revenue million Forecast, by Country 2020 & 2033
- Table 114: Global Parenteral Nutrition Volume K Forecast, by Country 2020 & 2033
- Table 115: China Parenteral Nutrition Revenue (million) Forecast, by Application 2020 & 2033
- Table 116: China Parenteral Nutrition Volume (K) Forecast, by Application 2020 & 2033
- Table 117: India Parenteral Nutrition Revenue (million) Forecast, by Application 2020 & 2033
- Table 118: India Parenteral Nutrition Volume (K) Forecast, by Application 2020 & 2033
- Table 119: Japan Parenteral Nutrition Revenue (million) Forecast, by Application 2020 & 2033
- Table 120: Japan Parenteral Nutrition Volume (K) Forecast, by Application 2020 & 2033
- Table 121: South Korea Parenteral Nutrition Revenue (million) Forecast, by Application 2020 & 2033
- Table 122: South Korea Parenteral Nutrition Volume (K) Forecast, by Application 2020 & 2033
- Table 123: ASEAN Parenteral Nutrition Revenue (million) Forecast, by Application 2020 & 2033
- Table 124: ASEAN Parenteral Nutrition Volume (K) Forecast, by Application 2020 & 2033
- Table 125: Oceania Parenteral Nutrition Revenue (million) Forecast, by Application 2020 & 2033
- Table 126: Oceania Parenteral Nutrition Volume (K) Forecast, by Application 2020 & 2033
- Table 127: Rest of Asia Pacific Parenteral Nutrition Revenue (million) Forecast, by Application 2020 & 2033
- Table 128: Rest of Asia Pacific Parenteral Nutrition Volume (K) Forecast, by Application 2020 & 2033
Frequently Asked Questions
1. What is the projected Compound Annual Growth Rate (CAGR) of the Parenteral Nutrition?
The projected CAGR is approximately 6.04%.
2. Which companies are prominent players in the Parenteral Nutrition?
Key companies in the market include Baxter, B. Braun, Fresenius Kabi, Kelun Pharma, Otsuka Pharmaceutical, JW Pharmaceutical, Pfizer, Teva Pharmaceutical, Haisco Pharmaceutical Group, King York, Cisen, Lummy, Grand Life Sciences, Medisan, BBCA Pharmaceutical, Biokin Pharmaceutical, Xi'an Libang Pharmaceutical, Lionco Pharmaceutical, China Meheco Kangli.
3. What are the main segments of the Parenteral Nutrition?
The market segments include Product Type, Care Setting, Nutrient Type, Therapeutic Indication, Age Group.
4. Can you provide details about the market size?
The market size is estimated to be USD 6084.35 million as of 2022.
5. What are some drivers contributing to market growth?
N/A
6. What are the notable trends driving market growth?
N/A
7. Are there any restraints impacting market growth?
N/A
8. Can you provide examples of recent developments in the market?
N/A
9. What pricing options are available for accessing the report?
Pricing options include single-user, multi-user, and enterprise licenses priced at USD 3350.00, USD 5025.00, and USD 6700.00 respectively.
10. Is the market size provided in terms of value or volume?
The market size is provided in terms of value, measured in million and volume, measured in K.
11. Are there any specific market keywords associated with the report?
Yes, the market keyword associated with the report is "Parenteral Nutrition," which aids in identifying and referencing the specific market segment covered.
12. How do I determine which pricing option suits my needs best?
The pricing options vary based on user requirements and access needs. Individual users may opt for single-user licenses, while businesses requiring broader access may choose multi-user or enterprise licenses for cost-effective access to the report.
13. Are there any additional resources or data provided in the Parenteral Nutrition report?
While the report offers comprehensive insights, it's advisable to review the specific contents or supplementary materials provided to ascertain if additional resources or data are available.
14. How can I stay updated on further developments or reports in the Parenteral Nutrition?
To stay informed about further developments, trends, and reports in the Parenteral Nutrition, consider subscribing to industry newsletters, following relevant companies and organizations, or regularly checking reputable industry news sources and publications.
Methodology
Step 1 - Identification of Relevant Samples Size from Population Database


Step 2 - Approaches for Defining Global Market Size (Value, Volume* & Price*)

Note*: In applicable scenarios
Step 3 - Data Sources
Primary Research
- Web Analytics
- Survey Reports
- Research Institute
- Latest Research Reports
- Opinion Leaders
Secondary Research
- Annual Reports
- White Paper
- Latest Press Release
- Industry Association
- Paid Database
- Investor Presentations

Step 4 - Data Triangulation
Involves using different sources of information in order to increase the validity of a study
These sources are likely to be stakeholders in a program - participants, other researchers, program staff, other community members, and so on.
Then we put all data in single framework & apply various statistical tools to find out the dynamic on the market.
During the analysis stage, feedback from the stakeholder groups would be compared to determine areas of agreement as well as areas of divergence