

Key Insights
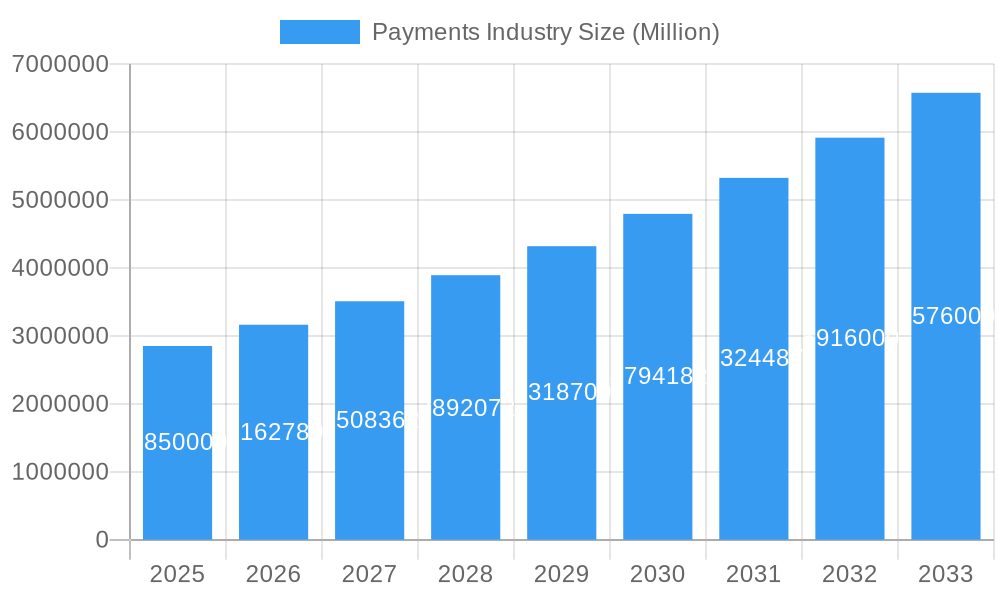
The global payments industry, currently valued at $2.85 trillion in 2025, is experiencing robust growth, projected to expand at a compound annual growth rate (CAGR) of 10.88% from 2025 to 2033. This expansion is fueled by several key drivers. The rapid adoption of e-commerce and digital wallets, coupled with increasing smartphone penetration and a growing preference for contactless payments, are significantly boosting the market. Furthermore, the ongoing evolution of payment technologies, including advancements in biometrics and artificial intelligence, is enhancing security and convenience, further driving industry growth. The increasing focus on financial inclusion initiatives in developing economies is also contributing to market expansion. While regulatory hurdles and security concerns pose challenges, the industry's innovative capacity is mitigating these risks. Segmentation reveals retail and entertainment as dominant end-user industries, while point-of-sale (POS) systems continue to be the primary mode of payment, though online sales are rapidly gaining traction. Key players like Visa, Mastercard, PayPal, and Alipay are aggressively competing for market share through strategic partnerships, technological innovations, and expansion into new markets.
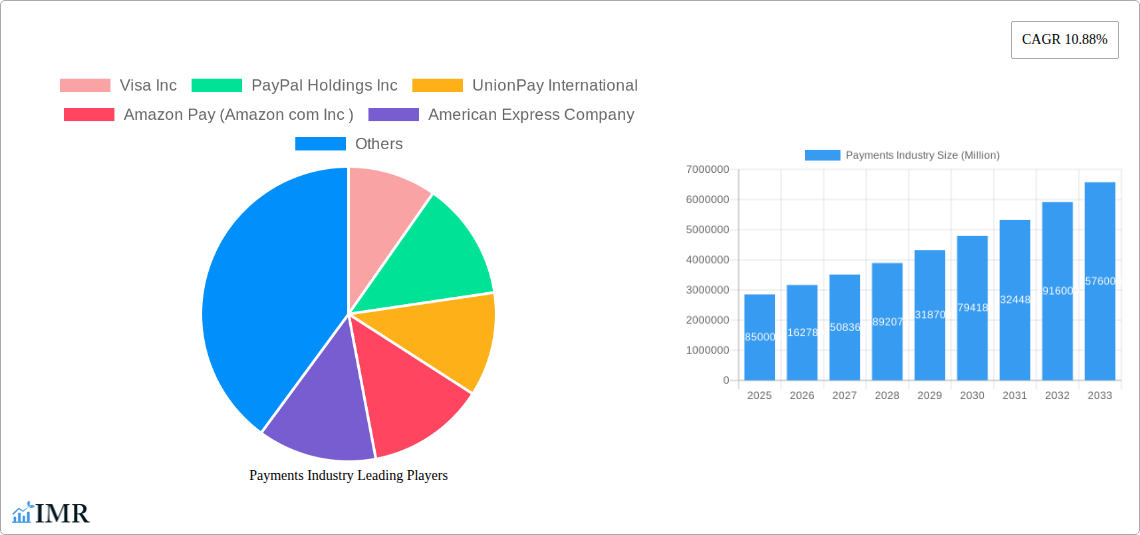
Payments Industry Market Size (In Million)
The industry's future growth is expected to be geographically diverse. While North America and Europe currently hold significant market share, the Asia-Pacific region is poised for substantial growth due to its large and rapidly developing digital economy. The Latin American and Middle Eastern markets are also demonstrating significant potential for future growth. The competitive landscape is dynamic, with established players facing competition from fintech startups and technology giants like Apple and Google. Ongoing innovation, strategic acquisitions, and increasing focus on customer experience will be crucial for success in this rapidly evolving market. Future projections suggest that the market will surpass $7 trillion by 2033, fueled by consistent technological advancements and widespread digital adoption across various sectors.
Payments Industry Company Market Share
Payments Industry Market Report: 2019-2033
This comprehensive report provides an in-depth analysis of the global payments industry, encompassing market dynamics, growth trends, competitive landscape, and future outlook. The study period covers 2019-2033, with a focus on the 2025-2033 forecast period. The report segments the market by mode of payment (Point of Sale, Online Sale) and end-user industry (Retail, Entertainment, Healthcare, Hospitality, Others), offering granular insights into key market drivers and challenges. This report is a must-read for industry professionals, investors, and anyone seeking to understand the future of the global payments landscape.
Payments Industry Market Dynamics & Structure
This section analyzes the structure and dynamics of the global payments market, considering factors influencing its evolution. The market is characterized by high concentration among major players, such as Visa, Mastercard, and PayPal, though emerging fintech companies are increasingly challenging this dominance. Technological innovation, particularly in mobile and contactless payments, is a significant driver, while regulatory frameworks and evolving consumer preferences significantly shape market trends. The market is witnessing significant M&A activity as larger players seek to consolidate their position and expand their service offerings.
- Market Concentration: The top 5 players hold an estimated xx% market share in 2025.
- Technological Innovation: Contactless payments, mobile wallets, and real-time payment systems are key drivers.
- Regulatory Frameworks: Payment regulations (e.g., PSD2, GDPR) impact market dynamics and competitive strategies.
- Competitive Substitutes: The rise of Buy Now Pay Later (BNPL) services is reshaping the landscape.
- End-User Demographics: Millennials and Gen Z drive adoption of digital payment methods.
- M&A Activity: An estimated xx billion in M&A deals were recorded in the period 2019-2024.
Payments Industry Growth Trends & Insights
The global payments industry is experiencing robust growth, driven by the increasing adoption of digital payment methods and the expansion of e-commerce. The market size is projected to reach xx million by 2033, exhibiting a CAGR of xx% during the forecast period (2025-2033). This growth is fueled by several factors, including the rising penetration of smartphones and internet access, increased consumer trust in digital transactions, and the development of innovative payment solutions. Technological disruptions, like the rise of BNPL and embedded finance, are further accelerating market expansion. Consumer behavior shifts towards convenience and digitalization are playing a pivotal role in this transformation. The historical period (2019-2024) saw a CAGR of xx%, demonstrating sustained growth momentum. Market penetration of digital payments is expected to reach xx% globally by 2033.
Dominant Regions, Countries, or Segments in Payments Industry
North America currently leads the global payments market, driven by high digital adoption and a robust e-commerce sector. Within this region, the United States holds a significant market share. However, Asia-Pacific is projected to exhibit the fastest growth rate during the forecast period, fueled by burgeoning digital economies in countries like India and China. Online sales represent a rapidly expanding segment, outpacing the growth of point-of-sale transactions. The retail sector continues to be the largest end-user industry, while sectors like healthcare and hospitality are showing increasing adoption of digital payment technologies.
- Key Drivers:
- North America: High e-commerce penetration, robust digital infrastructure, and early adoption of new technologies.
- Asia-Pacific: Rapid growth of the digital economy, increasing smartphone penetration, and supportive government policies.
- Online Sales: Convenience, accessibility, and the growing preference for online shopping.
- Retail: High transaction volumes, established infrastructure, and integration with existing POS systems.
Payments Industry Product Landscape
The payments industry offers a diverse range of products, from traditional credit and debit cards to mobile wallets, online payment gateways, and real-time payment systems. Innovation is focused on enhancing security, improving user experience, and expanding functionality. Key features include biometric authentication, tokenization, and AI-driven fraud prevention. Companies are increasingly offering integrated solutions that combine various payment methods to cater to diverse customer needs.
Key Drivers, Barriers & Challenges in Payments Industry
Key Drivers:
- Technological advancements (e.g., mobile payments, AI, blockchain)
- Growing e-commerce and digitalization
- Increasing smartphone and internet penetration
- Favorable government policies supporting digital payments
Key Challenges:
- Cybersecurity threats and data breaches (estimated xx million in losses annually)
- Regulatory hurdles and compliance costs
- Intense competition and pricing pressures
- Integration challenges with legacy systems
Emerging Opportunities in Payments Industry
- Embedded finance: Integrating financial services into non-financial platforms.
- Open banking: Leveraging APIs for enhanced financial data access and innovative payment solutions.
- BNPL services: Expanding into underserved markets and offering tailored payment options.
- Cryptocurrency payments: Exploring opportunities in the evolving digital asset landscape.
Growth Accelerators in the Payments Industry Industry
Technological innovation, particularly in areas like artificial intelligence (AI) and blockchain, is set to accelerate industry growth. Strategic partnerships between fintech companies and established players are fostering collaboration and innovation. Expanding into underserved markets and offering tailored payment solutions to niche customer segments present further opportunities.
Key Players Shaping the Payments Industry Market
- Visa Inc
- PayPal Holdings Inc
- UnionPay International
- Amazon Pay (Amazon com Inc )
- American Express Company
- Mastercard Inc
- AliPay (Alibaba Group)
- Apple Pay (Apple Inc )
- Adyen
- Google Pay (Google LLC)
Notable Milestones in Payments Industry Sector
- October 2023: Square Capital LLC launches Tap to Pay on iPhone in Australia.
- July 2023: Grow Finance partners with Pismo to issue Mastercard credit cards for small businesses in Australia.
- April 2023: Stripe launches unified commerce solutions in Australia.
In-Depth Payments Industry Market Outlook
The future of the payments industry is bright, driven by continuous technological advancements, increasing digital adoption, and the expansion of e-commerce globally. Strategic partnerships, regulatory changes, and the emergence of innovative payment solutions will further shape market dynamics. The industry's growth trajectory is expected to remain robust, presenting significant opportunities for existing players and new entrants alike. The market's increasing complexity calls for strategic adaptation to competitive pressures and evolving customer preferences to fully capture future growth potential.
Payments Industry Segmentation
-
1. Mode of Payment
-
1.1. Point of Sale
- 1.1.1. Card Pay
- 1.1.2. Digital Wallet (includes Mobile Wallets)
- 1.1.3. Cash
- 1.1.4. Other Points of Sale
-
1.2. Online Sale
- 1.2.1. Other On
-
1.1. Point of Sale
-
2. End-user Industry
- 2.1. Retail
- 2.2. Entertainment
- 2.3. Healthcare
- 2.4. Hospitality
- 2.5. Other End-user Industries
Payments Industry Segmentation By Geography
- 1. North America
- 2. Europe
- 3. Asia Pacific
- 4. Latin America
- 5. Middle East
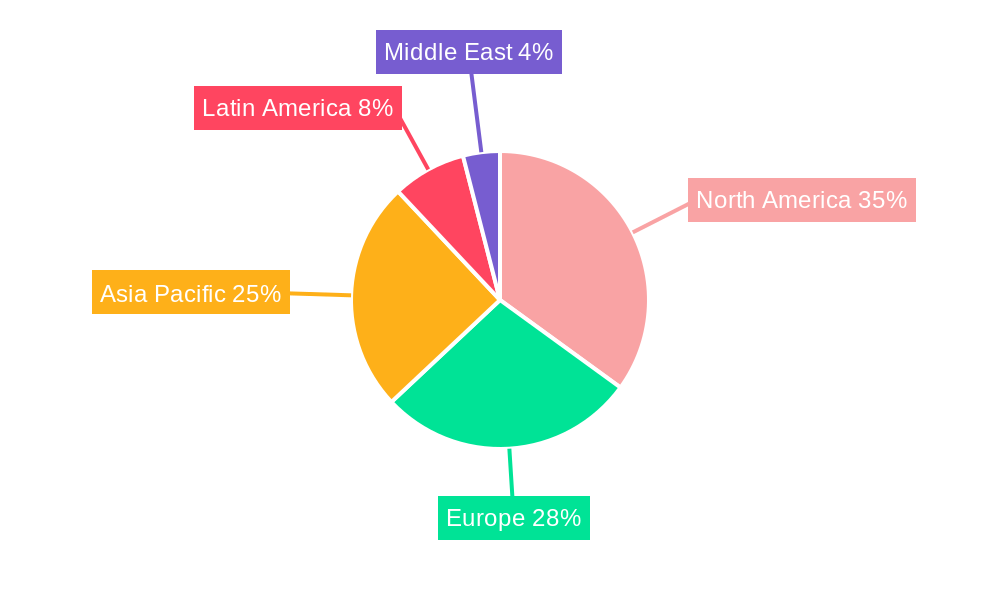
Payments Industry Regional Market Share
Geographic Coverage of Payments Industry
Payments Industry REPORT HIGHLIGHTS
| Aspects | Details |
|---|---|
| Study Period | 2020-2034 |
| Base Year | 2025 |
| Estimated Year | 2026 |
| Forecast Period | 2026-2034 |
| Historical Period | 2020-2025 |
| Growth Rate | CAGR of 10.88% from 2020-2034 |
| Segmentation |
|
Table of Contents
- 1. Introduction
- 1.1. Research Scope
- 1.2. Market Segmentation
- 1.3. Research Objective
- 1.4. Definitions and Assumptions
- 2. Executive Summary
- 2.1. Market Snapshot
- 3. Market Dynamics
- 3.1. Market Drivers
- 3.2. Market Restrains
- 3.3. Market Trends
- 3.4. Market Opportunities
- 4. Market Factor Analysis
- 4.1. Porters Five Forces
- 4.1.1. Bargaining Power of Suppliers
- 4.1.2. Bargaining Power of Buyers
- 4.1.3. Threat of New Entrants
- 4.1.4. Threat of Substitutes
- 4.1.5. Competitive Rivalry
- 4.2. PESTEL analysis
- 4.3. BCG Analysis
- 4.3.1. Stars (High Growth, High Market Share)
- 4.3.2. Cash Cows (Low Growth, High Market Share)
- 4.3.3. Question Mark (High Growth, Low Market Share)
- 4.3.4. Dogs (Low Growth, Low Market Share)
- 4.4. Ansoff Matrix Analysis
- 4.5. Supply Chain Analysis
- 4.6. Regulatory Landscape
- 4.7. Current Market Potential and Opportunity Assessment (TAM–SAM–SOM Framework)
- 4.8. IMR Analyst Note
- 4.1. Porters Five Forces
- 5. Market Analysis, Insights and Forecast 2021-2033
- 5.1. Market Analysis, Insights and Forecast - by Mode of Payment
- 5.1.1. Point of Sale
- 5.1.1.1. Card Pay
- 5.1.1.2. Digital Wallet (includes Mobile Wallets)
- 5.1.1.3. Cash
- 5.1.1.4. Other Points of Sale
- 5.1.2. Online Sale
- 5.1.2.1. Other On
- 5.1.1. Point of Sale
- 5.2. Market Analysis, Insights and Forecast - by End-user Industry
- 5.2.1. Retail
- 5.2.2. Entertainment
- 5.2.3. Healthcare
- 5.2.4. Hospitality
- 5.2.5. Other End-user Industries
- 5.3. Market Analysis, Insights and Forecast - by Region
- 5.3.1. North America
- 5.3.2. Europe
- 5.3.3. Asia Pacific
- 5.3.4. Latin America
- 5.3.5. Middle East
- 5.1. Market Analysis, Insights and Forecast - by Mode of Payment
- 6. Global Payments Industry Analysis, Insights and Forecast, 2021-2033
- 6.1. Market Analysis, Insights and Forecast - by Mode of Payment
- 6.1.1. Point of Sale
- 6.1.1.1. Card Pay
- 6.1.1.2. Digital Wallet (includes Mobile Wallets)
- 6.1.1.3. Cash
- 6.1.1.4. Other Points of Sale
- 6.1.2. Online Sale
- 6.1.2.1. Other On
- 6.1.1. Point of Sale
- 6.2. Market Analysis, Insights and Forecast - by End-user Industry
- 6.2.1. Retail
- 6.2.2. Entertainment
- 6.2.3. Healthcare
- 6.2.4. Hospitality
- 6.2.5. Other End-user Industries
- 6.1. Market Analysis, Insights and Forecast - by Mode of Payment
- 7. North America Payments Industry Analysis, Insights and Forecast, 2020-2032
- 7.1. Market Analysis, Insights and Forecast - by Mode of Payment
- 7.1.1. Point of Sale
- 7.1.1.1. Card Pay
- 7.1.1.2. Digital Wallet (includes Mobile Wallets)
- 7.1.1.3. Cash
- 7.1.1.4. Other Points of Sale
- 7.1.2. Online Sale
- 7.1.2.1. Other On
- 7.1.1. Point of Sale
- 7.2. Market Analysis, Insights and Forecast - by End-user Industry
- 7.2.1. Retail
- 7.2.2. Entertainment
- 7.2.3. Healthcare
- 7.2.4. Hospitality
- 7.2.5. Other End-user Industries
- 7.1. Market Analysis, Insights and Forecast - by Mode of Payment
- 8. Europe Payments Industry Analysis, Insights and Forecast, 2020-2032
- 8.1. Market Analysis, Insights and Forecast - by Mode of Payment
- 8.1.1. Point of Sale
- 8.1.1.1. Card Pay
- 8.1.1.2. Digital Wallet (includes Mobile Wallets)
- 8.1.1.3. Cash
- 8.1.1.4. Other Points of Sale
- 8.1.2. Online Sale
- 8.1.2.1. Other On
- 8.1.1. Point of Sale
- 8.2. Market Analysis, Insights and Forecast - by End-user Industry
- 8.2.1. Retail
- 8.2.2. Entertainment
- 8.2.3. Healthcare
- 8.2.4. Hospitality
- 8.2.5. Other End-user Industries
- 8.1. Market Analysis, Insights and Forecast - by Mode of Payment
- 9. Asia Pacific Payments Industry Analysis, Insights and Forecast, 2020-2032
- 9.1. Market Analysis, Insights and Forecast - by Mode of Payment
- 9.1.1. Point of Sale
- 9.1.1.1. Card Pay
- 9.1.1.2. Digital Wallet (includes Mobile Wallets)
- 9.1.1.3. Cash
- 9.1.1.4. Other Points of Sale
- 9.1.2. Online Sale
- 9.1.2.1. Other On
- 9.1.1. Point of Sale
- 9.2. Market Analysis, Insights and Forecast - by End-user Industry
- 9.2.1. Retail
- 9.2.2. Entertainment
- 9.2.3. Healthcare
- 9.2.4. Hospitality
- 9.2.5. Other End-user Industries
- 9.1. Market Analysis, Insights and Forecast - by Mode of Payment
- 10. Latin America Payments Industry Analysis, Insights and Forecast, 2020-2032
- 10.1. Market Analysis, Insights and Forecast - by Mode of Payment
- 10.1.1. Point of Sale
- 10.1.1.1. Card Pay
- 10.1.1.2. Digital Wallet (includes Mobile Wallets)
- 10.1.1.3. Cash
- 10.1.1.4. Other Points of Sale
- 10.1.2. Online Sale
- 10.1.2.1. Other On
- 10.1.1. Point of Sale
- 10.2. Market Analysis, Insights and Forecast - by End-user Industry
- 10.2.1. Retail
- 10.2.2. Entertainment
- 10.2.3. Healthcare
- 10.2.4. Hospitality
- 10.2.5. Other End-user Industries
- 10.1. Market Analysis, Insights and Forecast - by Mode of Payment
- 11. Middle East Payments Industry Analysis, Insights and Forecast, 2020-2032
- 11.1. Market Analysis, Insights and Forecast - by Mode of Payment
- 11.1.1. Point of Sale
- 11.1.1.1. Card Pay
- 11.1.1.2. Digital Wallet (includes Mobile Wallets)
- 11.1.1.3. Cash
- 11.1.1.4. Other Points of Sale
- 11.1.2. Online Sale
- 11.1.2.1. Other On
- 11.1.1. Point of Sale
- 11.2. Market Analysis, Insights and Forecast - by End-user Industry
- 11.2.1. Retail
- 11.2.2. Entertainment
- 11.2.3. Healthcare
- 11.2.4. Hospitality
- 11.2.5. Other End-user Industries
- 11.1. Market Analysis, Insights and Forecast - by Mode of Payment
- 12. Competitive Analysis
- 12.1. Company Profiles
- 12.1.1 Visa Inc
- 12.1.1.1. Company Overview
- 12.1.1.2. Products
- 12.1.1.3. Company Financials
- 12.1.1.4. SWOT Analysis
- 12.1.2 PayPal Holdings Inc
- 12.1.2.1. Company Overview
- 12.1.2.2. Products
- 12.1.2.3. Company Financials
- 12.1.2.4. SWOT Analysis
- 12.1.3 UnionPay International
- 12.1.3.1. Company Overview
- 12.1.3.2. Products
- 12.1.3.3. Company Financials
- 12.1.3.4. SWOT Analysis
- 12.1.4 Amazon Pay (Amazon com Inc )
- 12.1.4.1. Company Overview
- 12.1.4.2. Products
- 12.1.4.3. Company Financials
- 12.1.4.4. SWOT Analysis
- 12.1.5 American Express Company
- 12.1.5.1. Company Overview
- 12.1.5.2. Products
- 12.1.5.3. Company Financials
- 12.1.5.4. SWOT Analysis
- 12.1.6 Mastercard Inc
- 12.1.6.1. Company Overview
- 12.1.6.2. Products
- 12.1.6.3. Company Financials
- 12.1.6.4. SWOT Analysis
- 12.1.7 AliPay (Alibaba Group)
- 12.1.7.1. Company Overview
- 12.1.7.2. Products
- 12.1.7.3. Company Financials
- 12.1.7.4. SWOT Analysis
- 12.1.8 Apple Pay (Apple Inc )
- 12.1.8.1. Company Overview
- 12.1.8.2. Products
- 12.1.8.3. Company Financials
- 12.1.8.4. SWOT Analysis
- 12.1.9 Adyen*List Not Exhaustive
- 12.1.9.1. Company Overview
- 12.1.9.2. Products
- 12.1.9.3. Company Financials
- 12.1.9.4. SWOT Analysis
- 12.1.10 Google Pay (Google LLC)
- 12.1.10.1. Company Overview
- 12.1.10.2. Products
- 12.1.10.3. Company Financials
- 12.1.10.4. SWOT Analysis
- 12.1.1 Visa Inc
- 12.2. Market Entropy
- 12.2.1 Company's Key Areas Served
- 12.2.2 Recent Developments
- 12.3. Company Market Share Analysis 2025
- 12.3.1 Top 5 Companies Market Share Analysis
- 12.3.2 Top 3 Companies Market Share Analysis
- 12.4. List of Potential Customers
- 13. Research Methodology
List of Figures
- Figure 1: Global Payments Industry Revenue Breakdown (Million, %) by Region 2025 & 2033
- Figure 2: North America Payments Industry Revenue (Million), by Mode of Payment 2025 & 2033
- Figure 3: North America Payments Industry Revenue Share (%), by Mode of Payment 2025 & 2033
- Figure 4: North America Payments Industry Revenue (Million), by End-user Industry 2025 & 2033
- Figure 5: North America Payments Industry Revenue Share (%), by End-user Industry 2025 & 2033
- Figure 6: North America Payments Industry Revenue (Million), by Country 2025 & 2033
- Figure 7: North America Payments Industry Revenue Share (%), by Country 2025 & 2033
- Figure 8: Europe Payments Industry Revenue (Million), by Mode of Payment 2025 & 2033
- Figure 9: Europe Payments Industry Revenue Share (%), by Mode of Payment 2025 & 2033
- Figure 10: Europe Payments Industry Revenue (Million), by End-user Industry 2025 & 2033
- Figure 11: Europe Payments Industry Revenue Share (%), by End-user Industry 2025 & 2033
- Figure 12: Europe Payments Industry Revenue (Million), by Country 2025 & 2033
- Figure 13: Europe Payments Industry Revenue Share (%), by Country 2025 & 2033
- Figure 14: Asia Pacific Payments Industry Revenue (Million), by Mode of Payment 2025 & 2033
- Figure 15: Asia Pacific Payments Industry Revenue Share (%), by Mode of Payment 2025 & 2033
- Figure 16: Asia Pacific Payments Industry Revenue (Million), by End-user Industry 2025 & 2033
- Figure 17: Asia Pacific Payments Industry Revenue Share (%), by End-user Industry 2025 & 2033
- Figure 18: Asia Pacific Payments Industry Revenue (Million), by Country 2025 & 2033
- Figure 19: Asia Pacific Payments Industry Revenue Share (%), by Country 2025 & 2033
- Figure 20: Latin America Payments Industry Revenue (Million), by Mode of Payment 2025 & 2033
- Figure 21: Latin America Payments Industry Revenue Share (%), by Mode of Payment 2025 & 2033
- Figure 22: Latin America Payments Industry Revenue (Million), by End-user Industry 2025 & 2033
- Figure 23: Latin America Payments Industry Revenue Share (%), by End-user Industry 2025 & 2033
- Figure 24: Latin America Payments Industry Revenue (Million), by Country 2025 & 2033
- Figure 25: Latin America Payments Industry Revenue Share (%), by Country 2025 & 2033
- Figure 26: Middle East Payments Industry Revenue (Million), by Mode of Payment 2025 & 2033
- Figure 27: Middle East Payments Industry Revenue Share (%), by Mode of Payment 2025 & 2033
- Figure 28: Middle East Payments Industry Revenue (Million), by End-user Industry 2025 & 2033
- Figure 29: Middle East Payments Industry Revenue Share (%), by End-user Industry 2025 & 2033
- Figure 30: Middle East Payments Industry Revenue (Million), by Country 2025 & 2033
- Figure 31: Middle East Payments Industry Revenue Share (%), by Country 2025 & 2033
List of Tables
- Table 1: Global Payments Industry Revenue Million Forecast, by Mode of Payment 2020 & 2033
- Table 2: Global Payments Industry Revenue Million Forecast, by End-user Industry 2020 & 2033
- Table 3: Global Payments Industry Revenue Million Forecast, by Region 2020 & 2033
- Table 4: Global Payments Industry Revenue Million Forecast, by Mode of Payment 2020 & 2033
- Table 5: Global Payments Industry Revenue Million Forecast, by End-user Industry 2020 & 2033
- Table 6: Global Payments Industry Revenue Million Forecast, by Country 2020 & 2033
- Table 7: Global Payments Industry Revenue Million Forecast, by Mode of Payment 2020 & 2033
- Table 8: Global Payments Industry Revenue Million Forecast, by End-user Industry 2020 & 2033
- Table 9: Global Payments Industry Revenue Million Forecast, by Country 2020 & 2033
- Table 10: Global Payments Industry Revenue Million Forecast, by Mode of Payment 2020 & 2033
- Table 11: Global Payments Industry Revenue Million Forecast, by End-user Industry 2020 & 2033
- Table 12: Global Payments Industry Revenue Million Forecast, by Country 2020 & 2033
- Table 13: Global Payments Industry Revenue Million Forecast, by Mode of Payment 2020 & 2033
- Table 14: Global Payments Industry Revenue Million Forecast, by End-user Industry 2020 & 2033
- Table 15: Global Payments Industry Revenue Million Forecast, by Country 2020 & 2033
- Table 16: Global Payments Industry Revenue Million Forecast, by Mode of Payment 2020 & 2033
- Table 17: Global Payments Industry Revenue Million Forecast, by End-user Industry 2020 & 2033
- Table 18: Global Payments Industry Revenue Million Forecast, by Country 2020 & 2033
Frequently Asked Questions
1. What is the projected Compound Annual Growth Rate (CAGR) of the Payments Industry?
The projected CAGR is approximately 10.88%.
2. Which companies are prominent players in the Payments Industry?
Key companies in the market include Visa Inc, PayPal Holdings Inc, UnionPay International, Amazon Pay (Amazon com Inc ), American Express Company, Mastercard Inc, AliPay (Alibaba Group), Apple Pay (Apple Inc ), Adyen*List Not Exhaustive, Google Pay (Google LLC).
3. What are the main segments of the Payments Industry?
The market segments include Mode of Payment, End-user Industry.
4. Can you provide details about the market size?
The market size is estimated to be USD 2.85 Million as of 2022.
5. What are some drivers contributing to market growth?
E-commerce Supported by the Rise of M-commerce is Expected to Drive the Market; Enablement Programs by Key Retailers and Government Encouraging Digitization of the Market; Growth of Real-time Payments in Various Countries.
6. What are the notable trends driving market growth?
The Payments have been Sharing wide Traction Owing to Rising Retail Sector.
7. Are there any restraints impacting market growth?
High Implementation and Maintenance Cost.
8. Can you provide examples of recent developments in the market?
October 2023 - Square Capital LLC announced the debut of Tap to Pay on iPhone in Australia, where Square would make the technology available to its sellers. Tap to Pay on iPhone is available in the Square Point of Sale, Square for Retail, and Square Appointments iOS apps. It allows vendors of all sizes to accept contactless payments directly from their iPhones, with no additional hardware required or expense.
9. What pricing options are available for accessing the report?
Pricing options include single-user, multi-user, and enterprise licenses priced at USD 4750, USD 5250, and USD 8750 respectively.
10. Is the market size provided in terms of value or volume?
The market size is provided in terms of value, measured in Million.
11. Are there any specific market keywords associated with the report?
Yes, the market keyword associated with the report is "Payments Industry," which aids in identifying and referencing the specific market segment covered.
12. How do I determine which pricing option suits my needs best?
The pricing options vary based on user requirements and access needs. Individual users may opt for single-user licenses, while businesses requiring broader access may choose multi-user or enterprise licenses for cost-effective access to the report.
13. Are there any additional resources or data provided in the Payments Industry report?
While the report offers comprehensive insights, it's advisable to review the specific contents or supplementary materials provided to ascertain if additional resources or data are available.
14. How can I stay updated on further developments or reports in the Payments Industry?
To stay informed about further developments, trends, and reports in the Payments Industry, consider subscribing to industry newsletters, following relevant companies and organizations, or regularly checking reputable industry news sources and publications.
Methodology
Step 1 - Identification of Relevant Samples Size from Population Database


Step 2 - Approaches for Defining Global Market Size (Value, Volume* & Price*)

Note*: In applicable scenarios
Step 3 - Data Sources
Primary Research
- Web Analytics
- Survey Reports
- Research Institute
- Latest Research Reports
- Opinion Leaders
Secondary Research
- Annual Reports
- White Paper
- Latest Press Release
- Industry Association
- Paid Database
- Investor Presentations

Step 4 - Data Triangulation
Involves using different sources of information in order to increase the validity of a study
These sources are likely to be stakeholders in a program - participants, other researchers, program staff, other community members, and so on.
Then we put all data in single framework & apply various statistical tools to find out the dynamic on the market.
During the analysis stage, feedback from the stakeholder groups would be compared to determine areas of agreement as well as areas of divergence