

Key Insights
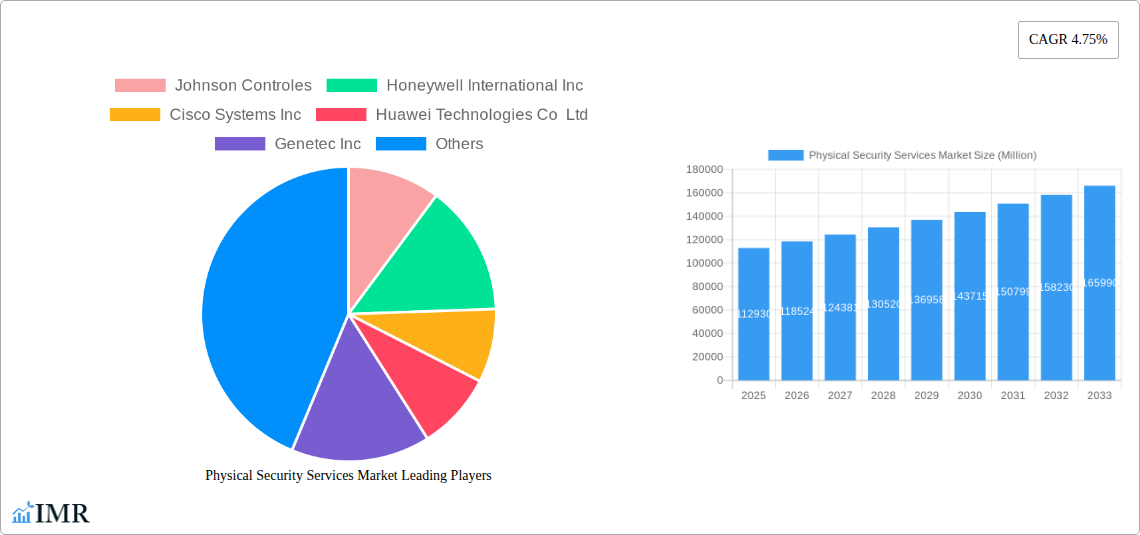
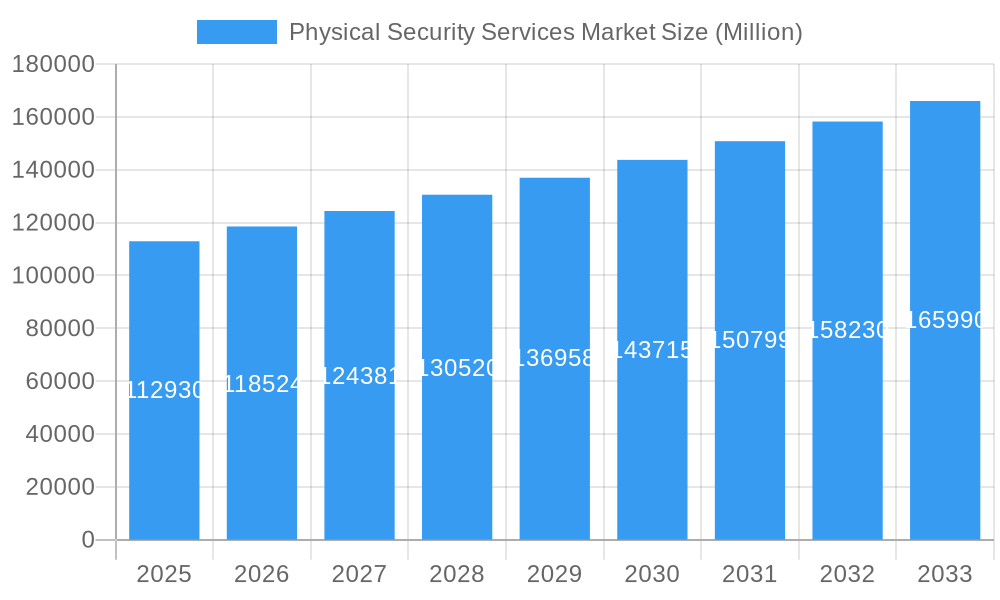
The global Physical Security Services market, valued at $112.93 billion in 2025, is projected to experience robust growth, driven by increasing concerns about security threats across various sectors. The compound annual growth rate (CAGR) of 4.75% from 2025 to 2033 indicates a significant expansion of this market over the forecast period. Key drivers include the rising adoption of advanced security technologies like video surveillance, access control systems, and intrusion detection systems, fueled by technological advancements and decreasing costs. Furthermore, the increasing prevalence of cyber threats and the need for robust cybersecurity measures integrated with physical security are significantly boosting market demand. Growth is also propelled by the rising adoption of cloud-based security solutions, offering scalability and remote management capabilities. The market is segmented by service type (e.g., guarding, monitoring, consulting), technology (e.g., video surveillance, access control), end-user (e.g., government, commercial, residential), and geography. Leading players like Johnson Controls, Honeywell International, Cisco Systems, and others are strategically investing in R&D and mergers & acquisitions to consolidate their market positions and expand their service offerings. Despite the positive outlook, factors like economic fluctuations and the potential for regulatory changes could act as restraints on market growth.
Physical Security Services Market Market Size (In Billion)
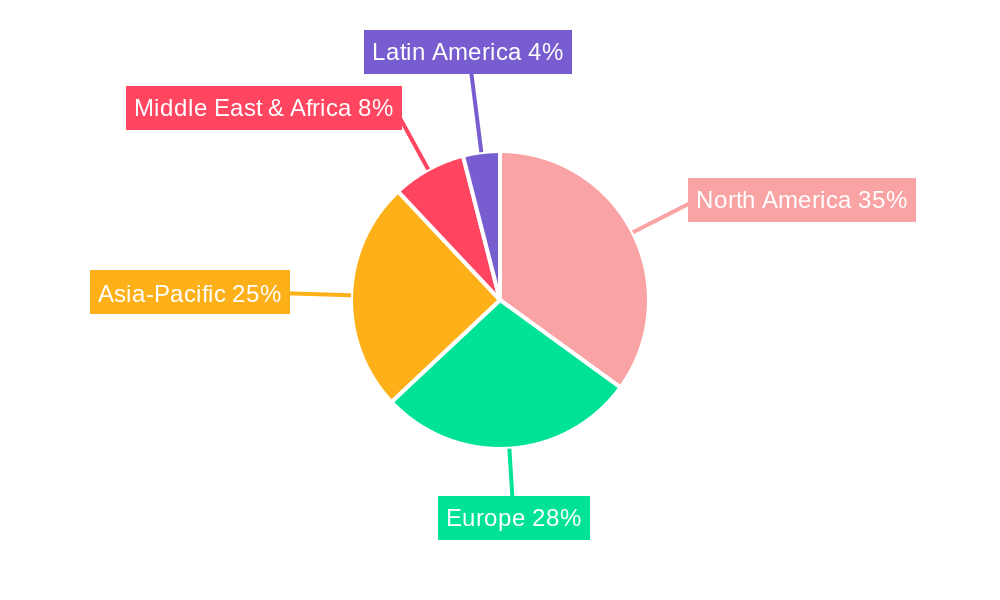
The market's regional distribution likely reflects the varying levels of economic development and security concerns across different geographic regions. North America and Europe are expected to maintain significant market shares due to high technological adoption and stringent security regulations. However, regions like Asia-Pacific are expected to witness faster growth rates, driven by rapid urbanization and industrialization. The competitive landscape is characterized by both large multinational corporations and specialized regional players. Future market growth will heavily depend on the continued development and integration of advanced technologies, the evolving security needs of various industries, and the successful implementation of robust cybersecurity strategies that complement physical security measures. The market is poised for sustained growth, reflecting the increasing importance of securing assets and safeguarding individuals in a world facing growing security threats.
Physical Security Services Market Company Market Share
Physical Security Services Market: A Comprehensive Report (2019-2033)
This comprehensive report provides a detailed analysis of the Physical Security Services Market, encompassing its current state, future trajectory, and key players. With a study period spanning 2019-2033, a base year of 2025, and a forecast period of 2025-2033, this report offers invaluable insights for industry professionals, investors, and strategic decision-makers. The report covers parent markets like security systems and child markets like access control systems and video surveillance. The global market size is estimated at XX million in 2025 and is projected to reach XX million by 2033.
Physical Security Services Market Dynamics & Structure
The Physical Security Services market is characterized by moderate concentration, with a few major players holding significant market share. Johnson Controls, Honeywell International Inc., Cisco Systems Inc., and Huawei Technologies Co. Ltd. are among the dominant players. However, the market also includes numerous smaller, specialized firms focusing on niche segments. Technological innovation, particularly in areas like AI-powered surveillance and biometrics, is a key driver. Stringent government regulations concerning data privacy and security are also shaping market dynamics. Competitive substitutes include DIY security systems and cloud-based solutions. The end-user demographics are diverse, spanning various industries including government, commercial, and residential sectors. Market consolidation through mergers and acquisitions (M&A) is also prominent, with an estimated XX M&A deals in the historical period (2019-2024).
- Market Concentration: Moderately concentrated, with top 5 players holding approximately XX% market share.
- Technological Drivers: AI, biometrics, IoT integration, cloud-based security solutions.
- Regulatory Frameworks: Increasingly stringent data privacy regulations impacting service offerings.
- Competitive Substitutes: DIY security systems, cloud-based security platforms.
- End-User Demographics: Government, commercial, industrial, residential.
- M&A Trends: XX M&A deals in 2019-2024, indicating ongoing consolidation.
- Innovation Barriers: High R&D costs, integration complexities, cybersecurity concerns.
Physical Security Services Market Growth Trends & Insights
The Physical Security Services Market has witnessed robust growth over the historical period (2019-2024), driven by rising security concerns across various sectors and advancements in technology. The market size experienced a CAGR of XX% from 2019 to 2024, reaching an estimated value of XX million in 2024. This growth is expected to continue at a CAGR of XX% during the forecast period (2025-2033), driven by increasing adoption of advanced security technologies, growing awareness about cybersecurity threats, and rising demand for integrated security solutions. Market penetration is currently at XX% and projected to reach XX% by 2033. Consumer behavior is shifting towards integrated, cloud-based solutions offering enhanced convenience and remote management capabilities. Technological disruptions, such as the rise of AI and IoT, are revolutionizing the sector, creating opportunities for innovative service offerings. The increasing adoption of smart cities initiatives is further driving market growth.
Dominant Regions, Countries, or Segments in Physical Security Services Market
North America currently holds the largest market share, driven by high security spending in the government and commercial sectors, as well as technological advancements in the region. Europe follows as a significant market, with robust growth expected in developing economies such as those in Asia-Pacific. The access control segment dominates the market, followed by video surveillance and perimeter security.
- North America: High security spending, technological innovation, robust regulatory frameworks.
- Europe: Strong government investment in security infrastructure, growing awareness of cybersecurity threats.
- Asia-Pacific: Rapid urbanization, increasing adoption of advanced security technologies, strong economic growth.
- Access Control Systems: Highest market share due to increasing demand for secure access management.
- Video Surveillance: Significant growth due to improvements in image quality and analytics capabilities.
Physical Security Services Market Product Landscape
The Physical Security Services market offers a wide range of products, including access control systems, video surveillance equipment, intrusion detection systems, perimeter security solutions, and integrated security management platforms. Recent innovations focus on AI-powered analytics, biometrics, cloud-based solutions, and IoT integration. Products are increasingly characterized by improved performance metrics like higher resolution, faster response times, and enhanced data security. Unique selling propositions include seamless integration, user-friendly interfaces, and advanced analytics capabilities. These advancements improve the overall effectiveness and efficiency of security operations.
Key Drivers, Barriers & Challenges in Physical Security Services Market
Key Drivers:
- Growing security concerns due to rising crime rates and terrorist threats.
- Technological advancements in security systems.
- Increasing government regulations and compliance requirements.
- The growing adoption of cloud-based security solutions and the IoT.
Challenges & Restraints:
- High initial investment costs associated with implementing sophisticated security systems.
- The complexity of integrating various security systems.
- Cybersecurity vulnerabilities and data breaches.
- Potential economic downturns impacting investments in security measures.
Emerging Opportunities in Physical Security Services Market
- Increasing adoption of AI and machine learning for advanced threat detection and response.
- Growing demand for integrated security solutions that combine various security technologies.
- The emergence of smart city initiatives creating opportunities for advanced security systems.
- Expanding market in developing economies with growing infrastructure development and increased security needs.
Growth Accelerators in the Physical Security Services Market Industry
Technological innovation remains a key driver. Partnerships between security companies and technology firms foster the integration of AI, IoT, and cloud computing, leading to more robust and integrated solutions. Market expansion into developing regions and untapped sectors contributes to growth. Strategic acquisitions and mergers further consolidate the market and accelerate growth.
Key Players Shaping the Physical Security Services Market Market
- Johnson Controls
- Honeywell International Inc.
- Cisco Systems Inc.
- Huawei Technologies Co. Ltd.
- Genetec Inc.
- G4S
- Securitas
- Secom
- Prosegur
- Brinks
- Loomis
- Allied Barton
- Garda
- Relianc
Notable Milestones in Physical Security Services Market Sector
- May 2024: ZKTeco East Africa partners with Mart Networks Group Ltd., showcasing new products in time and attendance, access control, smart locks, and video surveillance.
- February 2024: ENSCO Inc. launches the Center for Critical Infrastructure Protection (CCIP) to provide comprehensive cyber and physical security solutions to the DoD.
In-Depth Physical Security Services Market Market Outlook
The Physical Security Services market is poised for continued growth driven by the convergence of technologies like AI, IoT, and cloud computing. The increasing demand for integrated security solutions and expanding market penetration in developing economies present significant opportunities for growth. Strategic partnerships and acquisitions will likely further shape market dynamics. The focus on enhancing cybersecurity and data privacy will remain paramount, driving innovation and market expansion.
Physical Security Services Market Segmentation
-
1. Component
-
1.1. By Solution
- 1.1.1. Access Control System
- 1.1.2. Video Surveillance System
- 1.1.3. Security Scanning, Metal Detection, and Imaging
- 1.1.4. Fire and Life Safety
- 1.1.5. Others
-
1.2. By Service Type
- 1.2.1. Professional Services
- 1.2.2. Managed Services
-
1.1. By Solution
-
2. End User Industry
- 2.1. Manufacturing and Industrial
- 2.2. IT and Telecom
- 2.3. BFSI
- 2.4. Retail
- 2.5. Residential
- 2.6. Public Infrastructure (Airports, etc.)
- 2.7. Other End Users
Physical Security Services Market Segmentation By Geography
- 1. North America
- 2. Europe
- 3. Asia
- 4. Australia and New Zealand
- 5. Latin America
- 6. Middle East and Africa
Physical Security Services Market Regional Market Share
Geographic Coverage of Physical Security Services Market
Physical Security Services Market REPORT HIGHLIGHTS
| Aspects | Details |
|---|---|
| Study Period | 2020-2034 |
| Base Year | 2025 |
| Estimated Year | 2026 |
| Forecast Period | 2026-2034 |
| Historical Period | 2020-2025 |
| Growth Rate | CAGR of 4.75% from 2020-2034 |
| Segmentation |
|
Table of Contents
- 1. Introduction
- 1.1. Research Scope
- 1.2. Market Segmentation
- 1.3. Research Objective
- 1.4. Definitions and Assumptions
- 2. Executive Summary
- 2.1. Market Snapshot
- 3. Market Dynamics
- 3.1. Market Drivers
- 3.2. Market Restrains
- 3.3. Market Trends
- 3.4. Market Opportunities
- 4. Market Factor Analysis
- 4.1. Porters Five Forces
- 4.1.1. Bargaining Power of Suppliers
- 4.1.2. Bargaining Power of Buyers
- 4.1.3. Threat of New Entrants
- 4.1.4. Threat of Substitutes
- 4.1.5. Competitive Rivalry
- 4.2. PESTEL analysis
- 4.3. BCG Analysis
- 4.3.1. Stars (High Growth, High Market Share)
- 4.3.2. Cash Cows (Low Growth, High Market Share)
- 4.3.3. Question Mark (High Growth, Low Market Share)
- 4.3.4. Dogs (Low Growth, Low Market Share)
- 4.4. Ansoff Matrix Analysis
- 4.5. Supply Chain Analysis
- 4.6. Regulatory Landscape
- 4.7. Current Market Potential and Opportunity Assessment (TAM–SAM–SOM Framework)
- 4.8. IMR Analyst Note
- 4.1. Porters Five Forces
- 5. Market Analysis, Insights and Forecast 2021-2033
- 5.1. Market Analysis, Insights and Forecast - by Component
- 5.1.1. By Solution
- 5.1.1.1. Access Control System
- 5.1.1.2. Video Surveillance System
- 5.1.1.3. Security Scanning, Metal Detection, and Imaging
- 5.1.1.4. Fire and Life Safety
- 5.1.1.5. Others
- 5.1.2. By Service Type
- 5.1.2.1. Professional Services
- 5.1.2.2. Managed Services
- 5.1.1. By Solution
- 5.2. Market Analysis, Insights and Forecast - by End User Industry
- 5.2.1. Manufacturing and Industrial
- 5.2.2. IT and Telecom
- 5.2.3. BFSI
- 5.2.4. Retail
- 5.2.5. Residential
- 5.2.6. Public Infrastructure (Airports, etc.)
- 5.2.7. Other End Users
- 5.3. Market Analysis, Insights and Forecast - by Region
- 5.3.1. North America
- 5.3.2. Europe
- 5.3.3. Asia
- 5.3.4. Australia and New Zealand
- 5.3.5. Latin America
- 5.3.6. Middle East and Africa
- 5.1. Market Analysis, Insights and Forecast - by Component
- 6. Global Physical Security Services Market Analysis, Insights and Forecast, 2021-2033
- 6.1. Market Analysis, Insights and Forecast - by Component
- 6.1.1. By Solution
- 6.1.1.1. Access Control System
- 6.1.1.2. Video Surveillance System
- 6.1.1.3. Security Scanning, Metal Detection, and Imaging
- 6.1.1.4. Fire and Life Safety
- 6.1.1.5. Others
- 6.1.2. By Service Type
- 6.1.2.1. Professional Services
- 6.1.2.2. Managed Services
- 6.1.1. By Solution
- 6.2. Market Analysis, Insights and Forecast - by End User Industry
- 6.2.1. Manufacturing and Industrial
- 6.2.2. IT and Telecom
- 6.2.3. BFSI
- 6.2.4. Retail
- 6.2.5. Residential
- 6.2.6. Public Infrastructure (Airports, etc.)
- 6.2.7. Other End Users
- 6.1. Market Analysis, Insights and Forecast - by Component
- 7. North America Physical Security Services Market Analysis, Insights and Forecast, 2020-2032
- 7.1. Market Analysis, Insights and Forecast - by Component
- 7.1.1. By Solution
- 7.1.1.1. Access Control System
- 7.1.1.2. Video Surveillance System
- 7.1.1.3. Security Scanning, Metal Detection, and Imaging
- 7.1.1.4. Fire and Life Safety
- 7.1.1.5. Others
- 7.1.2. By Service Type
- 7.1.2.1. Professional Services
- 7.1.2.2. Managed Services
- 7.1.1. By Solution
- 7.2. Market Analysis, Insights and Forecast - by End User Industry
- 7.2.1. Manufacturing and Industrial
- 7.2.2. IT and Telecom
- 7.2.3. BFSI
- 7.2.4. Retail
- 7.2.5. Residential
- 7.2.6. Public Infrastructure (Airports, etc.)
- 7.2.7. Other End Users
- 7.1. Market Analysis, Insights and Forecast - by Component
- 8. Europe Physical Security Services Market Analysis, Insights and Forecast, 2020-2032
- 8.1. Market Analysis, Insights and Forecast - by Component
- 8.1.1. By Solution
- 8.1.1.1. Access Control System
- 8.1.1.2. Video Surveillance System
- 8.1.1.3. Security Scanning, Metal Detection, and Imaging
- 8.1.1.4. Fire and Life Safety
- 8.1.1.5. Others
- 8.1.2. By Service Type
- 8.1.2.1. Professional Services
- 8.1.2.2. Managed Services
- 8.1.1. By Solution
- 8.2. Market Analysis, Insights and Forecast - by End User Industry
- 8.2.1. Manufacturing and Industrial
- 8.2.2. IT and Telecom
- 8.2.3. BFSI
- 8.2.4. Retail
- 8.2.5. Residential
- 8.2.6. Public Infrastructure (Airports, etc.)
- 8.2.7. Other End Users
- 8.1. Market Analysis, Insights and Forecast - by Component
- 9. Asia Physical Security Services Market Analysis, Insights and Forecast, 2020-2032
- 9.1. Market Analysis, Insights and Forecast - by Component
- 9.1.1. By Solution
- 9.1.1.1. Access Control System
- 9.1.1.2. Video Surveillance System
- 9.1.1.3. Security Scanning, Metal Detection, and Imaging
- 9.1.1.4. Fire and Life Safety
- 9.1.1.5. Others
- 9.1.2. By Service Type
- 9.1.2.1. Professional Services
- 9.1.2.2. Managed Services
- 9.1.1. By Solution
- 9.2. Market Analysis, Insights and Forecast - by End User Industry
- 9.2.1. Manufacturing and Industrial
- 9.2.2. IT and Telecom
- 9.2.3. BFSI
- 9.2.4. Retail
- 9.2.5. Residential
- 9.2.6. Public Infrastructure (Airports, etc.)
- 9.2.7. Other End Users
- 9.1. Market Analysis, Insights and Forecast - by Component
- 10. Australia and New Zealand Physical Security Services Market Analysis, Insights and Forecast, 2020-2032
- 10.1. Market Analysis, Insights and Forecast - by Component
- 10.1.1. By Solution
- 10.1.1.1. Access Control System
- 10.1.1.2. Video Surveillance System
- 10.1.1.3. Security Scanning, Metal Detection, and Imaging
- 10.1.1.4. Fire and Life Safety
- 10.1.1.5. Others
- 10.1.2. By Service Type
- 10.1.2.1. Professional Services
- 10.1.2.2. Managed Services
- 10.1.1. By Solution
- 10.2. Market Analysis, Insights and Forecast - by End User Industry
- 10.2.1. Manufacturing and Industrial
- 10.2.2. IT and Telecom
- 10.2.3. BFSI
- 10.2.4. Retail
- 10.2.5. Residential
- 10.2.6. Public Infrastructure (Airports, etc.)
- 10.2.7. Other End Users
- 10.1. Market Analysis, Insights and Forecast - by Component
- 11. Latin America Physical Security Services Market Analysis, Insights and Forecast, 2020-2032
- 11.1. Market Analysis, Insights and Forecast - by Component
- 11.1.1. By Solution
- 11.1.1.1. Access Control System
- 11.1.1.2. Video Surveillance System
- 11.1.1.3. Security Scanning, Metal Detection, and Imaging
- 11.1.1.4. Fire and Life Safety
- 11.1.1.5. Others
- 11.1.2. By Service Type
- 11.1.2.1. Professional Services
- 11.1.2.2. Managed Services
- 11.1.1. By Solution
- 11.2. Market Analysis, Insights and Forecast - by End User Industry
- 11.2.1. Manufacturing and Industrial
- 11.2.2. IT and Telecom
- 11.2.3. BFSI
- 11.2.4. Retail
- 11.2.5. Residential
- 11.2.6. Public Infrastructure (Airports, etc.)
- 11.2.7. Other End Users
- 11.1. Market Analysis, Insights and Forecast - by Component
- 12. Middle East and Africa Physical Security Services Market Analysis, Insights and Forecast, 2020-2032
- 12.1. Market Analysis, Insights and Forecast - by Component
- 12.1.1. By Solution
- 12.1.1.1. Access Control System
- 12.1.1.2. Video Surveillance System
- 12.1.1.3. Security Scanning, Metal Detection, and Imaging
- 12.1.1.4. Fire and Life Safety
- 12.1.1.5. Others
- 12.1.2. By Service Type
- 12.1.2.1. Professional Services
- 12.1.2.2. Managed Services
- 12.1.1. By Solution
- 12.2. Market Analysis, Insights and Forecast - by End User Industry
- 12.2.1. Manufacturing and Industrial
- 12.2.2. IT and Telecom
- 12.2.3. BFSI
- 12.2.4. Retail
- 12.2.5. Residential
- 12.2.6. Public Infrastructure (Airports, etc.)
- 12.2.7. Other End Users
- 12.1. Market Analysis, Insights and Forecast - by Component
- 13. Competitive Analysis
- 13.1. Company Profiles
- 13.1.1 Johnson Controles
- 13.1.1.1. Company Overview
- 13.1.1.2. Products
- 13.1.1.3. Company Financials
- 13.1.1.4. SWOT Analysis
- 13.1.2 Honeywell International Inc
- 13.1.2.1. Company Overview
- 13.1.2.2. Products
- 13.1.2.3. Company Financials
- 13.1.2.4. SWOT Analysis
- 13.1.3 Cisco Systems Inc
- 13.1.3.1. Company Overview
- 13.1.3.2. Products
- 13.1.3.3. Company Financials
- 13.1.3.4. SWOT Analysis
- 13.1.4 Huawei Technologies Co Ltd
- 13.1.4.1. Company Overview
- 13.1.4.2. Products
- 13.1.4.3. Company Financials
- 13.1.4.4. SWOT Analysis
- 13.1.5 Genetec Inc
- 13.1.5.1. Company Overview
- 13.1.5.2. Products
- 13.1.5.3. Company Financials
- 13.1.5.4. SWOT Analysis
- 13.1.6 G4S
- 13.1.6.1. Company Overview
- 13.1.6.2. Products
- 13.1.6.3. Company Financials
- 13.1.6.4. SWOT Analysis
- 13.1.7 Securitas
- 13.1.7.1. Company Overview
- 13.1.7.2. Products
- 13.1.7.3. Company Financials
- 13.1.7.4. SWOT Analysis
- 13.1.8 Secom
- 13.1.8.1. Company Overview
- 13.1.8.2. Products
- 13.1.8.3. Company Financials
- 13.1.8.4. SWOT Analysis
- 13.1.9 Prosegur
- 13.1.9.1. Company Overview
- 13.1.9.2. Products
- 13.1.9.3. Company Financials
- 13.1.9.4. SWOT Analysis
- 13.1.10 Brinks
- 13.1.10.1. Company Overview
- 13.1.10.2. Products
- 13.1.10.3. Company Financials
- 13.1.10.4. SWOT Analysis
- 13.1.11 Loomis
- 13.1.11.1. Company Overview
- 13.1.11.2. Products
- 13.1.11.3. Company Financials
- 13.1.11.4. SWOT Analysis
- 13.1.12 Allied Barton
- 13.1.12.1. Company Overview
- 13.1.12.2. Products
- 13.1.12.3. Company Financials
- 13.1.12.4. SWOT Analysis
- 13.1.13 Garda
- 13.1.13.1. Company Overview
- 13.1.13.2. Products
- 13.1.13.3. Company Financials
- 13.1.13.4. SWOT Analysis
- 13.1.14 Relianc
- 13.1.14.1. Company Overview
- 13.1.14.2. Products
- 13.1.14.3. Company Financials
- 13.1.14.4. SWOT Analysis
- 13.1.1 Johnson Controles
- 13.2. Market Entropy
- 13.2.1 Company's Key Areas Served
- 13.2.2 Recent Developments
- 13.3. Company Market Share Analysis 2025
- 13.3.1 Top 5 Companies Market Share Analysis
- 13.3.2 Top 3 Companies Market Share Analysis
- 13.4. List of Potential Customers
- 14. Research Methodology
List of Figures
- Figure 1: Global Physical Security Services Market Revenue Breakdown (Million, %) by Region 2025 & 2033
- Figure 2: Global Physical Security Services Market Volume Breakdown (Billion, %) by Region 2025 & 2033
- Figure 3: North America Physical Security Services Market Revenue (Million), by Component 2025 & 2033
- Figure 4: North America Physical Security Services Market Volume (Billion), by Component 2025 & 2033
- Figure 5: North America Physical Security Services Market Revenue Share (%), by Component 2025 & 2033
- Figure 6: North America Physical Security Services Market Volume Share (%), by Component 2025 & 2033
- Figure 7: North America Physical Security Services Market Revenue (Million), by End User Industry 2025 & 2033
- Figure 8: North America Physical Security Services Market Volume (Billion), by End User Industry 2025 & 2033
- Figure 9: North America Physical Security Services Market Revenue Share (%), by End User Industry 2025 & 2033
- Figure 10: North America Physical Security Services Market Volume Share (%), by End User Industry 2025 & 2033
- Figure 11: North America Physical Security Services Market Revenue (Million), by Country 2025 & 2033
- Figure 12: North America Physical Security Services Market Volume (Billion), by Country 2025 & 2033
- Figure 13: North America Physical Security Services Market Revenue Share (%), by Country 2025 & 2033
- Figure 14: North America Physical Security Services Market Volume Share (%), by Country 2025 & 2033
- Figure 15: Europe Physical Security Services Market Revenue (Million), by Component 2025 & 2033
- Figure 16: Europe Physical Security Services Market Volume (Billion), by Component 2025 & 2033
- Figure 17: Europe Physical Security Services Market Revenue Share (%), by Component 2025 & 2033
- Figure 18: Europe Physical Security Services Market Volume Share (%), by Component 2025 & 2033
- Figure 19: Europe Physical Security Services Market Revenue (Million), by End User Industry 2025 & 2033
- Figure 20: Europe Physical Security Services Market Volume (Billion), by End User Industry 2025 & 2033
- Figure 21: Europe Physical Security Services Market Revenue Share (%), by End User Industry 2025 & 2033
- Figure 22: Europe Physical Security Services Market Volume Share (%), by End User Industry 2025 & 2033
- Figure 23: Europe Physical Security Services Market Revenue (Million), by Country 2025 & 2033
- Figure 24: Europe Physical Security Services Market Volume (Billion), by Country 2025 & 2033
- Figure 25: Europe Physical Security Services Market Revenue Share (%), by Country 2025 & 2033
- Figure 26: Europe Physical Security Services Market Volume Share (%), by Country 2025 & 2033
- Figure 27: Asia Physical Security Services Market Revenue (Million), by Component 2025 & 2033
- Figure 28: Asia Physical Security Services Market Volume (Billion), by Component 2025 & 2033
- Figure 29: Asia Physical Security Services Market Revenue Share (%), by Component 2025 & 2033
- Figure 30: Asia Physical Security Services Market Volume Share (%), by Component 2025 & 2033
- Figure 31: Asia Physical Security Services Market Revenue (Million), by End User Industry 2025 & 2033
- Figure 32: Asia Physical Security Services Market Volume (Billion), by End User Industry 2025 & 2033
- Figure 33: Asia Physical Security Services Market Revenue Share (%), by End User Industry 2025 & 2033
- Figure 34: Asia Physical Security Services Market Volume Share (%), by End User Industry 2025 & 2033
- Figure 35: Asia Physical Security Services Market Revenue (Million), by Country 2025 & 2033
- Figure 36: Asia Physical Security Services Market Volume (Billion), by Country 2025 & 2033
- Figure 37: Asia Physical Security Services Market Revenue Share (%), by Country 2025 & 2033
- Figure 38: Asia Physical Security Services Market Volume Share (%), by Country 2025 & 2033
- Figure 39: Australia and New Zealand Physical Security Services Market Revenue (Million), by Component 2025 & 2033
- Figure 40: Australia and New Zealand Physical Security Services Market Volume (Billion), by Component 2025 & 2033
- Figure 41: Australia and New Zealand Physical Security Services Market Revenue Share (%), by Component 2025 & 2033
- Figure 42: Australia and New Zealand Physical Security Services Market Volume Share (%), by Component 2025 & 2033
- Figure 43: Australia and New Zealand Physical Security Services Market Revenue (Million), by End User Industry 2025 & 2033
- Figure 44: Australia and New Zealand Physical Security Services Market Volume (Billion), by End User Industry 2025 & 2033
- Figure 45: Australia and New Zealand Physical Security Services Market Revenue Share (%), by End User Industry 2025 & 2033
- Figure 46: Australia and New Zealand Physical Security Services Market Volume Share (%), by End User Industry 2025 & 2033
- Figure 47: Australia and New Zealand Physical Security Services Market Revenue (Million), by Country 2025 & 2033
- Figure 48: Australia and New Zealand Physical Security Services Market Volume (Billion), by Country 2025 & 2033
- Figure 49: Australia and New Zealand Physical Security Services Market Revenue Share (%), by Country 2025 & 2033
- Figure 50: Australia and New Zealand Physical Security Services Market Volume Share (%), by Country 2025 & 2033
- Figure 51: Latin America Physical Security Services Market Revenue (Million), by Component 2025 & 2033
- Figure 52: Latin America Physical Security Services Market Volume (Billion), by Component 2025 & 2033
- Figure 53: Latin America Physical Security Services Market Revenue Share (%), by Component 2025 & 2033
- Figure 54: Latin America Physical Security Services Market Volume Share (%), by Component 2025 & 2033
- Figure 55: Latin America Physical Security Services Market Revenue (Million), by End User Industry 2025 & 2033
- Figure 56: Latin America Physical Security Services Market Volume (Billion), by End User Industry 2025 & 2033
- Figure 57: Latin America Physical Security Services Market Revenue Share (%), by End User Industry 2025 & 2033
- Figure 58: Latin America Physical Security Services Market Volume Share (%), by End User Industry 2025 & 2033
- Figure 59: Latin America Physical Security Services Market Revenue (Million), by Country 2025 & 2033
- Figure 60: Latin America Physical Security Services Market Volume (Billion), by Country 2025 & 2033
- Figure 61: Latin America Physical Security Services Market Revenue Share (%), by Country 2025 & 2033
- Figure 62: Latin America Physical Security Services Market Volume Share (%), by Country 2025 & 2033
- Figure 63: Middle East and Africa Physical Security Services Market Revenue (Million), by Component 2025 & 2033
- Figure 64: Middle East and Africa Physical Security Services Market Volume (Billion), by Component 2025 & 2033
- Figure 65: Middle East and Africa Physical Security Services Market Revenue Share (%), by Component 2025 & 2033
- Figure 66: Middle East and Africa Physical Security Services Market Volume Share (%), by Component 2025 & 2033
- Figure 67: Middle East and Africa Physical Security Services Market Revenue (Million), by End User Industry 2025 & 2033
- Figure 68: Middle East and Africa Physical Security Services Market Volume (Billion), by End User Industry 2025 & 2033
- Figure 69: Middle East and Africa Physical Security Services Market Revenue Share (%), by End User Industry 2025 & 2033
- Figure 70: Middle East and Africa Physical Security Services Market Volume Share (%), by End User Industry 2025 & 2033
- Figure 71: Middle East and Africa Physical Security Services Market Revenue (Million), by Country 2025 & 2033
- Figure 72: Middle East and Africa Physical Security Services Market Volume (Billion), by Country 2025 & 2033
- Figure 73: Middle East and Africa Physical Security Services Market Revenue Share (%), by Country 2025 & 2033
- Figure 74: Middle East and Africa Physical Security Services Market Volume Share (%), by Country 2025 & 2033
List of Tables
- Table 1: Global Physical Security Services Market Revenue Million Forecast, by Component 2020 & 2033
- Table 2: Global Physical Security Services Market Volume Billion Forecast, by Component 2020 & 2033
- Table 3: Global Physical Security Services Market Revenue Million Forecast, by End User Industry 2020 & 2033
- Table 4: Global Physical Security Services Market Volume Billion Forecast, by End User Industry 2020 & 2033
- Table 5: Global Physical Security Services Market Revenue Million Forecast, by Region 2020 & 2033
- Table 6: Global Physical Security Services Market Volume Billion Forecast, by Region 2020 & 2033
- Table 7: Global Physical Security Services Market Revenue Million Forecast, by Component 2020 & 2033
- Table 8: Global Physical Security Services Market Volume Billion Forecast, by Component 2020 & 2033
- Table 9: Global Physical Security Services Market Revenue Million Forecast, by End User Industry 2020 & 2033
- Table 10: Global Physical Security Services Market Volume Billion Forecast, by End User Industry 2020 & 2033
- Table 11: Global Physical Security Services Market Revenue Million Forecast, by Country 2020 & 2033
- Table 12: Global Physical Security Services Market Volume Billion Forecast, by Country 2020 & 2033
- Table 13: Global Physical Security Services Market Revenue Million Forecast, by Component 2020 & 2033
- Table 14: Global Physical Security Services Market Volume Billion Forecast, by Component 2020 & 2033
- Table 15: Global Physical Security Services Market Revenue Million Forecast, by End User Industry 2020 & 2033
- Table 16: Global Physical Security Services Market Volume Billion Forecast, by End User Industry 2020 & 2033
- Table 17: Global Physical Security Services Market Revenue Million Forecast, by Country 2020 & 2033
- Table 18: Global Physical Security Services Market Volume Billion Forecast, by Country 2020 & 2033
- Table 19: Global Physical Security Services Market Revenue Million Forecast, by Component 2020 & 2033
- Table 20: Global Physical Security Services Market Volume Billion Forecast, by Component 2020 & 2033
- Table 21: Global Physical Security Services Market Revenue Million Forecast, by End User Industry 2020 & 2033
- Table 22: Global Physical Security Services Market Volume Billion Forecast, by End User Industry 2020 & 2033
- Table 23: Global Physical Security Services Market Revenue Million Forecast, by Country 2020 & 2033
- Table 24: Global Physical Security Services Market Volume Billion Forecast, by Country 2020 & 2033
- Table 25: Global Physical Security Services Market Revenue Million Forecast, by Component 2020 & 2033
- Table 26: Global Physical Security Services Market Volume Billion Forecast, by Component 2020 & 2033
- Table 27: Global Physical Security Services Market Revenue Million Forecast, by End User Industry 2020 & 2033
- Table 28: Global Physical Security Services Market Volume Billion Forecast, by End User Industry 2020 & 2033
- Table 29: Global Physical Security Services Market Revenue Million Forecast, by Country 2020 & 2033
- Table 30: Global Physical Security Services Market Volume Billion Forecast, by Country 2020 & 2033
- Table 31: Global Physical Security Services Market Revenue Million Forecast, by Component 2020 & 2033
- Table 32: Global Physical Security Services Market Volume Billion Forecast, by Component 2020 & 2033
- Table 33: Global Physical Security Services Market Revenue Million Forecast, by End User Industry 2020 & 2033
- Table 34: Global Physical Security Services Market Volume Billion Forecast, by End User Industry 2020 & 2033
- Table 35: Global Physical Security Services Market Revenue Million Forecast, by Country 2020 & 2033
- Table 36: Global Physical Security Services Market Volume Billion Forecast, by Country 2020 & 2033
- Table 37: Global Physical Security Services Market Revenue Million Forecast, by Component 2020 & 2033
- Table 38: Global Physical Security Services Market Volume Billion Forecast, by Component 2020 & 2033
- Table 39: Global Physical Security Services Market Revenue Million Forecast, by End User Industry 2020 & 2033
- Table 40: Global Physical Security Services Market Volume Billion Forecast, by End User Industry 2020 & 2033
- Table 41: Global Physical Security Services Market Revenue Million Forecast, by Country 2020 & 2033
- Table 42: Global Physical Security Services Market Volume Billion Forecast, by Country 2020 & 2033
Frequently Asked Questions
1. What is the projected Compound Annual Growth Rate (CAGR) of the Physical Security Services Market?
The projected CAGR is approximately 4.75%.
2. Which companies are prominent players in the Physical Security Services Market?
Key companies in the market include Johnson Controles, Honeywell International Inc, Cisco Systems Inc, Huawei Technologies Co Ltd, Genetec Inc, G4S, Securitas, Secom, Prosegur, Brinks, Loomis, Allied Barton, Garda, Relianc.
3. What are the main segments of the Physical Security Services Market?
The market segments include Component, End User Industry.
4. Can you provide details about the market size?
The market size is estimated to be USD 112.93 Million as of 2022.
5. What are some drivers contributing to market growth?
Favorable Changes in Regulatory Standards have Prompted the Use of Security Services from the Organized Sector; Dynamic Nature of the Security Threats. Especially. has Contributed the Demand for Cash Services to Safeguard Cash Transit.
6. What are the notable trends driving market growth?
The Demand for Physical Security Services is Growing in the BSFI Sector.
7. Are there any restraints impacting market growth?
Favorable Changes in Regulatory Standards have Prompted the Use of Security Services from the Organized Sector; Dynamic Nature of the Security Threats. Especially. has Contributed the Demand for Cash Services to Safeguard Cash Transit.
8. Can you provide examples of recent developments in the market?
May 2024: ZKTeco East Africa, a company providing security technology solutions, announced its partnership with Mart Networks Group Ltd at a security technology conference. ZKTecho showcased its newly launched products and solutions, including time and attendance, access control, smart locks, and video surveillance management. It also explores the potential and capabilities of ZKDigimax in digital advertising and displays cutting-edge physical security solutions from Armatura.
9. What pricing options are available for accessing the report?
Pricing options include single-user, multi-user, and enterprise licenses priced at USD 4750, USD 5250, and USD 8750 respectively.
10. Is the market size provided in terms of value or volume?
The market size is provided in terms of value, measured in Million and volume, measured in Billion.
11. Are there any specific market keywords associated with the report?
Yes, the market keyword associated with the report is "Physical Security Services Market," which aids in identifying and referencing the specific market segment covered.
12. How do I determine which pricing option suits my needs best?
The pricing options vary based on user requirements and access needs. Individual users may opt for single-user licenses, while businesses requiring broader access may choose multi-user or enterprise licenses for cost-effective access to the report.
13. Are there any additional resources or data provided in the Physical Security Services Market report?
While the report offers comprehensive insights, it's advisable to review the specific contents or supplementary materials provided to ascertain if additional resources or data are available.
14. How can I stay updated on further developments or reports in the Physical Security Services Market?
To stay informed about further developments, trends, and reports in the Physical Security Services Market, consider subscribing to industry newsletters, following relevant companies and organizations, or regularly checking reputable industry news sources and publications.
Methodology
Step 1 - Identification of Relevant Samples Size from Population Database


Step 2 - Approaches for Defining Global Market Size (Value, Volume* & Price*)

Note*: In applicable scenarios
Step 3 - Data Sources
Primary Research
- Web Analytics
- Survey Reports
- Research Institute
- Latest Research Reports
- Opinion Leaders
Secondary Research
- Annual Reports
- White Paper
- Latest Press Release
- Industry Association
- Paid Database
- Investor Presentations

Step 4 - Data Triangulation
Involves using different sources of information in order to increase the validity of a study
These sources are likely to be stakeholders in a program - participants, other researchers, program staff, other community members, and so on.
Then we put all data in single framework & apply various statistical tools to find out the dynamic on the market.
During the analysis stage, feedback from the stakeholder groups would be compared to determine areas of agreement as well as areas of divergence