

Key Insights
The global Power Plant Performance Optimization Solution market is poised for substantial growth, projected to reach an estimated $5,024 million by 2025, with a robust Compound Annual Growth Rate (CAGR) of 6.5% during the forecast period of 2025-2033. This upward trajectory is primarily driven by the increasing demand for enhanced operational efficiency, reduced emissions, and improved reliability across all power generation sectors, from small modular reactors to massive utility-scale facilities. The escalating complexity of power grids, the integration of renewable energy sources, and the continuous pressure to minimize operating costs are compelling power plant operators to adopt advanced performance optimization solutions. These solutions encompass a wide range of technologies and software, including sophisticated monitoring systems, predictive analytics, digital twins, and advanced control algorithms, all aimed at maximizing energy output while minimizing fuel consumption and environmental impact. The market's expansion is further fueled by stringent environmental regulations and the global push towards sustainable energy production, making performance optimization a critical factor for economic viability and regulatory compliance.
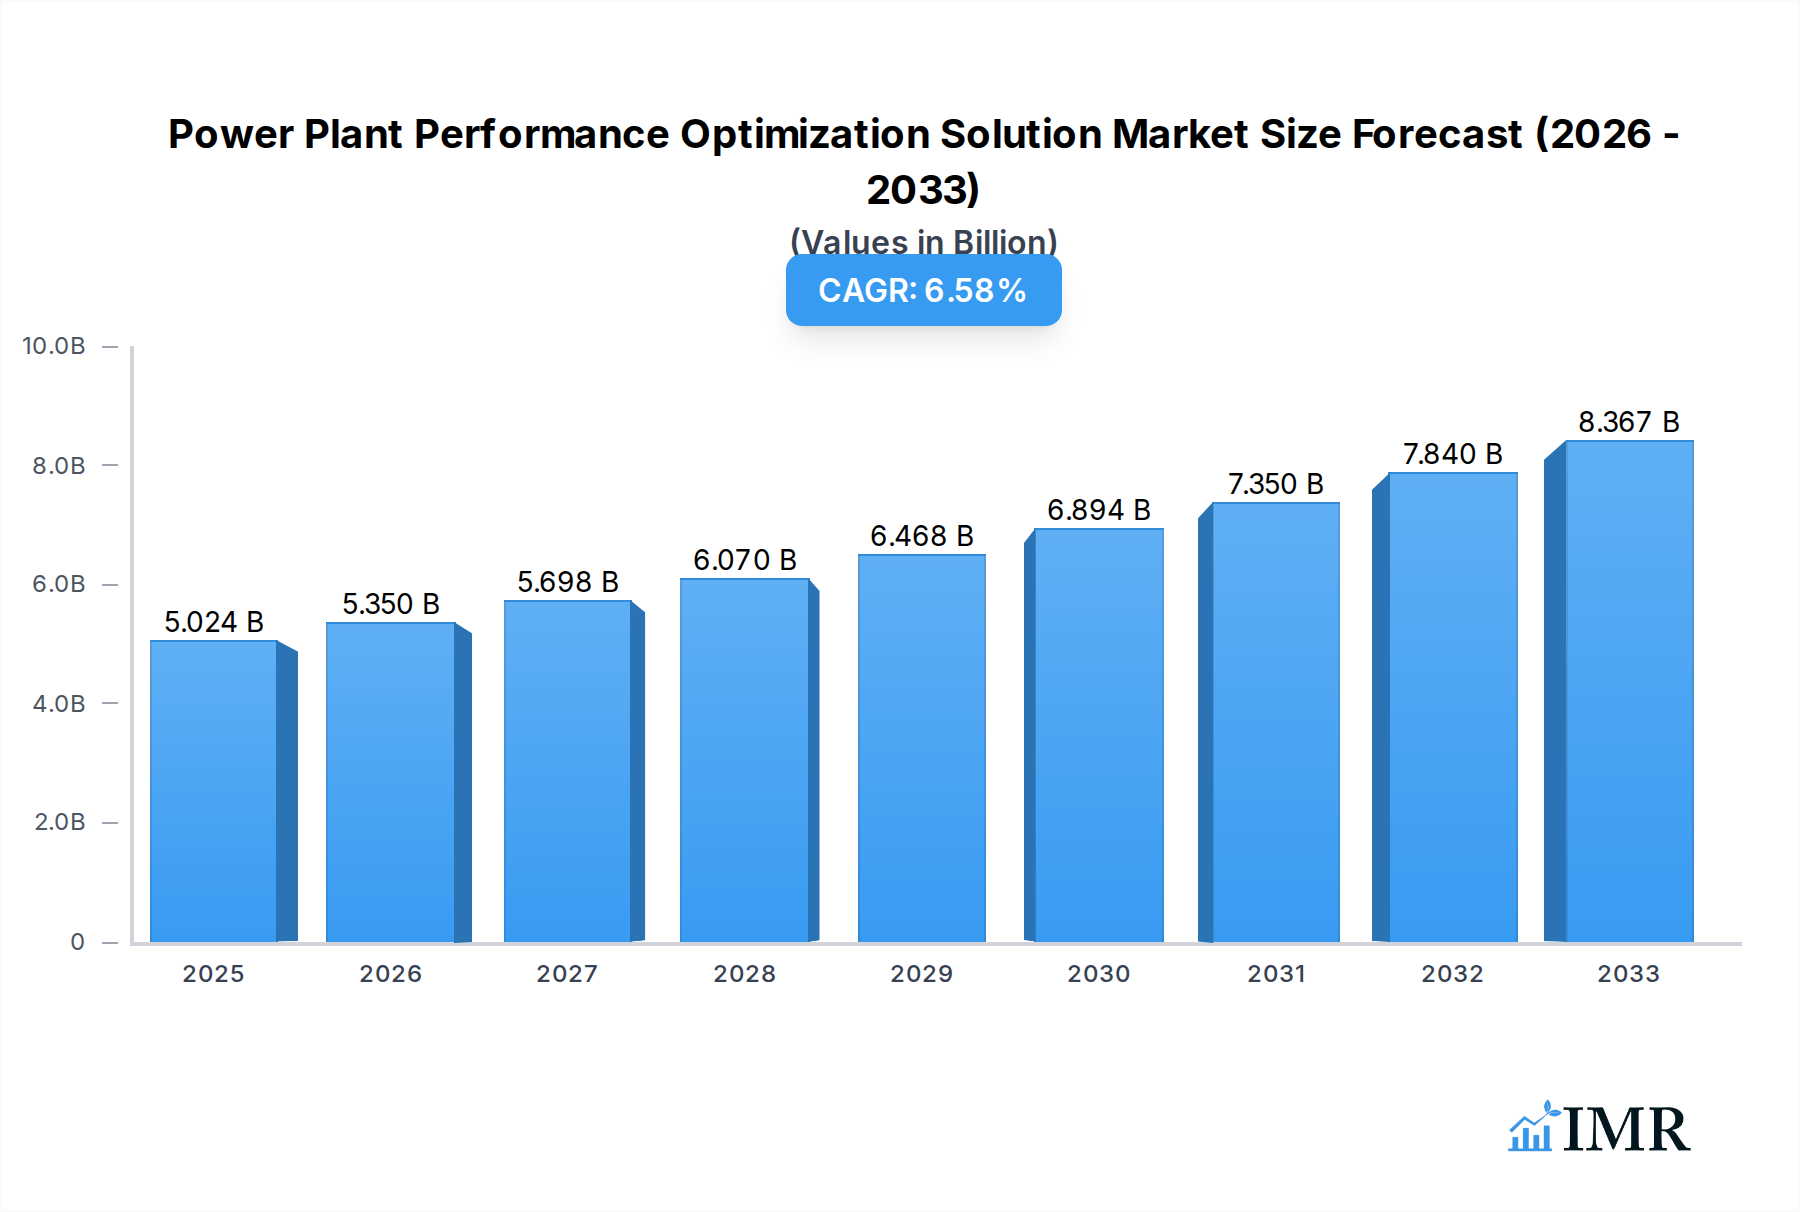
Power Plant Performance Optimization Solution Market Size (In Billion)
The market is characterized by a strong emphasis on both hardware and software-based solutions, with significant investment in integrated platforms that offer comprehensive performance management. The competitive landscape features established global players such as ABB, Honeywell, and Siemens, alongside specialized technology providers, all vying to offer cutting-edge solutions tailored to the diverse needs of small, medium, and large power plants. North America and Europe currently lead the market due to their advanced infrastructure and stringent environmental mandates, but the Asia Pacific region, particularly China and India, is anticipated to exhibit the fastest growth. This is attributable to rapid industrialization, increasing power demand, and a growing focus on modernizing existing power generation facilities. The evolving energy landscape, including the rise of distributed generation and smart grids, presents both opportunities and challenges, necessitating continuous innovation in performance optimization technologies to ensure grid stability and economic efficiency.

Power Plant Performance Optimization Solution Company Market Share
Unleashing Efficiency: Power Plant Performance Optimization Solution Market Report
This comprehensive report offers an in-depth analysis of the global Power Plant Performance Optimization Solution market, meticulously examining its dynamics, growth trajectories, and competitive landscape. Spanning a study period from 2019 to 2033, with 2025 as the base and estimated year, this report provides critical insights for industry stakeholders aiming to navigate and capitalize on this evolving sector. The forecast period (2025-2033) and historical data (2019-2024) are thoroughly analyzed to deliver actionable intelligence. We delve into market segmentation by Application (Small Power Plants (less than 100MW), Medium Power Plants (100-250MW), Large and Medium Power Plants (250-1000MW), Large Power Plants (more than 1000MW)) and Type (Hardware, Solution), offering a granular view of market penetration and future potential.
Power Plant Performance Optimization Solution Market Dynamics & Structure
The Power Plant Performance Optimization Solution market exhibits a moderately concentrated structure, driven by significant investments in digitalization and operational efficiency across the power generation sector. Technological innovation is a primary driver, with advancements in AI, machine learning, IoT, and advanced analytics enabling predictive maintenance, real-time performance monitoring, and enhanced energy output. Regulatory frameworks, particularly those promoting emissions reduction and grid stability, also play a crucial role in shaping market adoption. Competitive product substitutes, while present in the form of manual monitoring or basic control systems, are increasingly being outpaced by the sophisticated capabilities offered by dedicated optimization solutions. End-user demographics are diverse, encompassing utility companies, independent power producers, and industrial facilities with captive power generation. Mergers and acquisitions (M&A) trends are observed as larger players consolidate their offerings and expand their market reach. For instance, the historical period witnessed an average of 3-5 significant M&A deals annually, with an estimated aggregate value of $500 million to $1 billion per year, aimed at acquiring specialized technologies or expanding customer bases. Innovation barriers include the high initial investment costs for implementation and the need for skilled personnel to manage and interpret complex data streams.
Power Plant Performance Optimization Solution Growth Trends & Insights
The Power Plant Performance Optimization Solution market is poised for robust expansion, projected to grow at a Compound Annual Growth Rate (CAGR) of approximately 8.5% during the forecast period. This impressive growth is underpinned by a confluence of factors, including the escalating demand for clean and efficient energy, the aging infrastructure of existing power plants, and the relentless drive to reduce operational expenditures and carbon footprints. The market size, estimated at around $12,000 million in 2025, is expected to reach approximately $23,000 million by 2033. Adoption rates are accelerating, particularly in regions with stringent environmental regulations and a high penetration of renewable energy sources that necessitate advanced grid management. Technological disruptions, such as the integration of digital twins for simulation and scenario planning, and the application of AI for anomaly detection and fault prediction, are significantly enhancing the value proposition of these solutions. Consumer behavior is shifting towards prioritizing data-driven decision-making and a proactive approach to plant maintenance and performance enhancement. Market penetration is currently estimated at around 35% for advanced solutions, with significant room for growth, especially in emerging economies. The increasing focus on operational resilience and the mitigation of power outages further fuels the demand for these sophisticated optimization tools.
Dominant Regions, Countries, or Segments in Power Plant Performance Optimization Solution
The Large Power Plants (more than 1000MW) segment, particularly within the Solution type, is currently dominating the global Power Plant Performance Optimization Solution market. This dominance is attributed to the substantial economic incentives for optimizing the output and efficiency of these high-capacity facilities. Large power plants often represent significant capital investments, making even marginal improvements in performance translate into substantial cost savings and revenue gains. The market share for this segment is estimated to be around 45% of the overall market in 2025.
Key Drivers in Large Power Plants (Solution):
- Economic Imperative: High operational costs and the potential for substantial savings through optimization make these plants prime candidates for advanced solutions. A 1% increase in efficiency can translate to millions of dollars in annual savings.
- Regulatory Pressures: Stringent emission standards and energy efficiency mandates are compelling operators of large plants to invest in solutions that minimize environmental impact and maximize output.
- Complexity of Operations: Managing the intricate operations of large-scale power generation requires sophisticated tools for real-time monitoring, predictive analytics, and automated control.
- Technological Advancements: The availability of advanced AI, IoT, and cloud-based platforms makes comprehensive optimization solutions feasible and highly effective for these complex systems.
- Infrastructure Investment: Countries with well-established and expanding large-scale power generation infrastructure, such as North America and Europe, exhibit higher adoption rates.
Growth Potential in Large Power Plants (Solution): The continued drive for decarbonization and grid modernization ensures sustained demand for optimization solutions in this segment. Furthermore, the integration of variable renewable energy sources into larger grids further necessitates sophisticated control and optimization strategies for thermal power plants to ensure grid stability, thus fueling the growth of solution-based optimization. The market for solutions in this segment is projected to grow at a CAGR of approximately 9.0%.
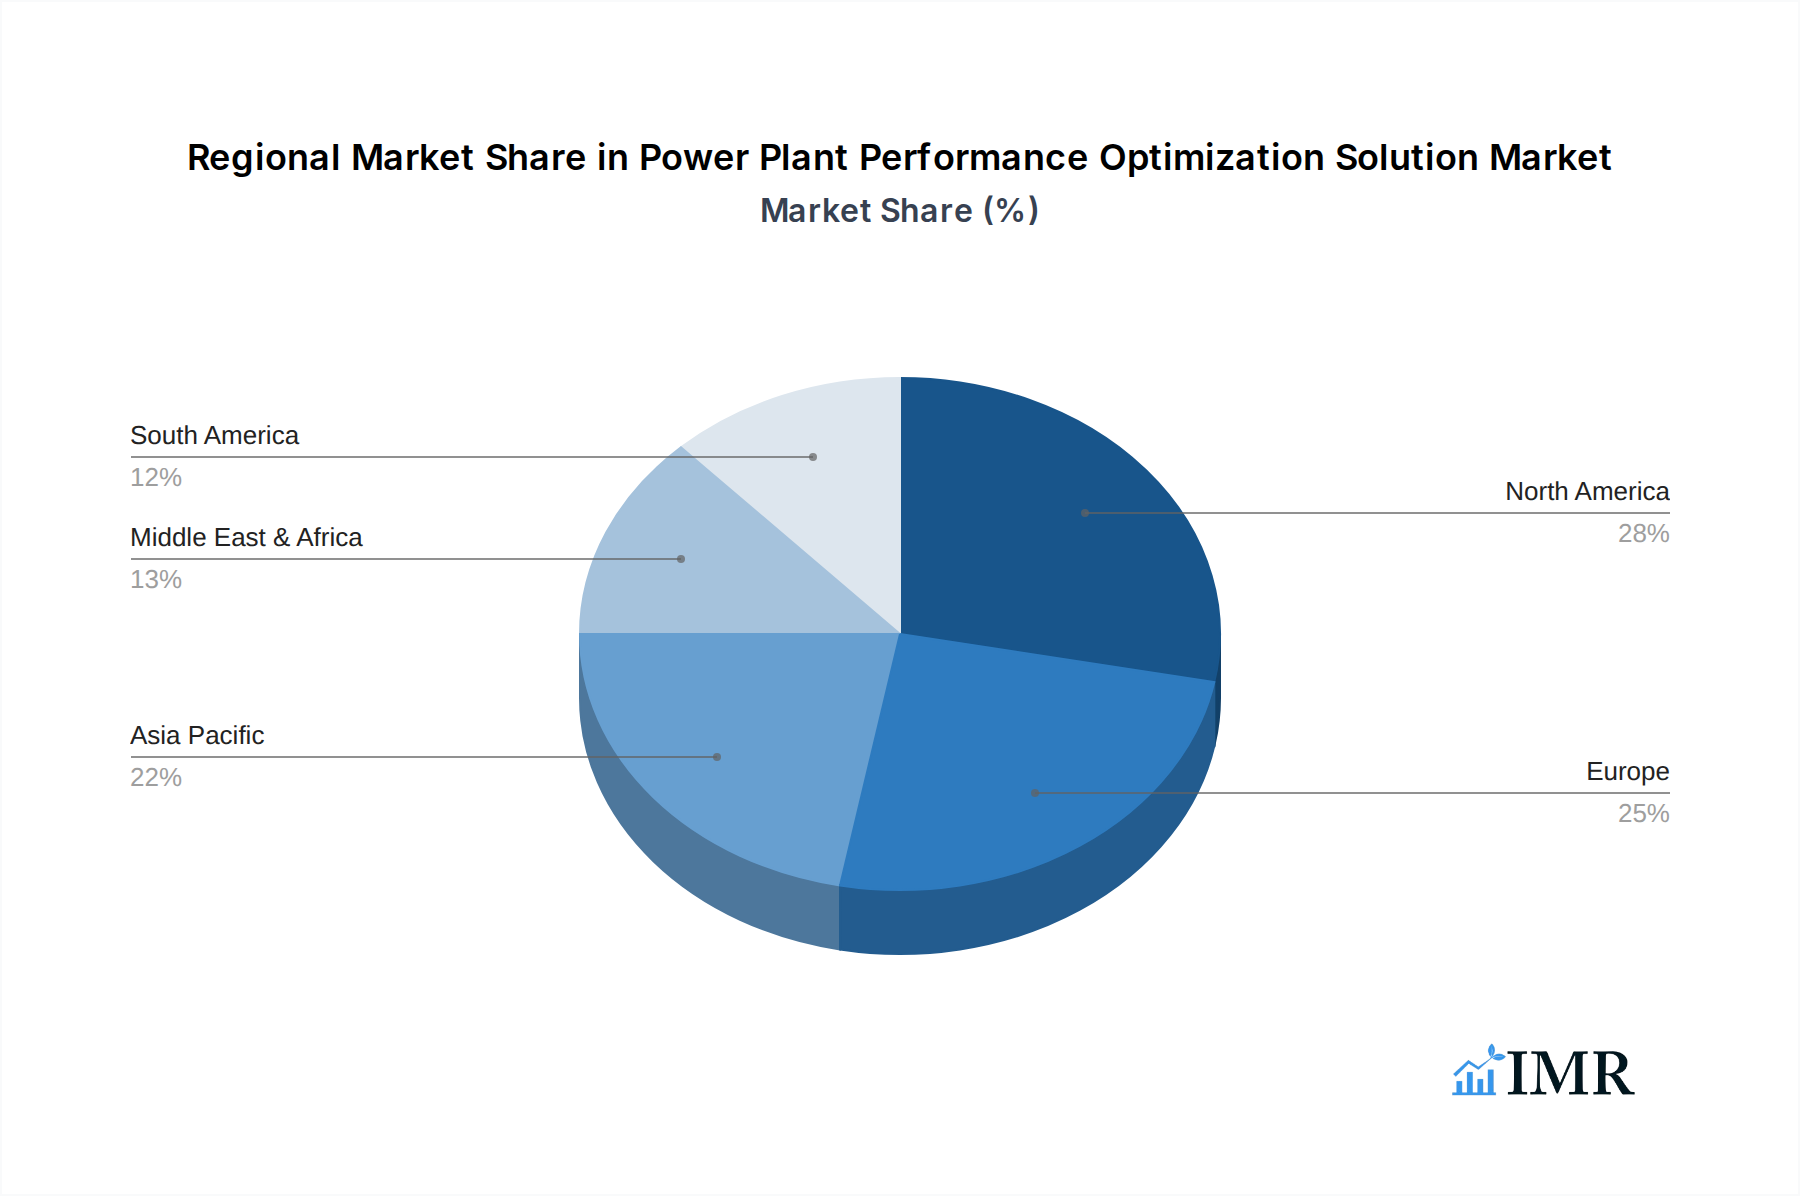
Regional Dominance: North America and Europe currently lead in the adoption of Power Plant Performance Optimization Solutions, driven by mature energy markets, advanced technological infrastructure, and stringent environmental regulations. Their market share combined is estimated to be over 60% in 2025.
Power Plant Performance Optimization Solution Product Landscape
The product landscape is characterized by a convergence of advanced software platforms and sophisticated hardware components. Innovations focus on predictive analytics leveraging machine learning for early detection of equipment failures, AI-powered control systems for real-time performance tuning, and digital twin technologies for simulating operational scenarios and optimizing plant configurations. Applications range from optimizing combustion processes and reducing emissions to enhancing turbine efficiency and managing fuel consumption. Performance metrics are rigorously tracked, with solutions offering demonstrable improvements in power output by up to 5%, fuel efficiency by 3-7%, and reductions in unscheduled downtime by 10-20%. The unique selling proposition lies in the ability of these solutions to provide holistic, data-driven insights for maximizing plant profitability and operational longevity.
Key Drivers, Barriers & Challenges in Power Plant Performance Optimization Solution
Key Drivers:
- Increasing Demand for Energy Efficiency: Global energy consumption growth and the imperative to reduce operational costs drive the need for optimized power plant performance.
- Stringent Environmental Regulations: Policies aimed at reducing emissions and promoting sustainable energy practices necessitate advanced optimization solutions.
- Technological Advancements: AI, IoT, big data analytics, and cloud computing enable more sophisticated and effective performance optimization.
- Aging Infrastructure: Many existing power plants require modernization and efficiency upgrades, making optimization solutions a cost-effective alternative to complete replacement.
- Predictive Maintenance Benefits: Shifting from reactive to proactive maintenance significantly reduces downtime and repair costs.
Barriers & Challenges:
- High Initial Investment Costs: The upfront capital expenditure for implementing advanced optimization solutions can be a significant barrier for some operators, estimated to be in the range of $1 million to $10 million per plant, depending on scale and complexity.
- Integration Complexity: Integrating new optimization systems with legacy plant infrastructure can be technically challenging and time-consuming.
- Cybersecurity Concerns: The increasing reliance on connected systems raises concerns about data security and the potential for cyber-attacks.
- Skilled Workforce Shortage: A lack of trained personnel to manage, operate, and interpret data from complex optimization systems can hinder adoption.
- Data Standardization and Interoperability: Lack of standardized data formats across different plant equipment and systems can impede seamless integration and analysis, with an estimated 20-30% of potential data being unusable due to format inconsistencies.
Emerging Opportunities in Power Plant Performance Optimization Solution
Emerging opportunities lie in the integration of AI-driven decarbonization strategies, enabling power plants to more effectively manage and integrate renewable energy sources while optimizing their conventional operations. The development of advanced digital twins for simulating complex grid interactions and optimizing plant response to fluctuating renewable energy input presents a significant growth avenue. Furthermore, the expanding market for small and medium-sized power plants, particularly in developing economies, offers untapped potential for tailored optimization solutions. The increasing focus on energy storage integration and its optimization with power generation further opens new frontiers.
Growth Accelerators in the Power Plant Performance Optimization Solution Industry
Long-term growth is being accelerated by continuous technological breakthroughs in artificial intelligence and machine learning, leading to more sophisticated predictive capabilities and autonomous control systems. Strategic partnerships between technology providers, Original Equipment Manufacturers (OEMs), and utility companies are crucial for co-developing and deploying tailored solutions. Market expansion strategies, including focusing on emerging economies with rapidly growing energy demands and government initiatives to modernize power infrastructure, will also serve as significant growth catalysts. The development of modular and scalable optimization solutions catering to diverse plant sizes and types will further broaden market reach.
Key Players Shaping the Power Plant Performance Optimization Solution Market
- ABB
- Honeywell
- Siemens
- Emerson
- Zeeco
- Yokogawa Electric Corporation
- Valmet
- DURAG
- Fuji Electric
- Focused Photonics (Hangzhou)
- Yantai Longyuan Power Technology
- VetterTec
- Environmental Energy Services
- GE Vernova
- Schneider Electric
- Rockwell Automation
- AVEVA
- AspenTech
- Bentley Systems
- IBM
- AVAT Automation
- Microbeam Technologies, Inc
Notable Milestones in Power Plant Performance Optimization Solution Sector
- 2021: Siemens launches an AI-powered digital twin solution for gas turbines, enhancing predictive maintenance capabilities.
- 2022: Honeywell announces strategic collaborations to integrate its industrial IoT platform with advanced analytics for power plant optimization.
- 2023 (Q1): GE Vernova unveils a new suite of digital services focused on fleet-wide performance monitoring and optimization for renewable and traditional power generation.
- 2023 (Q3): AspenTech enhances its asset performance management software with advanced machine learning algorithms for power plant efficiency.
- 2024 (Q1): ABB introduces a cloud-based platform for real-time energy management and optimization across distributed power assets.
In-Depth Power Plant Performance Optimization Solution Market Outlook
The future of the Power Plant Performance Optimization Solution market is exceptionally promising, driven by the persistent global demand for reliable, efficient, and sustainable energy. Growth accelerators such as advancements in AI for predictive analytics and autonomous operations, coupled with strategic alliances between technology giants and energy sector players, will continue to propel the market forward. The increasing adoption of digital twins for enhanced simulation and operational planning, alongside the expansion into emerging markets and the development of modular solutions, will unlock significant future potential and create lucrative strategic opportunities for all stakeholders.
Power Plant Performance Optimization Solution Segmentation
-
1. Application
- 1.1. Small Power Plants (less than 100MW)
- 1.2. Medium Power Plants (100-250MW)
- 1.3. Large and Medium Power Plants (250-1000MW)
- 1.4. Large Power Plants (more than 1000MW)
-
2. Type
- 2.1. Hardware
- 2.2. Solution
Power Plant Performance Optimization Solution Segmentation By Geography
-
1. North America
- 1.1. United States
- 1.2. Canada
- 1.3. Mexico
-
2. South America
- 2.1. Brazil
- 2.2. Argentina
- 2.3. Rest of South America
-
3. Europe
- 3.1. United Kingdom
- 3.2. Germany
- 3.3. France
- 3.4. Italy
- 3.5. Spain
- 3.6. Russia
- 3.7. Benelux
- 3.8. Nordics
- 3.9. Rest of Europe
-
4. Middle East & Africa
- 4.1. Turkey
- 4.2. Israel
- 4.3. GCC
- 4.4. North Africa
- 4.5. South Africa
- 4.6. Rest of Middle East & Africa
-
5. Asia Pacific
- 5.1. China
- 5.2. India
- 5.3. Japan
- 5.4. South Korea
- 5.5. ASEAN
- 5.6. Oceania
- 5.7. Rest of Asia Pacific
Power Plant Performance Optimization Solution Regional Market Share
Geographic Coverage of Power Plant Performance Optimization Solution
Power Plant Performance Optimization Solution REPORT HIGHLIGHTS
| Aspects | Details |
|---|---|
| Study Period | 2020-2034 |
| Base Year | 2025 |
| Estimated Year | 2026 |
| Forecast Period | 2026-2034 |
| Historical Period | 2020-2025 |
| Growth Rate | CAGR of 6.5% from 2020-2034 |
| Segmentation |
|
Table of Contents
- 1. Introduction
- 1.1. Research Scope
- 1.2. Market Segmentation
- 1.3. Research Methodology
- 1.4. Definitions and Assumptions
- 2. Executive Summary
- 2.1. Introduction
- 3. Market Dynamics
- 3.1. Introduction
- 3.2. Market Drivers
- 3.3. Market Restrains
- 3.4. Market Trends
- 4. Market Factor Analysis
- 4.1. Porters Five Forces
- 4.2. Supply/Value Chain
- 4.3. PESTEL analysis
- 4.4. Market Entropy
- 4.5. Patent/Trademark Analysis
- 5. Global Power Plant Performance Optimization Solution Analysis, Insights and Forecast, 2020-2032
- 5.1. Market Analysis, Insights and Forecast - by Application
- 5.1.1. Small Power Plants (less than 100MW)
- 5.1.2. Medium Power Plants (100-250MW)
- 5.1.3. Large and Medium Power Plants (250-1000MW)
- 5.1.4. Large Power Plants (more than 1000MW)
- 5.2. Market Analysis, Insights and Forecast - by Type
- 5.2.1. Hardware
- 5.2.2. Solution
- 5.3. Market Analysis, Insights and Forecast - by Region
- 5.3.1. North America
- 5.3.2. South America
- 5.3.3. Europe
- 5.3.4. Middle East & Africa
- 5.3.5. Asia Pacific
- 5.1. Market Analysis, Insights and Forecast - by Application
- 6. North America Power Plant Performance Optimization Solution Analysis, Insights and Forecast, 2020-2032
- 6.1. Market Analysis, Insights and Forecast - by Application
- 6.1.1. Small Power Plants (less than 100MW)
- 6.1.2. Medium Power Plants (100-250MW)
- 6.1.3. Large and Medium Power Plants (250-1000MW)
- 6.1.4. Large Power Plants (more than 1000MW)
- 6.2. Market Analysis, Insights and Forecast - by Type
- 6.2.1. Hardware
- 6.2.2. Solution
- 6.1. Market Analysis, Insights and Forecast - by Application
- 7. South America Power Plant Performance Optimization Solution Analysis, Insights and Forecast, 2020-2032
- 7.1. Market Analysis, Insights and Forecast - by Application
- 7.1.1. Small Power Plants (less than 100MW)
- 7.1.2. Medium Power Plants (100-250MW)
- 7.1.3. Large and Medium Power Plants (250-1000MW)
- 7.1.4. Large Power Plants (more than 1000MW)
- 7.2. Market Analysis, Insights and Forecast - by Type
- 7.2.1. Hardware
- 7.2.2. Solution
- 7.1. Market Analysis, Insights and Forecast - by Application
- 8. Europe Power Plant Performance Optimization Solution Analysis, Insights and Forecast, 2020-2032
- 8.1. Market Analysis, Insights and Forecast - by Application
- 8.1.1. Small Power Plants (less than 100MW)
- 8.1.2. Medium Power Plants (100-250MW)
- 8.1.3. Large and Medium Power Plants (250-1000MW)
- 8.1.4. Large Power Plants (more than 1000MW)
- 8.2. Market Analysis, Insights and Forecast - by Type
- 8.2.1. Hardware
- 8.2.2. Solution
- 8.1. Market Analysis, Insights and Forecast - by Application
- 9. Middle East & Africa Power Plant Performance Optimization Solution Analysis, Insights and Forecast, 2020-2032
- 9.1. Market Analysis, Insights and Forecast - by Application
- 9.1.1. Small Power Plants (less than 100MW)
- 9.1.2. Medium Power Plants (100-250MW)
- 9.1.3. Large and Medium Power Plants (250-1000MW)
- 9.1.4. Large Power Plants (more than 1000MW)
- 9.2. Market Analysis, Insights and Forecast - by Type
- 9.2.1. Hardware
- 9.2.2. Solution
- 9.1. Market Analysis, Insights and Forecast - by Application
- 10. Asia Pacific Power Plant Performance Optimization Solution Analysis, Insights and Forecast, 2020-2032
- 10.1. Market Analysis, Insights and Forecast - by Application
- 10.1.1. Small Power Plants (less than 100MW)
- 10.1.2. Medium Power Plants (100-250MW)
- 10.1.3. Large and Medium Power Plants (250-1000MW)
- 10.1.4. Large Power Plants (more than 1000MW)
- 10.2. Market Analysis, Insights and Forecast - by Type
- 10.2.1. Hardware
- 10.2.2. Solution
- 10.1. Market Analysis, Insights and Forecast - by Application
- 11. Competitive Analysis
- 11.1. Global Market Share Analysis 2025
- 11.2. Company Profiles
- 11.2.1 ABB
- 11.2.1.1. Overview
- 11.2.1.2. Products
- 11.2.1.3. SWOT Analysis
- 11.2.1.4. Recent Developments
- 11.2.1.5. Financials (Based on Availability)
- 11.2.2 Honeywell
- 11.2.2.1. Overview
- 11.2.2.2. Products
- 11.2.2.3. SWOT Analysis
- 11.2.2.4. Recent Developments
- 11.2.2.5. Financials (Based on Availability)
- 11.2.3 Siemens
- 11.2.3.1. Overview
- 11.2.3.2. Products
- 11.2.3.3. SWOT Analysis
- 11.2.3.4. Recent Developments
- 11.2.3.5. Financials (Based on Availability)
- 11.2.4 Emerson
- 11.2.4.1. Overview
- 11.2.4.2. Products
- 11.2.4.3. SWOT Analysis
- 11.2.4.4. Recent Developments
- 11.2.4.5. Financials (Based on Availability)
- 11.2.5 Zeeco
- 11.2.5.1. Overview
- 11.2.5.2. Products
- 11.2.5.3. SWOT Analysis
- 11.2.5.4. Recent Developments
- 11.2.5.5. Financials (Based on Availability)
- 11.2.6 Yokogawa Electric Corporation
- 11.2.6.1. Overview
- 11.2.6.2. Products
- 11.2.6.3. SWOT Analysis
- 11.2.6.4. Recent Developments
- 11.2.6.5. Financials (Based on Availability)
- 11.2.7 Valmet
- 11.2.7.1. Overview
- 11.2.7.2. Products
- 11.2.7.3. SWOT Analysis
- 11.2.7.4. Recent Developments
- 11.2.7.5. Financials (Based on Availability)
- 11.2.8 DURAG
- 11.2.8.1. Overview
- 11.2.8.2. Products
- 11.2.8.3. SWOT Analysis
- 11.2.8.4. Recent Developments
- 11.2.8.5. Financials (Based on Availability)
- 11.2.9 Fuji Electric
- 11.2.9.1. Overview
- 11.2.9.2. Products
- 11.2.9.3. SWOT Analysis
- 11.2.9.4. Recent Developments
- 11.2.9.5. Financials (Based on Availability)
- 11.2.10 Focused Photonics (Hangzhou)
- 11.2.10.1. Overview
- 11.2.10.2. Products
- 11.2.10.3. SWOT Analysis
- 11.2.10.4. Recent Developments
- 11.2.10.5. Financials (Based on Availability)
- 11.2.11 Yantai Longyuan Power Technology
- 11.2.11.1. Overview
- 11.2.11.2. Products
- 11.2.11.3. SWOT Analysis
- 11.2.11.4. Recent Developments
- 11.2.11.5. Financials (Based on Availability)
- 11.2.12 VetterTec
- 11.2.12.1. Overview
- 11.2.12.2. Products
- 11.2.12.3. SWOT Analysis
- 11.2.12.4. Recent Developments
- 11.2.12.5. Financials (Based on Availability)
- 11.2.13 Environmental Energy Services
- 11.2.13.1. Overview
- 11.2.13.2. Products
- 11.2.13.3. SWOT Analysis
- 11.2.13.4. Recent Developments
- 11.2.13.5. Financials (Based on Availability)
- 11.2.14 GE Vernova
- 11.2.14.1. Overview
- 11.2.14.2. Products
- 11.2.14.3. SWOT Analysis
- 11.2.14.4. Recent Developments
- 11.2.14.5. Financials (Based on Availability)
- 11.2.15 Schneider Electric
- 11.2.15.1. Overview
- 11.2.15.2. Products
- 11.2.15.3. SWOT Analysis
- 11.2.15.4. Recent Developments
- 11.2.15.5. Financials (Based on Availability)
- 11.2.16 Rockwell Automation
- 11.2.16.1. Overview
- 11.2.16.2. Products
- 11.2.16.3. SWOT Analysis
- 11.2.16.4. Recent Developments
- 11.2.16.5. Financials (Based on Availability)
- 11.2.17 AVEVA
- 11.2.17.1. Overview
- 11.2.17.2. Products
- 11.2.17.3. SWOT Analysis
- 11.2.17.4. Recent Developments
- 11.2.17.5. Financials (Based on Availability)
- 11.2.18 AspenTech
- 11.2.18.1. Overview
- 11.2.18.2. Products
- 11.2.18.3. SWOT Analysis
- 11.2.18.4. Recent Developments
- 11.2.18.5. Financials (Based on Availability)
- 11.2.19 Bentley Systems
- 11.2.19.1. Overview
- 11.2.19.2. Products
- 11.2.19.3. SWOT Analysis
- 11.2.19.4. Recent Developments
- 11.2.19.5. Financials (Based on Availability)
- 11.2.20 IBM
- 11.2.20.1. Overview
- 11.2.20.2. Products
- 11.2.20.3. SWOT Analysis
- 11.2.20.4. Recent Developments
- 11.2.20.5. Financials (Based on Availability)
- 11.2.21 AVAT Automation
- 11.2.21.1. Overview
- 11.2.21.2. Products
- 11.2.21.3. SWOT Analysis
- 11.2.21.4. Recent Developments
- 11.2.21.5. Financials (Based on Availability)
- 11.2.22 Microbeam Technologies Inc
- 11.2.22.1. Overview
- 11.2.22.2. Products
- 11.2.22.3. SWOT Analysis
- 11.2.22.4. Recent Developments
- 11.2.22.5. Financials (Based on Availability)
- 11.2.1 ABB
List of Figures
- Figure 1: Global Power Plant Performance Optimization Solution Revenue Breakdown (million, %) by Region 2025 & 2033
- Figure 2: North America Power Plant Performance Optimization Solution Revenue (million), by Application 2025 & 2033
- Figure 3: North America Power Plant Performance Optimization Solution Revenue Share (%), by Application 2025 & 2033
- Figure 4: North America Power Plant Performance Optimization Solution Revenue (million), by Type 2025 & 2033
- Figure 5: North America Power Plant Performance Optimization Solution Revenue Share (%), by Type 2025 & 2033
- Figure 6: North America Power Plant Performance Optimization Solution Revenue (million), by Country 2025 & 2033
- Figure 7: North America Power Plant Performance Optimization Solution Revenue Share (%), by Country 2025 & 2033
- Figure 8: South America Power Plant Performance Optimization Solution Revenue (million), by Application 2025 & 2033
- Figure 9: South America Power Plant Performance Optimization Solution Revenue Share (%), by Application 2025 & 2033
- Figure 10: South America Power Plant Performance Optimization Solution Revenue (million), by Type 2025 & 2033
- Figure 11: South America Power Plant Performance Optimization Solution Revenue Share (%), by Type 2025 & 2033
- Figure 12: South America Power Plant Performance Optimization Solution Revenue (million), by Country 2025 & 2033
- Figure 13: South America Power Plant Performance Optimization Solution Revenue Share (%), by Country 2025 & 2033
- Figure 14: Europe Power Plant Performance Optimization Solution Revenue (million), by Application 2025 & 2033
- Figure 15: Europe Power Plant Performance Optimization Solution Revenue Share (%), by Application 2025 & 2033
- Figure 16: Europe Power Plant Performance Optimization Solution Revenue (million), by Type 2025 & 2033
- Figure 17: Europe Power Plant Performance Optimization Solution Revenue Share (%), by Type 2025 & 2033
- Figure 18: Europe Power Plant Performance Optimization Solution Revenue (million), by Country 2025 & 2033
- Figure 19: Europe Power Plant Performance Optimization Solution Revenue Share (%), by Country 2025 & 2033
- Figure 20: Middle East & Africa Power Plant Performance Optimization Solution Revenue (million), by Application 2025 & 2033
- Figure 21: Middle East & Africa Power Plant Performance Optimization Solution Revenue Share (%), by Application 2025 & 2033
- Figure 22: Middle East & Africa Power Plant Performance Optimization Solution Revenue (million), by Type 2025 & 2033
- Figure 23: Middle East & Africa Power Plant Performance Optimization Solution Revenue Share (%), by Type 2025 & 2033
- Figure 24: Middle East & Africa Power Plant Performance Optimization Solution Revenue (million), by Country 2025 & 2033
- Figure 25: Middle East & Africa Power Plant Performance Optimization Solution Revenue Share (%), by Country 2025 & 2033
- Figure 26: Asia Pacific Power Plant Performance Optimization Solution Revenue (million), by Application 2025 & 2033
- Figure 27: Asia Pacific Power Plant Performance Optimization Solution Revenue Share (%), by Application 2025 & 2033
- Figure 28: Asia Pacific Power Plant Performance Optimization Solution Revenue (million), by Type 2025 & 2033
- Figure 29: Asia Pacific Power Plant Performance Optimization Solution Revenue Share (%), by Type 2025 & 2033
- Figure 30: Asia Pacific Power Plant Performance Optimization Solution Revenue (million), by Country 2025 & 2033
- Figure 31: Asia Pacific Power Plant Performance Optimization Solution Revenue Share (%), by Country 2025 & 2033
List of Tables
- Table 1: Global Power Plant Performance Optimization Solution Revenue million Forecast, by Application 2020 & 2033
- Table 2: Global Power Plant Performance Optimization Solution Revenue million Forecast, by Type 2020 & 2033
- Table 3: Global Power Plant Performance Optimization Solution Revenue million Forecast, by Region 2020 & 2033
- Table 4: Global Power Plant Performance Optimization Solution Revenue million Forecast, by Application 2020 & 2033
- Table 5: Global Power Plant Performance Optimization Solution Revenue million Forecast, by Type 2020 & 2033
- Table 6: Global Power Plant Performance Optimization Solution Revenue million Forecast, by Country 2020 & 2033
- Table 7: United States Power Plant Performance Optimization Solution Revenue (million) Forecast, by Application 2020 & 2033
- Table 8: Canada Power Plant Performance Optimization Solution Revenue (million) Forecast, by Application 2020 & 2033
- Table 9: Mexico Power Plant Performance Optimization Solution Revenue (million) Forecast, by Application 2020 & 2033
- Table 10: Global Power Plant Performance Optimization Solution Revenue million Forecast, by Application 2020 & 2033
- Table 11: Global Power Plant Performance Optimization Solution Revenue million Forecast, by Type 2020 & 2033
- Table 12: Global Power Plant Performance Optimization Solution Revenue million Forecast, by Country 2020 & 2033
- Table 13: Brazil Power Plant Performance Optimization Solution Revenue (million) Forecast, by Application 2020 & 2033
- Table 14: Argentina Power Plant Performance Optimization Solution Revenue (million) Forecast, by Application 2020 & 2033
- Table 15: Rest of South America Power Plant Performance Optimization Solution Revenue (million) Forecast, by Application 2020 & 2033
- Table 16: Global Power Plant Performance Optimization Solution Revenue million Forecast, by Application 2020 & 2033
- Table 17: Global Power Plant Performance Optimization Solution Revenue million Forecast, by Type 2020 & 2033
- Table 18: Global Power Plant Performance Optimization Solution Revenue million Forecast, by Country 2020 & 2033
- Table 19: United Kingdom Power Plant Performance Optimization Solution Revenue (million) Forecast, by Application 2020 & 2033
- Table 20: Germany Power Plant Performance Optimization Solution Revenue (million) Forecast, by Application 2020 & 2033
- Table 21: France Power Plant Performance Optimization Solution Revenue (million) Forecast, by Application 2020 & 2033
- Table 22: Italy Power Plant Performance Optimization Solution Revenue (million) Forecast, by Application 2020 & 2033
- Table 23: Spain Power Plant Performance Optimization Solution Revenue (million) Forecast, by Application 2020 & 2033
- Table 24: Russia Power Plant Performance Optimization Solution Revenue (million) Forecast, by Application 2020 & 2033
- Table 25: Benelux Power Plant Performance Optimization Solution Revenue (million) Forecast, by Application 2020 & 2033
- Table 26: Nordics Power Plant Performance Optimization Solution Revenue (million) Forecast, by Application 2020 & 2033
- Table 27: Rest of Europe Power Plant Performance Optimization Solution Revenue (million) Forecast, by Application 2020 & 2033
- Table 28: Global Power Plant Performance Optimization Solution Revenue million Forecast, by Application 2020 & 2033
- Table 29: Global Power Plant Performance Optimization Solution Revenue million Forecast, by Type 2020 & 2033
- Table 30: Global Power Plant Performance Optimization Solution Revenue million Forecast, by Country 2020 & 2033
- Table 31: Turkey Power Plant Performance Optimization Solution Revenue (million) Forecast, by Application 2020 & 2033
- Table 32: Israel Power Plant Performance Optimization Solution Revenue (million) Forecast, by Application 2020 & 2033
- Table 33: GCC Power Plant Performance Optimization Solution Revenue (million) Forecast, by Application 2020 & 2033
- Table 34: North Africa Power Plant Performance Optimization Solution Revenue (million) Forecast, by Application 2020 & 2033
- Table 35: South Africa Power Plant Performance Optimization Solution Revenue (million) Forecast, by Application 2020 & 2033
- Table 36: Rest of Middle East & Africa Power Plant Performance Optimization Solution Revenue (million) Forecast, by Application 2020 & 2033
- Table 37: Global Power Plant Performance Optimization Solution Revenue million Forecast, by Application 2020 & 2033
- Table 38: Global Power Plant Performance Optimization Solution Revenue million Forecast, by Type 2020 & 2033
- Table 39: Global Power Plant Performance Optimization Solution Revenue million Forecast, by Country 2020 & 2033
- Table 40: China Power Plant Performance Optimization Solution Revenue (million) Forecast, by Application 2020 & 2033
- Table 41: India Power Plant Performance Optimization Solution Revenue (million) Forecast, by Application 2020 & 2033
- Table 42: Japan Power Plant Performance Optimization Solution Revenue (million) Forecast, by Application 2020 & 2033
- Table 43: South Korea Power Plant Performance Optimization Solution Revenue (million) Forecast, by Application 2020 & 2033
- Table 44: ASEAN Power Plant Performance Optimization Solution Revenue (million) Forecast, by Application 2020 & 2033
- Table 45: Oceania Power Plant Performance Optimization Solution Revenue (million) Forecast, by Application 2020 & 2033
- Table 46: Rest of Asia Pacific Power Plant Performance Optimization Solution Revenue (million) Forecast, by Application 2020 & 2033
Frequently Asked Questions
1. What is the projected Compound Annual Growth Rate (CAGR) of the Power Plant Performance Optimization Solution?
The projected CAGR is approximately 6.5%.
2. Which companies are prominent players in the Power Plant Performance Optimization Solution?
Key companies in the market include ABB, Honeywell, Siemens, Emerson, Zeeco, Yokogawa Electric Corporation, Valmet, DURAG, Fuji Electric, Focused Photonics (Hangzhou), Yantai Longyuan Power Technology, VetterTec, Environmental Energy Services, GE Vernova, Schneider Electric, Rockwell Automation, AVEVA, AspenTech, Bentley Systems, IBM, AVAT Automation, Microbeam Technologies, Inc.
3. What are the main segments of the Power Plant Performance Optimization Solution?
The market segments include Application, Type.
4. Can you provide details about the market size?
The market size is estimated to be USD 3429 million as of 2022.
5. What are some drivers contributing to market growth?
N/A
6. What are the notable trends driving market growth?
N/A
7. Are there any restraints impacting market growth?
N/A
8. Can you provide examples of recent developments in the market?
N/A
9. What pricing options are available for accessing the report?
Pricing options include single-user, multi-user, and enterprise licenses priced at USD 4900.00, USD 7350.00, and USD 9800.00 respectively.
10. Is the market size provided in terms of value or volume?
The market size is provided in terms of value, measured in million.
11. Are there any specific market keywords associated with the report?
Yes, the market keyword associated with the report is "Power Plant Performance Optimization Solution," which aids in identifying and referencing the specific market segment covered.
12. How do I determine which pricing option suits my needs best?
The pricing options vary based on user requirements and access needs. Individual users may opt for single-user licenses, while businesses requiring broader access may choose multi-user or enterprise licenses for cost-effective access to the report.
13. Are there any additional resources or data provided in the Power Plant Performance Optimization Solution report?
While the report offers comprehensive insights, it's advisable to review the specific contents or supplementary materials provided to ascertain if additional resources or data are available.
14. How can I stay updated on further developments or reports in the Power Plant Performance Optimization Solution?
To stay informed about further developments, trends, and reports in the Power Plant Performance Optimization Solution, consider subscribing to industry newsletters, following relevant companies and organizations, or regularly checking reputable industry news sources and publications.
Methodology
Step 1 - Identification of Relevant Samples Size from Population Database


Step 2 - Approaches for Defining Global Market Size (Value, Volume* & Price*)

Note*: In applicable scenarios
Step 3 - Data Sources
Primary Research
- Web Analytics
- Survey Reports
- Research Institute
- Latest Research Reports
- Opinion Leaders
Secondary Research
- Annual Reports
- White Paper
- Latest Press Release
- Industry Association
- Paid Database
- Investor Presentations

Step 4 - Data Triangulation
Involves using different sources of information in order to increase the validity of a study
These sources are likely to be stakeholders in a program - participants, other researchers, program staff, other community members, and so on.
Then we put all data in single framework & apply various statistical tools to find out the dynamic on the market.
During the analysis stage, feedback from the stakeholder groups would be compared to determine areas of agreement as well as areas of divergence